Minorities of Romania
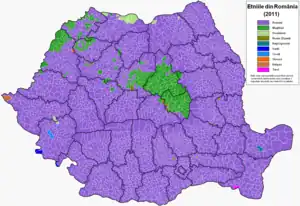
About 9.3% of Romania's population is represented by minorities (the rest of 77.7% being Romanians), and 13% unknown or undisclosed according to 2021 census.[1] The principal minorities in Romania are Hungarians (Szeklers, Csangos, and Magyars; especially in Harghita, Covasna, and Mureș counties) and Romani people, with a declining German population (in Timiș, Sibiu, Brașov, or Suceava) and smaller numbers of Poles in Bukovina (Austria-Hungary attracted Polish miners, who settled there from the Kraków region in contemporary Poland during the 19th century), Serbs, Croats, Slovaks and Banat Bulgarians (in Banat), Ukrainians (in Maramureș and Bukovina), Greeks (Brăila, Constanța), Jews (Wallachia, Bucharest), Turks and Tatars (in Constanța), Armenians, Russians (Lipovans, in Tulcea), Afro-Romanians, and others.
| Part of a series on the |
| Culture of Romania |
|---|
 |
| People |
| Languages |
| Sport |
To this day, minority populations are greatest in Transylvania and the Banat, historical regions situated in the north and west of the country which were former territorial possessions of either the Kingdom of Hungary, the Habsburgs, or the Austrian Empire (since 1867 the dual monarchy of Austria-Hungary until World War I).
Before World War II, minorities represented more than 28% of the total population. During the war that percentage was halved, largely by the loss of the border areas of Bessarabia and northern Bukovina (to the former Soviet Union, now Republic of Moldova and Ukraine), Black Sea islands (to the former Soviet Union, now Ukraine), and southern Dobrudja (to Bulgaria), as well as by the postwar flight or deportation of ethnic Germans.
In the Romanian election law, government-recognized ethnic minorities in Romania are subject to a significantly lower threshold and have consequently won seats in the Chamber of Deputies since the fall of the Nicolae Ceauşescu regime.
Overview
In the table below are enlisted all minority ethnic groups from Romania with more than 1,000 persons (based on the 2002, 2011,and 2021 Romanian censuses):
| Minority | Population (2002) | Percentage of the total population (2002) | Population (2011) | Percentage of the total population (2011) | Population (2021) | Percentage of the total population (2021) | County |
|---|---|---|---|---|---|---|---|
| Hungarians (incl. Szeklers and Csangos) | 1,431,807 |
6.60% |
1,227,623 |
6.10% |
1,002,151 |
5.25% |
Mainly Transylvania, but also Bucharest |
| Roma | 535,140 |
2.46% |
621,573 |
3.08% |
569,477 |
2.99% |
Mureș, Călărași |
| Ukrainians (incl. Hutsuls and Rusyns) | 61,091 |
0.28% |
50,920 |
0.25% |
45,835 |
0.24% |
Maramureș, Timiș, Suceava |
| Germans[2] | 59,764 |
0.28% |
36,042 |
0.17% |
22,907 |
0.12% |
Timiș, Sibiu, Satu Mare, Caraș-Severin, Brașov, Mureș, Maramureș, Hunedoara, Alba, Bihor, Suceava, Bistrița-Năsăud, Transylvania |
| Russians (incl. Lipovans) | 35,791 |
0.17% |
23,487 |
0.11% |
19,394 |
0.10% |
Tulcea, Constanța, Iași, Suceava |
| Turks | 32,098 |
0.15% |
27,698 |
0.13% |
20,945 |
0.11% |
Constanța |
| Crimean Tatars | 23,935 |
0.11% |
20,282 |
0.10% |
18156 |
0.10% |
Constanța |
| Serbs | 22,518 |
0.10% |
18,076 |
0.08% |
12,026 |
0.06% |
Timiș, Arad, Caraș-Severin, Mehedinți |
| Slovaks | 17,199 |
0.08% |
13,654 |
0.06% |
12,026 |
0.06% |
Sălaj, Arad, Bihor, Suceava |
| Bulgarians | 8,025 |
0.04% |
7,336 |
0.04% |
5,975 |
0.03% |
Timiș |
| Croats (incl. Krašovani) | 6,786 |
0.03% |
5,408 |
0.03% |
4,842 |
0.025% |
Caraș-Severin |
| Greeks | 6,472 |
0.03% |
3,668 |
0.02% |
2,086 |
0.01% |
Constanța, Brăila, Transylvania |
| Jews | 5,785 |
0.03% |
3,271 |
0.02% |
2,378 |
0.01% |
Bucharest |
| Czechs | 3,938 |
0.02% |
2,477 |
0.01% |
1,576 |
0.008% |
Caraș-Severin, Mehedinți, Suceava |
| Poles | 3,559 |
0.02% |
2,543 |
0.01% |
2,137 |
0.01% |
Suceava, Bucharest |
| Italians | 3,288 |
0.02% |
3,203 |
0.02% |
4039 |
0.02% |
Bucharest, Constanța, Timiș |
| Chinese | 2,243 |
0.01% |
2,017 |
0.01% |
Bucharest | ||
| Armenians | 1,780 |
0.01% |
1,361 |
>0.01% |
1,213 |
>0.01% |
Cluj (city of Gherla) |
| Csángós | 1,266 |
0.01% |
1,536 |
>0.01% |
Bacău | ||
| Other lesser minorities and/or recent immigrants: | 13,653 |
0.06% |
18,524 |
0.10% |
19510 |
0.10% |
All counties of Romania |
| Total: | 2,276,138 |
10.49% |
2,091,963 |
10.39% |
1,767,447 |
9.28% |
Romania |
Hungarian minority in Romania


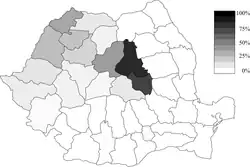
The Hungarian minority in Romania consists of 6.1% of the total population (1,227,623 citizens as per the 2011 census), being thus the largest ethnic minority of the country.[3]
Most ethnic Hungarians live in what is today known as Transylvania (where they make up about 16.79% of the population), an area that includes the historic regions of Banat, Crișana, and Maramureș. They form a large majority of the population only in Harghita and Covasna counties and a large percentage in the Mureș county.
Greek community
Among the towns and communes in Romania with the highest proportions of Greeks as of 2011 are Izvoarele (Greek: Ιζβοάρελε; 43.82%) and Sulina (Greek: Σουλινάς; 1.69%), both in Tulcea County.
According to the Romanian census of 2002, the Greek community numbered 6,472 persons, most of whom live in Bucharest and its surrounding area. Next in line come the Dobruja counties of Tulcea and Constanța, and the Danube-facing ones of Brăila and Galați. The 1992 census however found 19,594 Greeks;[4] this shows the tendency of assimilation. According to the General Secretariat for Greeks Abroad (a dependency of the Greek Ministry of Foreign Affairs) the Greek community in Romania numbers 14,000.[5]
The Hellenic Union of Romania, founded in 1990, represents the political and cultural preservation interests of the community, notably by providing its representatives in the Chamber of Deputies.
See also
- Afro-Romanians
- Albanians of Romania
- Arabs in Romania
- Armenians in Romania
- Aromanians in Romania
- Banat Bulgarians
- Bulgarians in Romania
- Chinese in Romania
- Crimean Tatars in Romania
- Croats of Romania
- Danube Swabians
- Germans of Romania
- Islam in Romania
- Italians of Romania
- Jews in Romania
- Krashovani (Croats)
- Lipovans
- Macedonians in Romania
- Megleno-Romanians
- Poles in Romania
- Romani people in Romania
- Romanian ethnic minorities parties
- Serbs of Romania
- Tatars in Romania
- Turks in Romania
- Ukrainians of Romania
- Walsers – Banat French
References
- Institutul Naţional de Statistică: Primele date provizorii pentru Recensământul Populației și Locuințelor, runda 2021
- Including Transylvanian Saxons, Transylvanian Landlers, Banat Swabians, Bukovina Germans, Sathmar Swabians, Regat Germans, Zipser Germans, and Dobrujan Germans.
- "The Euromosaic study Hungarian in Romania - General information". European Commission. Retrieved 12 July 2012.
- Greeks in Romania Archived 2006-01-04 at the Wayback Machine, eurominority.org. Accessed 15 December 2006.
- (in Greek) ΓΕΝΙΚΑ ΣΤΟΙΧΕΙΑ ΔΙΑΣΠΟΡΑΣ Archived 2008-07-16 at the Wayback Machine, ggae.gr. Accessed 15 December 2006.
External links
- Romanian Government – Department for Interethnic Relations
- Ministry of Education - Department for Education in the Languages of Ethnic Minorities – site in Romanian language
- Ethnocultural Diversity Resource Center
- Roma Women Association Romania
- The Jews of Romania
- Yiddish Theater. Bibliography and Discography
- Diversity, another way of speaking about ethnic minorities
- The Rastko Project – The Internet Library of the Serbs from Romania – in Romanian language
- Romania, a Europe in miniature. Brief presentation of national minorities. report by the Romanian Government
- Gerlinde Schuller: Archiving family memories and dreams – stories about the German minorities in Romania (with many archive images; English/German)
- Gerlinde Schuller: Preserving cultural heritage of Romanians minorities (with many images; English/German)
