Florida's 4th Senate district
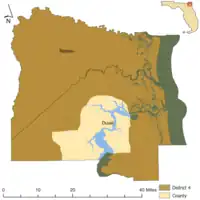
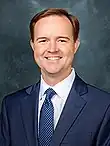
Florida's 4th Senate District elects one member of the Florida Senate. The district consists of Nassau county and part of Duval county, in the U.S. state of Florida. The current Senator is Republican Clay Yarborough.
List of Senators
| Florida's 4th State Senate district | |||
|---|---|---|---|
 | |||
| Senator |
| ||
| Demographics | 68.9%% White 12.3%% Black 10.3%% Hispanic 5.4%% Asian 0.3%% Native American 0.1%% Hawaiian/Pacific Islander | ||
| Population (2020) | 559,117 | ||
NOTE: The following Information was gathered from the Florida Senate website. Only records of senators from 1998–present are kept.
| Portrait | Name | Party | Years of Service | Home City/State | Notes |
|---|---|---|---|---|---|
 |
Richard Mitchell |
Democratic | 1998–2002 |
Consisted of Baker, Dixie, Gilchrist, Hamilton, Lafayette, Nassau, Taylor and parts of Alachua, Bradford, Citrus, Columbia, Jefferson, Leon, Levy, Madison, Marion, Suwannee and Union county | |
 |
Charlie Clary |
Republican | 1998–2006 |
| |
.jpg.webp) |
Republican | 2006-2012 |
Consisted of parts of Bay, Escambia, Okaloosa, Santa Rosa, Walton counties | ||
 |
Republican | 2012–2022 |
| ||
 |
Republican | 2022–Present |
Consists of Nassau county and part of Duval county |
Elections
NOTE: The following results were gathered from the Florida Department of State. Uncontested election results are not provided.
1978
| Party | Candidate | Votes | % | |
|---|---|---|---|---|
| Democratic | Pat Thomas | 68,599 | 85.7% | |
| Democratic | Lenora Walsh | 11,417 | 14.3% | |
| Total votes | 80,016 | 100% | ||
1982
| Party | Candidate | Votes | % | |
|---|---|---|---|---|
| Democratic | C. P. "Pat" Brewer | 15,158 | 43.2% | |
| Democratic | Karen Thurman | 19,935 | 56.8% | |
| Total votes | 35,093 | 100% | ||
| Party | Candidate | Votes | % | |
|---|---|---|---|---|
| Democratic | Karen L. Thurman | 51,983 | 54.4% | |
| Republican | Thad Lowerey | 43,590 | 45.6% | |
| Total votes | 95,573 | 100% | ||
1986
| Party | Candidate | Votes | % | |
|---|---|---|---|---|
| Democratic | Karen L. Thurman | 77,029 | 61.2% | |
| Republican | Lewis Dinkins | 48,820 | 38.8% | |
| Total votes | 125,849 | 100% | ||
1990
| Party | Candidate | Votes | % | |
|---|---|---|---|---|
| Republican | Merl Conine | 7,094 | 25.7% | |
| Republican | Tom Hogan | 20,530 | 74.3% | |
| Total votes | 27,624 | 100% | ||
| Party | Candidate | Votes | % | |
|---|---|---|---|---|
| Republican | Tom Hogan | 59,695 | 41.4% | |
| Democratic | Karen L. Thurman | 84,661 | 58.6% | |
| Total votes | 114,356 | 100% | ||
1992
| Party | Candidate | Votes | % | |
|---|---|---|---|---|
| Democratic | Bob Boyd | 14,007 | 19.1% | |
| Democratic | Will Irby | 13,676 | 18.6% | |
| Democratic | Lamar "Poss" Lee | 12,569 | 17.1% | |
| Democratic | Don Tucker | 15,441 | 21.1% | |
| Democratic | Charles Williams | 17,639 | 24.1% | |
| Total votes | 73,332 | 100% | ||
| Party | Candidate | Votes | % | |
|---|---|---|---|---|
| Democratic | Don Tucker | 26,353 | 45.7% | |
| Democratic | Charles Williams | 31,340 | 54.3% | |
| Total votes | 57,693 | 100% | ||
1994
| Party | Candidate | Votes | % | |
|---|---|---|---|---|
| Democratic | Bob Glover | 11,131 | 22.2% | |
| Democratic | Glenn Jones | 8,160 | 16.2% | |
| Democratic | Lamar "Poss" Lee | 5,291 | 10.5% | |
| Democratic | Charles Williams | 25,670 | 51.1% | |
| Total votes | 50,252 | 100% | ||
| Party | Candidate | Votes | % | |
|---|---|---|---|---|
| Democratic | Charles Williams | 67,800 | 60.7% | |
| Republican | George Onett | 43,988 | 39.3% | |
| Total votes | 111,788 | 100% | ||
1998
| Party | Candidate | Votes | % | |
|---|---|---|---|---|
| Democratic | Richard Mitchell | 23,146 | 52.7% | |
| Democratic | Charles D. Williams | 20,733 | 47.3% | |
| Total votes | 43,879 | 100% | ||
2002
| Party | Candidate | Votes | % | |
|---|---|---|---|---|
| Republican | Charlie Clary | 25,135 | 54.5% | |
| Republican | Jerry Melvin | 20,946 | 45.5% | |
| Total votes | 46,081 | 100% | ||
2012
| Party | Candidate | Votes | % | |
|---|---|---|---|---|
| Republican | Aaron Bean | 31,269 | 64.2% | |
| Republican | Mike Weinstein | 17,451 | 35.8% | |
| Total votes | 48,720 | 100% | ||
| Party | Candidate | Votes | % | |
|---|---|---|---|---|
| Republican | Aaron Bean | 144,352 | 62.2% | |
| Democratic | Nancy Soderberg | 87,766 | 37.8% | |
| Write-In | Kyle Alexander Bedran | 0 | 0.0% | |
| Write-In | Patrick Dewayne Mency | 0 | 0.0% | |
| Total votes | 232,118 | 100% | ||
2018
| Party | Candidate | Votes | % | |
|---|---|---|---|---|
| Republican | Aaron Bean | 50,275 | 87.4% | |
| Republican | Carlos E. Slay | 7,274 | 12.6% | |
| Total votes | 57,549 | 100% | ||
| Party | Candidate | Votes | % | |
|---|---|---|---|---|
| Republican | Aaron Bean | 149,347 | 63.4% | |
| Democratic | Billee Bussard | 80,598 | 34.2% | |
| Libertarian | Joanna Liberty Tavares | 5,514 | 2.3% | |
| Total votes | 235,459 | 100% | ||
2022
| Party | Candidate | Votes | % | |
|---|---|---|---|---|
| Republican | Clay Yarborough | 149,177 | 67.6% | |
| Democratic | Sharmin Smith | 71,472 | 32.4% | |
| Total votes | 220,649 | 100% | ||
References
- "Florida Department of State - Election Results".
- "Florida Department of State - Election Results".
- "Florida Department of State - Election Results".
- "Florida Department of State - Election Results".
- "Florida Department of State - Election Results".
- "Florida Department of State - Election Results".
- "Florida Department of State - Election Results".
- "Florida Department of State - Election Results".
- "Florida Department of State - Election Results".
- "Florida Department of State - Election Results".
- "Florida Department of State - Election Results".
- "Florida Department of State - Election Results".
- "Florida Department of State - Election Results".
- "Florida Department of State - Election Results".
- "Florida Department of State - Election Results".
- "Florida Department of State - Election Results".
- "Florida Department of State - Election Results".
This article is issued from Wikipedia. The text is licensed under Creative Commons - Attribution - Sharealike. Additional terms may apply for the media files.