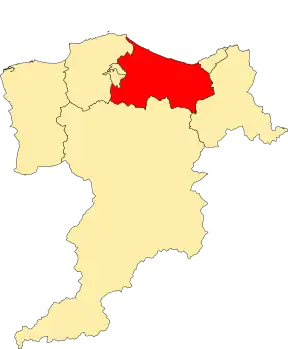
Fochabers Lhanbryde (ward)
Fochabers Lhanbryde is one of the eight wards used to elect members of the Moray Council. It elects three Councillors. As of 2022, it has been represented by Marc Macrae (Conservative), Shona Morrison (SNP) and Ben Williams (Labour).
Location of the ward[1]
Councillors
| Election | Councillors | |||||||
|---|---|---|---|---|---|---|---|---|
| 2007 | Douglas Ross (Conservative) |
George McIntyre (Ind.) |
Anita McDonald (SNP) | |||||
| 2012 | Sean Morton (Labour) |
Margo Howe (SNP) | ||||||
| 2017 | Marc Macrae (Conservative) |
Shona Morrison (SNP) |
David Bremner (SNP) | |||||
| 2022 | Marc Macrae (Conservative) |
Shona Morrison (SNP) |
Ben Williams (Labour) | |||||
Election results
2022 results
| Party | Candidate | FPv% | Count | |||||
|---|---|---|---|---|---|---|---|---|
| 1 | 2 | 3 | 4 | 5 | ||||
| Conservative | Marc Macrae (incumbent) | 39.7% | 1,590 | |||||
| SNP | Shona Morrison (incumbent) | 23.5% | 940 | 959.2 | 1005.3 | |||
| Labour | Ben Williams | 10.1% | 404 | 534.6 | 830.5 | 830.8 | 1,178.2 | |
| SNP | David Bremner (incumbent) | 19.4% | 778 | 791.7 | 811.8 | 816.3 | ||
| Valid: Quota: | ||||||||
2017 Election
2017 Moray Council election[2]
| Party | Candidate | FPv% | Count | |||||||
|---|---|---|---|---|---|---|---|---|---|---|
| 1 | 2 | 3 | 4 | 5 | 6 | 7 | ||||
| Conservative | Marc Macrae | 42.7 | 1,747 | |||||||
| SNP | Shona Morrison | 16.7 | 682 | 702.3 | 708.3 | 738.1 | 759.2 | 793.5 | 872.3 | |
| SNP | David Bremner | 17.4 | 711 | 722.2 | 728.6 | 752.4 | 760.3 | 791.9 | 862.3 | |
| Independent | Ian Taylor | 6.7 | 274 | 361.4 | 374.2 | 440.6 | 578.04 | 701.4 | ||
| Liberal Democrats | Donald Cameron | 5.2 | 211 | 317.5 | 393.6 | 444.9 | 511.4 | |||
| Independent | Kenneth Gillespie | 4.06 | 166 | 282.04 | 294.3 | 344.2 | ||||
| Independent | Sean Morton (incumbent) | 5.3 | 215 | 283.8 | 289.3 | |||||
| Liberal Democrats | Peter Horton | 2.03 | 83 | 141.8 | ||||||
| Electorate: 8,089 Valid: 4,089 Spoilt: 71 Quota: 1,023 Turnout: 4,160 (51.4%) | ||||||||||
2012 Election
| Party | Candidate | FPv% | Count | ||||
|---|---|---|---|---|---|---|---|
| 1 | 2 | 3 | 4 | ||||
| Conservative | Douglas Ross (incumbent) | 39.5% | 1,318 | ||||
| SNP | Margo Howe | 21.82% | 728 | 768.7 | 810.2 | 1,335 | |
| SNP | Anita McDonald (incumbent) | 18.34% | 612 | 676.1 | 708.2 | ||
| Labour | Sean Morton | 15.34% | 512 | 583.5 | 714.7 | 793.9 | |
| Liberal Democrats | Peter Horton | 5.0% | 167 | 304.1 | |||
| Electorate: 7,717 Valid: 3,337 Spoilt: 28 Quota: 835 Turnout: 3,365 (43.24%) | |||||||
2007 Election
| Party | Candidate | 1st Pref | % | Seat | Count | |
|---|---|---|---|---|---|---|
| SNP | Anita McDonald | 1,159 | 28.86 | 1 | 1 | |
| Conservative | Douglas Ross | 727 | 18.10 | 3 | 7 | |
| Independent | George McIntyre | 608 | 15.14 | 2 | 7 | |
| Labour | Lans Bangura | 440 | 10.96 | |||
| Independent | Eddie Coutts | 374 | 9.31 | |||
| Independent | Paul McBain | 333 | 8.29 | |||
| Liberal Democrats | Peter Horton | 287 | 7.15 | |||
| Independent | Gordon Davidson | 56 | 1.39 | |||
| Independent | Alan Bodman | 32 | 0.79 | |||
References
- "5th Reviews - ward maps". Scottish Boundary Commission.
- "Moray Council Election Results 2017". Moray.gov. Retrieved 11 May 2017.
This article is issued from Wikipedia. The text is licensed under Creative Commons - Attribution - Sharealike. Additional terms may apply for the media files.
