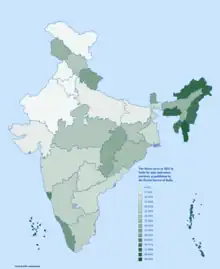
Forest cover by state in India
List of how many forests and percentage of forest cover in India by state.
Tree density
Tree density is the quantification of how closely the trees are growing in a hectare area. It is not the exact number of trees in the forest but, serves as an estimate to the foresters.[1].The tree density of an area should be mentioned by the working Plan officer (WPO) or Divisional Forest Officer (Working Plan) after his field inspection of the lowest possible forest unit or compartment in the CH-3 form of compartment history. The compartment history forms are to be maintained at the Forest range and Forest division offices. The working Plan code-2014 mentions in para 105 that the density should also be mentioned on the stock map prepared by the WPO/DFO in decimal figures. The crown density is similar to the tree density. A forest area with a density of more than 0.4 is considered a good forest area and a forest area with less than 0.4 tree density is considered degraded forest.
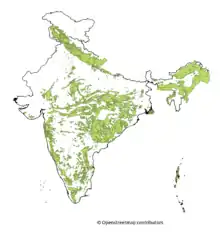
Forest cover
Forest cover is the total geographical area declared as forest by the government. As of 2021, the total forest cover in India is 80.9 million hectares, which is 24.62 per cent of the total geographical area.[2] There is a 1,540 sq.km increase in forest cover over 2019. Madhya Pradesh has the highest forest cover by area followed by Arunachal Pradesh. Mizoram has the highest forest cover in terms of percentage of total geographical area.
Ministry of the Environment, Forest and Climate Change used the mid-resolution satellite data on LISS-III data from Indian remote sensing satellite. Minister of environment forest and climate change Bhupendra Yadav released the Indian forest survey report 2021-22 on 13 January 2022.
As per the report, 17 Indian states have a forest cover of over 33%.
Forest cover over the years
| Year | Total forest area (in sq km) | % of forested area | %change |
|---|---|---|---|
| 2021[2] | 713,789 | 21.71% | |
| 2019[3] | 712,249 | 21.67% | |
| 2017[4] | 708,273 | 21.54% | |
| 2015[5] | 701,673 | 21.34% | |
| 2013[6] | 697,898 | 21.23% | |
| 2011[7] | 692,027 | 21.05% |
2021
The forest cover in 2021 in India by state and union territory as published by the Forest Survey of India (FSI) is shown in the table below.[2]
Very Dense= All lands with tree canopy density of 70 percent ( 0.7 tree density) and above.
Moderately Dense= All lands with tree canopy density of 40 percent and more but less than 70 percent ( 0.4 to 0.7 tree density).
Open Forest= All lands with tree canopy density of 10 percent and more but less than 40 percent (0.1 to 0.4 tree density). (Area in square kilometers)
| State / UT | Zone | Geographical Area | Very dense | Moderately dense | Open forest | Total forest area | % of the forested area | % change since 2019 |
|---|---|---|---|---|---|---|---|---|
| Andhra Pradesh | Southern | 162,968 | 1,994 | 13,929 | 13,861 | 29,784 | 18.28% | 2.22% |
| Arunachal Pradesh | North Eastern | 83,743 | 21,058 | 30,176 | 15,197 | 66,431 | 79.33% | -0.39% |
| Assam | North Eastern | 78,438 | 3,017 | 9,991 | 15,304 | 28,312 | 36.09% | -0.05% |
| Bihar | Eastern | 94,163 | 333 | 3,286 | 3,762 | 7,381 | 7.84% | 1.03% |
| Chhattisgarh | Central | 135,192 | 7,068 | 32,279 | 16,370 | 55,717 | 41.21% | 0.19% |
| Delhi | Northern | 1,483 | 6.72 | 56.6 | 131.68 | 195 | 13.15% | -0.23% |
| Goa | Western | 3,702 | 538 | 576 | 1,130 | 2,244 | 60.62% | 0.31% |
| Gujarat | Western | 196,244 | 378 | 5,032 | 9,516 | 14,926 | 7.61% | 0.46% |
| Haryana | Northern | 44,212 | 28 | 445 | 1,130 | 1,603 | 3.63% | 0.06% |
| Himachal Pradesh | Northern | 55,673 | 3,163 | 7,100 | 5,180 | 15,443 | 27.73% | 0.06% |
| Jharkhand | Eastern | 79,716 | 2,601 | 9,689 | 11,431 | 23,721 | 29.76% | 0.47% |
| Karnataka | Southern | 191,791 | 4,533 | 20,985 | 13,212 | 38,730 | 20.19% | 0.4% |
| Kerala | Southern | 38,852 | 1,944 | 9,472 | 9,837 | 21,253 | 54.7% | 0.52% |
| Madhya Pradesh | Central | 308,252 | 6,665 | 34,209 | 36,619 | 77,493 | 25.14% | 0.01% |
| Maharashtra | Western | 307,713 | 8,734 | 20,589 | 21,475 | 50,798 | 16.51% | 0.04% |
| Manipur | North Eastern | 22,327 | 905 | 6,228 | 9,465 | 16,598 | 74.34% | -1.48% |
| Meghalaya | North Eastern | 22,429 | 560 | 9,160 | 7,326 | 17,046 | 76% | -0.43% |
| Mizoram | North Eastern | 21,081 | 157 | 5,715 | 11,948 | 17,820 | 84.53% | -1.03% |
| Nagaland | North Eastern | 16,579 | 1,272 | 4,449 | 6,530 | 12,251 | 73.9% | -1.88% |
| Odisha | Eastern | 155,707 | 7,213 | 20,995 | 23,948 | 52,156 | 33.5% | 1.04% |
| Punjab | Northern | 50,362 | 11 | 793 | 1,043 | 1,847 | 3.67% | -0.11% |
| Rajasthan | Northern | 342,239 | 78 | 4,369 | 12,208 | 16,655 | 4.87% | 0.15% |
| Sikkim | North Eastern | 7,096 | 1,102 | 1,551 | 688 | 3,341 | 47.08% | -0.03% |
| Tamil Nadu | Southern | 130,060 | 3,593 | 11,034 | 11,792 | 26,419 | 20.31% | 0.21% |
| Telangana | Southern | 112,077 | 1,624 | 9,119 | 10,471 | 21,214 | 18.93% | 3.07% |
| Tripura | North Eastern | 10,486 | 647 | 5,212 | 1,863 | 7,722 | 73.64% | -0.05% |
| Uttar Pradesh | Central | 240,928 | 2,627 | 4,029 | 8,162 | 14,818 | 6.15% | 0.08% |
| Uttarakhand | Central | 53,483 | 5,055 | 12,768 | 6,482 | 24,305 | 45.44% | 0.01% |
| West Bengal | Eastern | 88,752 | 3,037 | 4,208 | 9,587 | 16,832 | 18.96% | -0.41% |
| A & N Islands | Southern | 8,249 | 5,678 | 683 | 383 | 6,744 | 81.75% | 0.01% |
| Chandigarh | Northern | 114 | 1.36 | 13.51 | 8.01 | 22.88 | 20.07% | 3.86% |
| Dadra and Nagar Haveli and Daman and Diu | Western | 602 | 1.4 | 85.56 | 140.79 | 227.75 | 37.83% | 0.04% |
| Jammu and Kashmir | Northern | 54,624 | 4,155 | 8,117 | 9,115 | 21,387 | 39.15% | 0.14% |
| Ladakh | Northern | 168,055 | 2 | 512 | 1,758 | 2,272 | 1.35% | 0.8% |
| Lakshadweep | Southern | 30 | 0 | 16.09 | 11.01 | 27.1 | 90.33% | 0% |
| Puducherry | Southern | 490 | 0 | 17.53 | 35.77 | 53.3 | 10.88% | 1.7% |
| Total | 3,287,469 | 99,779 | 306,890 | 307,120 | 713,789 | 21.71% | 0.22% |
2017
The forest cover in 2017 in India by state and union territory as published by the Forest Survey of India (FSI) is shown in the table below.[8][9]
Very Dense= All lands with tree canopy density of 70 percent ( 0.7 tree density) and above.
Moderately Dense= All lands with tree canopy density of 40 percent and more but less than 70 percent ( 0.4 to 0.7 tree density).
Open Forest= All lands with tree canopy density of 10 percent and more but less than 40 percent (0.1 to 0.4 tree density).
Scrub= All forest lands with poor tree growth mainly of small or stunted trees canopy density less than 10 percent (Less than 0.1 tree density).
(Area in square kilometers)
| State / UT | Geographical Area | Very dense | Moderately dense | Open forest | Total forest area | % of forested area | % change since 2015 |
|---|---|---|---|---|---|---|---|
| Andhra Pradesh | 162,968 | 1,957 | 14,051 | 12,139 | 28,147 | 17.27% | +1.31% |
| Arunachal Pradesh | 83,743 | 20,721 | 30,955 | 15,288 | 66,964 | 79.96% | -0.23% |
| Assam | 78,438 | 2,797 | 10,192 | 15,116 | 28,105 | 35.83% | +0.72% |
| Bihar | 94,163 | 332 | 3,260 | 3,707 | 7,299 | 7.75% | +0.05% |
| Chhattisgarh | 135,192 | 7,064 | 32,215 | 16,268 | 55,547 | 41.09% | -0.01% |
| Delhi | 1,483 | 7 | 56 | 129 | 192 | 20.6% | +0.25% |
| Goa | 3,702 | 538 | 576 | 1,115 | 2,229 | 60.21% | +0.51% |
| Gujarat | 196,244 | 378 | 5,200 | 9,179 | 14,757 | 7.52% | +0.02% |
| Haryana | 44,212 | 28 | 452 | 1,108 | 1,588 | 3.59% | +0.02% |
| Himachal Pradesh | 55,673 | 3,110 | 6,705 | 5,285 | 15,100 | 27.12% | +0.71% |
| Jammu & Kashmir | 222,236 | 4,075 | 8,579 | 10,587 | 23,241 | 10.46% | +0.11% |
| Jharkhand | 79,716 | 2,598 | 9,686 | 11,269 | 23,553 | 29.55% | +0.04% |
| Karnataka | 191,791 | 4,502 | 20,444 | 12,604 | 37,550 | 19.58% | +0.57% |
| Kerala | 38,852 | 1,663 | 9,407 | 8,251 | 20,321 | 52.30% | +2.68% |
| Madhya Pradesh | 308,252 | 6,563 | 34,571 | 36,280 | 77,414 | 25.11% | -0.00% |
| Maharashtra | 307,713 | 8,736 | 20,652 | 21,294 | 50,682 | 16.47% | -0.01% |
| Manipur | 22,327 | 908 | 6,510 | 9,928 | 17,346 | 77.69% | +1.18% |
| Meghalaya | 22,429 | 453 | 9,386 | 7,307 | 17,146 | 76.76% | -0.52% |
| Mizoram | 21,081 | 131 | 5,861 | 12,194 | 18,186 | 86.27% | -2.52% |
| Nagaland | 16,579 | 1,279 | 4,587 | 6,623 | 12,489 | 75.33% | -2.71% |
| Odisha | 155,707 | 6,967 | 21,370 | 23,008 | 51,345 | 32.98% | +0.57% |
| Punjab | 50,362 | 8 | 806 | 1,023 | 1,837 | 3.65% | +0.13% |
| Rajasthan | 342,239 | 78 | 4,340 | 12,154 | 16,572 | 4.84% | +0.14% |
| Sikkim | 7,096 | 1,081 | 1,575 | 688 | 3,344 | 47.13% | -0.13% |
| Tamil Nadu | 130,060 | 3,672 | 10,979 | 11,630 | 26,281 | 20.21% | +0.06% |
| Telangana | 112,077 | 1,596 | 8,738 | 10,085 | 26969 | 18.22% | +0.50% |
| Tripura | 10,486 | 656 | 5,246 | 1,824 | 7,726 | 73.68% | -1.56% |
| Uttar Pradesh | 240,928 | 2,617 | 4,069 | 7,993 | 14,679 | 6.09% | +0.12% |
| Uttarakhand | 53,483 | 4,969 | 12,884 | 6,442 | 24,295 | 45.43% | +0.04% |
| West Bengal | 88,752 | 2,994 | 4,147 | 9,706 | 16,847 | 18.98% | +0.02% |
| Andaman & Nicobar Islands | 8,249 | 5,678 | 684 | 380 | 6,742 | 81.73% | -0.11% |
| Chandigarh | 114 | 1 | 14 | 6 | 22 | 18.91% | -0.09% |
| Dadra & Nagar Haveli | 491 | 0 | 80 | 127 | 207 | 42.16% | +0.20% |
| Daman & Diu | 111 | 1 | 6 | 13 | 20 | 18.46% | +0.79% |
| Lakshadweep | 30 | 0 | 17 | 10 | 27 | 90.33% | 0.13% |
| Puducherry | 490 | 0 | 18 | 36 | 54 | 10.95% | -0.67% |
| Total | 3,287,469 | 98,158 | 308,318 | 301,797 | 708,273 | 21.54% | +0.21% |
2015
According to Forest Survey of India (FSI), the forest cover by State/UT in India in 2015 is listed below.[8]
Very Dense= All lands with tree canopy density of 70 percent and above.
Moderately Dense= All lands with tree canopy density of 40 percent and more but less than 70 percent.
Open Forest= All lands with tree canopy density of 10 percent and more but less than 40 percent.
(Area in square kilometers)
| State / UT | Geographical Area | Very dense | Moderately dense | Open forest |
|---|---|---|---|---|
| Andhra Pradesh | 162,968 | 421 | 14,352 | 11,233 |
| Arunachal Pradesh | 83,743 | 20,806 | 31,181 | 15,167 |
| Assam | 78,438 | 1,425 | 11,256 | 14,857 |
| Bihar | 94,163 | 248 | 3,362 | 3,644 |
| Chhattisgarh | 135,192 | 7,001 | 32,305 | 16,253 |
| Delhi | 1,483 | 6.94 | 57.15 | 154.68 |
| Goa | 3,702 | 536 | 580 | 1,094 |
| Gujarat | 196,244 | 378 | 5,198 | 9,134 |
| Haryana | 44,212 | 28 | 444 | 1,108 |
| Himachal Pradesh | 55,673 | 3,225 | 6,387 | 5,095 |
| Jammu & Kashmir | 222,236 | 4,061 | 8,815 | 10,112 |
| Jharkhand | 79,716 | 2,601 | 9,692 | 11,231 |
| Karnataka | 191,791 | 1,783 | 20,177 | 14,489 |
| Kerala | 38,852 | 1,529 | 9,328 | 8,421 |
| Madhya Pradesh | 308,252 | 6,586 | 34,837 | 36,003 |
| Maharashtra | 307,713 | 8,685 | 20,792 | 21,222 |
| Manipur | 22,327 | 729 | 5,964 | 10,390 |
| Meghalaya | 22,429 | 417 | 9,555 | 7,290 |
| Mizoram | 21,081 | 135 | 5,800 | 12,782 |
| Nagaland | 16,579 | 1,284 | 4,690 | 6,965 |
| Odisha | 155,707 | 6,985 | 21,470 | 22,005 |
| Punjab | 50,362 | 0 | 733 | 1,038 |
| Rajasthan | 342,239 | 77 | 4,414 | 11,615 |
| Sikkim | 7,096 | 499 | 2,157 | 697 |
| Tamil Nadu | 130,060 | 3,005 | 10,472 | 12,731 |
| Telangana | 112,077 | 465 | 11,340 | 8,049 |
| Tripura | 10,486 | 110 | 4,699 | 3,111 |
| Uttar Pradesh | 240,928 | 2,171 | 4,043 | 8,187 |
| Uttarakhand | 53,483 | 4,804 | 13,662 | 5,806 |
| West Bengal | 88,752 | 2,943 | 4,176 | 9,707 |
| Andaman & Nicobar Islands | 8,249 | 5,686 | 685 | 380 |
| Chandigarh | 114 | 1.36 | 13.92 | 6.38 |
| Dadra & Nagar Haveli | 491 | 0 | 80 | 126 |
| Daman & Diu | 111 | 1.4 | 5.82 | 12.39 |
| Lakshadweep | 30 | 0 | 17.22 | 9.84 |
| Puducherry | 490 | 0 | 28.78 | 28.17 |
| Total | 3,287,469 | 88,633 | 312,739 | 300,123 |
References
- "How to Calculate tree density - Hunker.com".
- "India State of Forest Report 2021".
- "FSI 2019 Summary" (PDF).
- "FSI 2017 Forest Cover" (PDF).
- "FSI 2015 Summary" (PDF).
- "FSI 2013 Summary" (PDF).
- "FSI 2011 Summary" (PDF).
- "India State of Forest Report, Forest Cover 2017" (PDF). Forest Survey of India. Retrieved 13 February 2018.
- Jasjeev, G. "Forest department: Delhi's green cover doubled since 2001 | Delhi News - Times of India". The Times of India. Retrieved 19 January 2022.