List of Indian states and union territories by poverty rate
This is a list of states and union territories of India ranked according to poverty as of 2022 (2021–22) as hosted by NITI Aayog's Sustainable Development Goals dashboard; and Reserve Bank of India's 'Handbook of Statistics on Indian Economy'.[1][2] The rank is calculated according to the percentage of people below poverty -line which is computed as per Tendulkar method on Mixed Reference Period (MRP).[3][4]
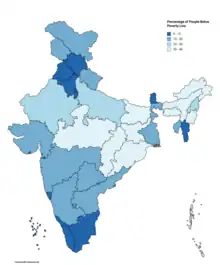
Poverty rate map of India by prevalence in 2022, among its states and union territories
List
| State/UT | % of population
State/UT specific poverty line |
% of population
living below the | |
|---|---|---|---|
| Rural | Urban | ||
| States | |||
| Kerala | 0.76 | 0.32 | 0.55 |
| Goa | 1.90 | 0.12 | 0.84 |
| Sikkim | 3.75 | 0.51 | 2.60 |
| Tamil Nadu | 2.90 | 1.41 | 2.20 |
| Punjab | 4.74 | 4.76 | 4.75 |
| Himachal Pradesh | 5.23 | 2.96 | 4.93 |
| Mizoram | 10.77 | 0.58 | 5.30 |
| Andhra Pradesh | 7.71 | 2.20 | 6.06 |
| Haryana | 8.41 | 4.26 | 7.07 |
| Karnataka | 10.33 | 3.22 | 7.58 |
| Telangana | 7.51 | 2.73 | 5.88 |
| Maharashtra | 11.49 | 3.07 | 7.81 |
| Tripura | 16.47 | 4.69 | 13.11 |
| Uttarakhand | 10.84 | 7.00 | 9.67 |
| Manipur | 10.95 | 3.43 | 8.10 |
| Gujarat | 17.15 | 3.81 | 11.66 |
| West Bengal | 15.15 | 5.04 | 11.89 |
| All India | 19.28 | 5.27 | 14.96 |
| Arunachal Pradesh | 15.14 | 5.90 | 13.76 |
| Nagaland | 19.88 | 6.14 | 15.43 |
| Odisha | 17.72 | 5.42 | 15.68 |
| Rajasthan | 18.62 | 4.54 | 15.31 |
| Chhattisgarh | 19.71 | 4.59 | 16.37 |
| Assam | 21.41 | 6.88 | 19.35 |
| Meghalaya | 32.43 | 8.14 | 27.79 |
| Madhya Pradesh | 25.32 | 7.10 | 20.63 |
| Uttar Pradesh | 26.35 | 11.57 | 22.93 |
| Jharkhand | 34.93 | 8.67 | 28.81 |
| Bihar | 36.95 | 16.67 | 33.76 |
| Union Territories | |||
| Andaman and Nicobar Islands | 2.71 | 1.60 | 2.30 |
| Lakshadweep | 0.36 | 1.32 | 1.11 |
| Puducherry | 0.71 | 0.91 | 0.85 |
| Delhi | 2.57 | 3.45 | 3.43 |
| Jammu and Kashmir | 6.10 | 1.09 | 4.80 |
| Chandigarh | 3.88 | 3.51 | 3.52 |
| Dadra and Nagar Haveli | 12.27 | 5.67 | 9.21 |
| Daman and Diu | – | – | 9.21 |
Supporting content
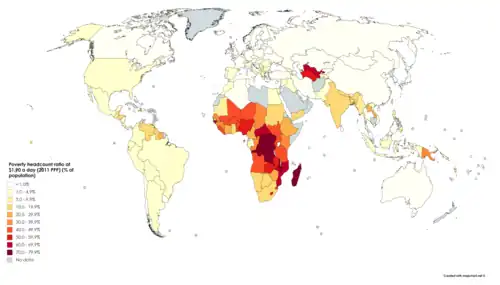
Poverty headcount ratio at $1.90 a day (2011 PPP) (% of population). Based on World Bank data ranging from 1998 to 2018.[6]

World population living in extreme poverty, 1990–2015
| Method | Line | Figure | % of poor population | Poor population | |
|---|---|---|---|---|---|
| World Bank (2021) | poverty line | 1.90 (PPP $ day) | 6 | 84m | [7] |
| lower middle-income line | 3.20 (PPP $ day) | 26.2 | 365m | [7] | |
| upper middle-income line | 5.50 (PPP $ day) | 60.1 | 838m | [7] | |
| Asian Development Bank (2014) | poverty line | $ 1.51 per person per day | [8] | ||
| Tendulkar Expert Group (2009) | urban poverty line | Rs 32 per person per day consumption | [9] | ||
| rural poverty line | Rs 26 per person per day consumption | [9] | |||
| Rangrajan Committee (2014) | urban poverty line | Rs 47 daily per capita expenditure | [9] | ||
| rural poverty line | Rs 32 daily per capita expenditure | [9] |
References
- SDG India Index 2021-22 (3 June 2022). "SDGs India Index". Archived (PDF) from the original on 13 June 2021.
- "Handbook of Statistics on Indian Economy. Table 154 : Number and Percentage of Population Below Poverty Line. (2011-12)". Reserve Bank of India. Retrieved 2021-09-13.
- Balchand, K.; Sunderarajan, P. (2011-05-21). "You will be on BPL list if your annual income is Rs.27,000". The Hindu. ISSN 0971-751X. Retrieved 2021-09-13.
- Vikram, Kumar (9 July 2016). "Rural India spends most on mobiles: NSSO". India Today. Retrieved 2021-09-13.
- https://www.niti.gov.in/sites/default/files/2021-11/National_MPI_India-11242021.pdf Page 35.
- "Poverty headcount ratio at $1.90 a day (2011 PPP) (% of population) | Data". data.worldbank.org. Archived from the original on 19 January 2021. Retrieved 23 July 2020.
- "Infographic: New lines, but India still home to biggest chunk of global poor". The Times of India. 2 November 2017. Retrieved 2021-09-13.
- Key Indicators for Asia and the Pacific 2014. Special Chapter: Poverty in Asia. A Deeper Look (PDF) (45 ed.). Philippines: Asian Development Bank. 2014. ISBN 978-92-9254-595-6.
- Gaur, Seema; Rao, Srinivasa (September 2020). "Poverty Measurement in India: A Status Update" (PDF). Ministry of Rural Development, Government of India. Retrieved 13 September 2021.
Authors are Principal Economic Adviser and Economic Adviser respectively in the Department of Rural Development.
Further reading
- Understanding Poverty in India (PDF). Asian Development Bank. 2011. ISBN 978-92-9092-318-3.
This article is issued from Wikipedia. The text is licensed under Creative Commons - Attribution - Sharealike. Additional terms may apply for the media files.