Georgia's 5th congressional district
Georgia's 5th congressional district is a congressional district in the U.S. state of Georgia. The district was represented by Democrat John Lewis from January 3, 1987, until his death on July 17, 2020. Kwanza Hall was elected to replace Lewis on December 1, 2020, and served until January 3, 2021, when Nikema Williams took his place. Hall was elected in a special election for the balance of Lewis' 17th term. He chose not to run in the general election for a full two-year term, which was won by Williams.
| Georgia's 5th congressional district | |||
|---|---|---|---|
Interactive map of district boundaries since January 3, 2023 | |||
| Representative |
| ||
| Distribution |
| ||
| Population (2022) | 759,771[2] | ||
| Median household income | $80,430[3] | ||
| Ethnicity |
| ||
| Cook PVI | D+32[4] | ||
The district's boundaries were redrawn following the 2010 census, which granted an additional congressional seat to Georgia.[5] The first election using the new district boundaries (listed below) were the 2012 congressional elections.
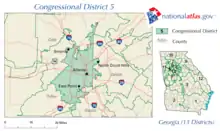
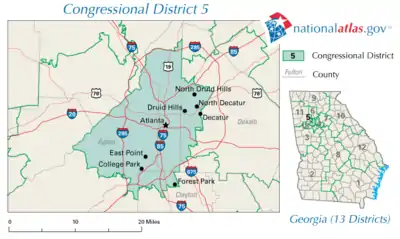
Based in central Fulton and parts of DeKalb and Clayton counties, the majority black district includes almost three-fourths of Atlanta, the state capital and largest city. It also includes some of the surrounding suburbs, including East Point, Druid Hills, and Forest Park.[6] With a Cook Partisan Voting Index rating of D+32, it is the most Democratic district in Georgia.[4]
Counties
- Fulton (Partial, see also 6th district, 11th district and 13th district)
- DeKalb (Partial, see also 4th district)
- Clayton (Partial, see also 13th district)
Recent results in statewide elections
| Year | Office | Results |
|---|---|---|
| 2000 | President | Al Gore 73% - George W. Bush 27% |
| 2004 | President | John Kerry 74% - George W. Bush 26% |
| 2008 | President | Barack Obama 84.4% - John McCain 15% |
| 2012 | President | Barack Obama 83.1% - Mitt Romney 15.8% |
| 2016 | President | Hillary Clinton 85% - Donald Trump 12% |
| 2018 | Governor | Stacey Abrams 87.9% - Brian Kemp 11.3% |
| 2020 | President | Joe Biden 86% - Donald Trump 13% |
List of members representing the district
Election results
2002
| Party | Candidate | Votes | % | |
|---|---|---|---|---|
| Democratic | John Lewis (Incumbent) | 116,230 | 100.00 | |
| Total votes | 116,230 | 100.00 | ||
| Turnout | ||||
| Democratic hold | ||||
2004
| Party | Candidate | Votes | % | |
|---|---|---|---|---|
| Democratic | John Lewis (Incumbent) | 201,773 | 100.00 | |
| Total votes | 201,773 | 100.00 | ||
| Turnout | ||||
| Democratic hold | ||||
2006
| Party | Candidate | Votes | % | |
|---|---|---|---|---|
| Democratic | John Lewis (Incumbent) | 122,380 | 99.95 | |
| No party | Others | 64 | 0.05 | |
| Total votes | 122,444 | 100.00 | ||
| Turnout | ||||
| Democratic hold | ||||
2008
| Party | Candidate | Votes | % | |
|---|---|---|---|---|
| Democratic | John Lewis (Incumbent) | 231,368 | 99.95 | |
| No party | Others | 106 | 0.05 | |
| Total votes | 231,437 | 100.00 | ||
| Turnout | ||||
| Democratic hold | ||||
2010
| Party | Candidate | Votes | % | |
|---|---|---|---|---|
| Democratic | John Lewis (Incumbent) | 130,782 | 73.72 | |
| Republican | Fenn Little | 46,622 | 26.28 | |
| Total votes | 177,404 | 100.00 | ||
| Turnout | ||||
| Democratic hold | ||||
2012
| Party | Candidate | Votes | % | |
|---|---|---|---|---|
| Democratic | John Lewis (Incumbent) | 234,330 | 84.39 | |
| Republican | Howard Stopeck | 43,335 | 15.61 | |
| Total votes | 277,665 | 100.00 | ||
| Turnout | ||||
| Democratic hold | ||||
2014
| Party | Candidate | Votes | % | |
|---|---|---|---|---|
| Democratic | John Lewis (Incumbent) | 170,326 | 100 | |
| Total votes | 170,326 | 100.00 | ||
| Turnout | ||||
| Democratic hold | ||||
2016
| Party | Candidate | Votes | % | |
|---|---|---|---|---|
| Democratic | John Lewis (Incumbent) | 253,781 | 84.44 | |
| Republican | Douglas Bell | 46,768 | 15.56 | |
| Total votes | 300,549 | 100.00 | ||
| Turnout | ||||
| Democratic hold | ||||
2018
| Party | Candidate | Votes | % | |
|---|---|---|---|---|
| Democratic | John Lewis (Incumbent) | 273,084 | 100 | |
| Total votes | 273,084 | 100.00 | ||
| Turnout | ||||
| Democratic hold | ||||
2020 special election
| Party | Candidate | Votes | % | |
|---|---|---|---|---|
| Democratic | Kwanza Hall | 11,104 | 31.75% | |
| Democratic | Robert Michael Franklin Jr. | 9,987 | 28.55% | |
| Democratic | Mable Thomas | 6,692 | 19.13% | |
| Democratic | Keisha Waites | 4,255 | 12.17% | |
| Democratic | Barrington Martin II | 1,944 | 5.56% | |
| Libertarian | Chase Oliver | 712 | 2.04% | |
| Independent | Steven Muhammad | 282 | 0.8% | |
| Total votes | 34,967 | 100.00% | ||
| Party | Candidate | Votes | % | |
|---|---|---|---|---|
| Democratic | Kwanza Hall | 13,450 | 54.27% | |
| Democratic | Robert Michael Franklin Jr. | 11,332 | 45.73% | |
| Total votes | 24,782 | 100.00% | ||
| Democratic hold | ||||
2020
| Party | Candidate | Votes | % | |
|---|---|---|---|---|
| Democratic | Nikema Williams | 301,857 | 85.02 | |
| Republican | Angela Stanton-King | 52,646 | 14.08 | |
| Total votes | 354,503 | 100.00 | ||
| Democratic hold | ||||
2022
| Party | Candidate | Votes | % | |
|---|---|---|---|---|
| Democratic | Nikema Williams (incumbent) | 243,687 | 82.48 | |
| Republican | Christian Zimm | 51,769 | 17.52 | |
| Total votes | 295,456 | 100.00 | ||
| Democratic hold | ||||
Historical district boundaries


.tif.png.webp)
References
- Geography, US Census Bureau. "Congressional Districts Relationship Files (state-based)". www.census.gov.
- Bureau, Center for New Media & Promotion (CNMP), US Census. "My Congressional District". www.census.gov.
{{cite web}}: CS1 maint: multiple names: authors list (link) - Center for New Media & Promotion (CNMP), US Census Bureau. "My Congressional District". www.census.gov.
- "2022 Cook PVI: District Map and List". Cook Political Report. Retrieved January 10, 2023.
- Justice Department approves Georgia's political maps Archived January 7, 2012, at the Wayback Machine. Atlanta Journal-Constitution. Last accessed December 27, 2011
- 2012 Congressional maps - Metro Atlanta, Georgia Legislature. Last accessed January 1, 2012
- Prince was seated despite the fact that Georgia had not yet been readmitted to the Union. On the opening of the 45th United States Congress in March 1869, he claimed that his election of 1868 entitled him to sit in that Congress, but this claim was rejected by Congress.
- "Results Summary". Georgia Secretary of State. Retrieved September 30, 2020.
- "Results Summary". Georgia Secretary of State. Retrieved December 14, 2020.
- Martis, Kenneth C. (1989). The Historical Atlas of Political Parties in the United States Congress. New York: Macmillan Publishing Company.
- Martis, Kenneth C. (1982). The Historical Atlas of United States Congressional Districts. New York: Macmillan Publishing Company.
- Congressional Biographical Directory of the United States 1774–present
.svg.png.webp)
.jpg.webp)


.png.webp)


.jpg.webp)

