Geography of Ottawa
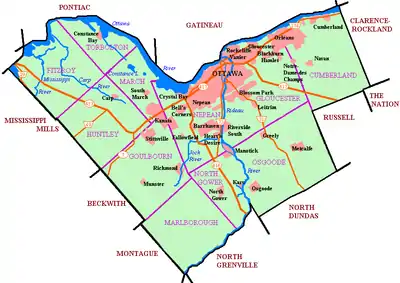
This is the outline of the geography of the city of Ottawa, the capital of Canada. Ottawa's current borders were formed in 2001, when the former city of Ottawa amalgamated with the ten other municipalities within the former Regional Municipality of Ottawa–Carleton. Ottawa is now a single-tiered census division, home to 1,017,449 people.[1]

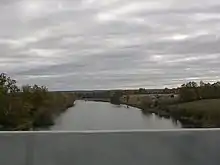
The city centre is located at the confluence of the Ottawa and Rideau Rivers. The Ottawa River forms the entire northern boundary of the city which it shares with the province of Quebec's municipalities of Pontiac and Gatineau. The northern boundary begins in the west at Arnprior and continues east to Rockland. The boundary then turns south in a straight line, separating the former Township of Cumberland (now in Ottawa) and the City of Clarence-Rockland. It then turns west in another straight line separating the former Township of Cumberland with the municipalities of The Nation and Russell. It then turns south separating Russell from the former Township of Osgoode (now in Ottawa). That boundary runs south in a straight line, then turns west separating Osgoode from the municipality of North Dundas. That boundary runs west in a straight line before turning north separating Osgoode from the municipality of North Grenville. This is another straight line, running north until the Rideau River near Kemptville. The boundary follows the river upstream until almost reaching Merrickville. The boundary then runs in a northwest direction in a straight line with a number of jogs. It separates the municipalities of Montague, Beckwith and Mississippi Mills from the former townships of Marlborough, Goulbourn, Huntley and Fitzroy.
Topography
The highest point in Ottawa is 166 m (545 ft) above sea level, and is located 2.6 km (1.6 mi) SSE of Manion Corners (45°14′05″N 76°03′03″W).[2] The lowest point in the city is the Ottawa River, at 44 m (144 ft) above sea level.
Highest points by ward
| Ward | Highest point | Elevation (approx.) |
|---|---|---|
| West Carleton-March Ward | 2.6 km (1.6 mi) SSE of Manion Corners | 166 m (545 ft) |
| Rideau-Goulbourn Ward | 8 km (5.0 mi) N of Munster on Jinkinson Road | 153 m (502 ft) |
| Kanata South Ward | Glen Cairn Reservoir | 131 m (430 ft) |
| College Ward | Khymer Court | 129 m (423 ft) |
| Stittsville Ward | Rockson Crescent | 128 m (420 ft) |
| Kanata North Ward | Huntsville Drive | 126 m (413 ft) |
| Osgoode Ward | 1 km (0.62 mi) SE of Bank Street at Rideau Road | 120 m (390 ft) |
| Cumberland Ward | Cumberland Ridge Drive | 120 m (390 ft) |
| Barrhaven Ward | Cedarview Road | 120 m (390 ft) |
| Gloucester-Southgate Ward | Tom Roberts Avenue | 119 m (390 ft) |
| Knoxdale-Merivale Ward | Cedarview Road at Cedarhill Drive | 115 m (377 ft) |
| River Ward | Carlington Hill | 115 m (377 ft) |
| Bay Ward | Wesley Clover Parks | 114 m (374 ft) |
| Gloucester-South Nepean Ward | Osgoode Link Pathway at High Road | 114 m (374 ft) |
| Innes Ward | 200 m (660 ft) WSW of Forest Ridge Pumping Station | 114 m (374 ft) |
| Beacon Hill-Cyrville Ward | Quarry Park | 113 m (371 ft) |
| Rideau-Rockcliffe Ward | Foxview Place | 106 m (348 ft) |
| Alta Vista Ward | Alta Vista Drive at Randall Avenue | 102 m (335 ft) |
| Capital Ward | Bank Street at Alta Vista Drive | 96 m (315 ft) |
| Orléans Ward | Clearcrest Crescent | 93 m (305 ft) |
| Kitchissippi Ward | Maitland Avenue Bridge | 89 m (292 ft) |
| Somerset Ward | Parliament Hill | 86 m (282 ft) |
| Rideau-Vanier Ward | Richelieu Park | 75 m (246 ft) |
Geology


Many features of geologic interest are found in Ottawa.[3]
| Site | Feature |
|---|---|
| W. Erskine Johnston Public School | Glacially sculpted Precambrian gneiss outcrops |
| Kanata Centrum Shopping Centre | Sandstone and dolomite outcrops |
| Stony Swamp Conservation Area | Cambrian-Ordovician sandstone strata |
| Champlain Bridge | Stromatolite fossils |
| Westboro Beach | Stromatolite, orthocone and trace fossils |
| Transitway at Roosevelt Avenue | Stromatolite fossils |
| Tunney's Pasture | Cross-section of the Gloucester Fault |
| Geological Survey of Canada | Fossiliferous limestone outcrop |
| Hog's Back Falls | Ordovician sedimentary rocks and the Gloucester Fault |
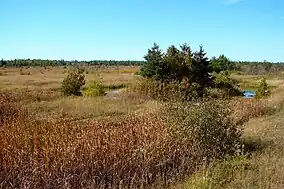
| Mer Bleue Bog | Boreal peatland |
| Victoria Island | Dune bedforms and fossiliferous limestone |
| Lady Grey Drive | Ordovician limestone deposits |
| Pinhey's Point | Glacial erratics |
| Petrie Island | Sedimentary shoreline with imported Ordovician blocks |
| Carp Hills | Outcrops of the Canadian Shield |
| Pinhey Sand Dunes | Dunes from an ancient shoreline of the Champlain Sea |
| Cardinal Creek Karst | Paleozoic karst |
| Burnt Lands Alvar | Limestone alvar |
| Colonel By Valley | Shallow valley that descends into the Ottawa River |
| Nanny Goat Hill | Steep limestone escarpment |
Climate
Classification
| Climatic scheme | Initials | Description |
|---|---|---|
| Köppen system[4][5] | Dfb | Warm-summer humid continental climate |
| Trewartha system[6] | Dcb | Continental climate |
Recent data
| Climate data for Ottawa (Central Experimental Farm), elevation: 79.2 m (260 ft), 1981–2010 normals, extremes 1872–present[lower-alpha 1] | |||||||||||||
|---|---|---|---|---|---|---|---|---|---|---|---|---|---|
| Month | Jan | Feb | Mar | Apr | May | Jun | Jul | Aug | Sep | Oct | Nov | Dec | Year |
| Record high °C (°F) | 15.6 (60.1) |
12.7 (54.9) |
26.7 (80.1) |
31.2 (88.2) |
35.2 (95.4) |
36.7 (98.1) |
37.8 (100.0) |
37.8 (100.0) |
36.7 (98.1) |
29.4 (84.9) |
23.3 (73.9) |
17.2 (63.0) |
37.8 (100.0) |
| Average high °C (°F) | −5.8 (21.6) |
−3.1 (26.4) |
2.4 (36.3) |
11.4 (52.5) |
19.0 (66.2) |
24.1 (75.4) |
26.6 (79.9) |
25.4 (77.7) |
20.5 (68.9) |
12.8 (55.0) |
5.5 (41.9) |
−2.0 (28.4) |
11.4 (52.5) |
| Daily mean °C (°F) | −10.2 (13.6) |
−7.9 (17.8) |
−2.2 (28.0) |
6.5 (43.7) |
13.5 (56.3) |
18.7 (65.7) |
21.2 (70.2) |
19.9 (67.8) |
15.3 (59.5) |
8.4 (47.1) |
2.0 (35.6) |
−5.6 (21.9) |
6.6 (43.9) |
| Average low °C (°F) | −14.4 (6.1) |
−12.5 (9.5) |
−6.8 (19.8) |
1.5 (34.7) |
8.0 (46.4) |
13.3 (55.9) |
15.7 (60.3) |
14.5 (58.1) |
10.1 (50.2) |
4.0 (39.2) |
−1.5 (29.3) |
−9.2 (15.4) |
1.9 (35.4) |
| Record low °C (°F) | −37.8 (−36.0) |
−38.3 (−36.9) |
−36.7 (−34.1) |
−20.6 (−5.1) |
−7.2 (19.0) |
0.0 (32.0) |
3.3 (37.9) |
1.1 (34.0) |
−4.4 (24.1) |
−12.8 (9.0) |
−30.6 (−23.1) |
−38.9 (−38.0) |
−38.9 (−38.0) |
| Average precipitation mm (inches) | 62.9 (2.48) |
49.7 (1.96) |
57.5 (2.26) |
71.1 (2.80) |
86.6 (3.41) |
92.7 (3.65) |
84.4 (3.32) |
83.8 (3.30) |
92.7 (3.65) |
85.9 (3.38) |
82.7 (3.26) |
69.5 (2.74) |
919.5 (36.20) |
| Average rainfall mm (inches) | 23.0 (0.91) |
17.9 (0.70) |
28.8 (1.13) |
63.2 (2.49) |
86.6 (3.41) |
92.7 (3.65) |
84.4 (3.32) |
83.8 (3.30) |
92.7 (3.65) |
83.1 (3.27) |
67.5 (2.66) |
31.9 (1.26) |
755.5 (29.74) |
| Average snowfall cm (inches) | 44.3 (17.4) |
34.7 (13.7) |
29.1 (11.5) |
7.2 (2.8) |
0.0 (0.0) |
0.0 (0.0) |
0.0 (0.0) |
0.0 (0.0) |
0.0 (0.0) |
2.9 (1.1) |
16.0 (6.3) |
41.3 (16.3) |
175.4 (69.1) |
| Average precipitation days (≥ 0.2 mm) | 16.0 | 11.7 | 11.5 | 13.2 | 14.5 | 12.4 | 11.6 | 11.2 | 12.9 | 14.9 | 15.2 | 15.6 | 160.7 |
| Average rainy days (≥ 0.2 mm) | 3.7 | 3.5 | 5.5 | 11.5 | 14.4 | 12.4 | 11.6 | 11.2 | 12.9 | 14.6 | 11.6 | 5.5 | 118.3 |
| Average snowy days (≥ 0.2 cm) | 14.1 | 9.7 | 7.4 | 2.7 | 0.08 | 0.0 | 0.0 | 0.0 | 0.0 | 0.81 | 5.1 | 12.2 | 52.0 |
| Mean monthly sunshine hours | 99.3 | 131.3 | 167.1 | 189.8 | 229.8 | 254.2 | 279.0 | 249.3 | 177.6 | 139.4 | 84.3 | 82.6 | 2,083.7 |
| Percent possible sunshine | 35.0 | 44.9 | 45.3 | 46.9 | 49.9 | 54.3 | 58.9 | 57.1 | 47.1 | 41.0 | 29.4 | 30.3 | 45.0 |
| Average ultraviolet index | 1 | 2 | 3 | 5 | 6 | 8 | 7 | 7 | 5 | 3 | 1 | 1 | 4 |
| Source: Environment Canada[7][8][9][10][11][12][13][14][15] and Weather Atlas[16] | |||||||||||||
| Climate data for Ottawa (Ottawa International Airport), elevation: 114 m (374 ft), 1981–2010 normals, extremes 1938–present | |||||||||||||
|---|---|---|---|---|---|---|---|---|---|---|---|---|---|
| Month | Jan | Feb | Mar | Apr | May | Jun | Jul | Aug | Sep | Oct | Nov | Dec | Year |
| Record high humidex | 13.9 | 15.1 | 30.0 | 35.1 | 41.8 | 44.0 | 47.2 | 47.0 | 42.5 | 33.9 | 26.1 | 18.4 | 47.2 |
| Record high °C (°F) | 12.9 (55.2) |
12.4 (54.3) |
27.4 (81.3) |
31.1 (88.0) |
35.8 (96.4) |
36.1 (97.0) |
36.7 (98.1) |
37.8 (100.0) |
35.1 (95.2) |
27.8 (82.0) |
23.9 (75.0) |
17.9 (64.2) |
37.8 (100.0) |
| Average high °C (°F) | −5.8 (21.6) |
−3.4 (25.9) |
2.5 (36.5) |
11.6 (52.9) |
19.0 (66.2) |
24.1 (75.4) |
26.5 (79.7) |
25.3 (77.5) |
20.4 (68.7) |
12.7 (54.9) |
5.4 (41.7) |
−2.3 (27.9) |
11.3 (52.3) |
| Daily mean °C (°F) | −10.3 (13.5) |
−8.1 (17.4) |
−2.3 (27.9) |
6.3 (43.3) |
13.3 (55.9) |
18.5 (65.3) |
21.0 (69.8) |
19.8 (67.6) |
15.0 (59.0) |
8.0 (46.4) |
1.5 (34.7) |
−6.2 (20.8) |
6.4 (43.5) |
| Average low °C (°F) | −14.8 (5.4) |
−12.7 (9.1) |
−7.0 (19.4) |
1.0 (33.8) |
7.5 (45.5) |
12.9 (55.2) |
15.5 (59.9) |
14.3 (57.7) |
9.6 (49.3) |
3.3 (37.9) |
−2.4 (27.7) |
−10.1 (13.8) |
1.4 (34.5) |
| Record low °C (°F) | −35.6 (−32.1) |
−36.1 (−33.0) |
−30.6 (−23.1) |
−16.7 (1.9) |
−5.6 (21.9) |
−0.1 (31.8) |
5.0 (41.0) |
2.6 (36.7) |
−3.0 (26.6) |
−8.0 (17.6) |
−21.7 (−7.1) |
−34.4 (−29.9) |
−36.1 (−33.0) |
| Record low wind chill | −47.8 | −47.6 | −42.7 | −26.3 | −10.9 | 0.0 | 0.0 | 0.0 | −6.4 | −13.3 | −29.5 | −44.6 | −47.8 |
| Average precipitation mm (inches) | 65.4 (2.57) |
54.3 (2.14) |
64.4 (2.54) |
74.5 (2.93) |
80.3 (3.16) |
92.8 (3.65) |
91.9 (3.62) |
85.5 (3.37) |
90.1 (3.55) |
86.1 (3.39) |
81.9 (3.22) |
76.4 (3.01) |
943.4 (37.14) |
| Average rainfall mm (inches) | 25.0 (0.98) |
18.7 (0.74) |
31.1 (1.22) |
63.0 (2.48) |
80.1 (3.15) |
92.8 (3.65) |
91.9 (3.62) |
85.5 (3.37) |
90.1 (3.55) |
82.2 (3.24) |
64.5 (2.54) |
33.5 (1.32) |
758.2 (29.85) |
| Average snowfall cm (inches) | 53.9 (21.2) |
43.3 (17.0) |
38.3 (15.1) |
11.3 (4.4) |
0.2 (0.1) |
0.0 (0.0) |
0.0 (0.0) |
0.0 (0.0) |
0.0 (0.0) |
3.7 (1.5) |
20.2 (8.0) |
52.5 (20.7) |
223.5 (88.0) |
| Average precipitation days (≥ 0.2 mm) | 16.6 | 13.1 | 12.7 | 12.4 | 13.4 | 13.2 | 11.9 | 11.0 | 12.3 | 14.3 | 15.2 | 17.4 | 163.6 |
| Average rainy days (≥ 0.2 mm) | 4.4 | 3.9 | 6.7 | 10.9 | 13.4 | 13.2 | 11.9 | 11.0 | 12.3 | 13.7 | 11.0 | 6.0 | 118.4 |
| Average snowy days (≥ 0.2 cm) | 16.1 | 12.1 | 8.8 | 3.5 | 0.17 | 0.0 | 0.0 | 0.0 | 0.0 | 1.1 | 6.8 | 14.7 | 63.3 |
| Average relative humidity (%) | 67.5 | 61.3 | 56.6 | 50.2 | 49.9 | 53.1 | 53.7 | 55.0 | 59.1 | 61.6 | 68.1 | 72.2 | 59.0 |
| Mean monthly sunshine hours | 122.4 | 114.1 | 168.5 | 187.5 | 210.5 | 274.0 | 301.4 | 231.9 | 211.5 | 148.8 | 92.4 | 68.8 | 2,131.7 |
| Percent possible sunshine | 43.1 | 39.0 | 45.7 | 46.3 | 45.7 | 58.6 | 63.7 | 53.1 | 56.1 | 43.7 | 32.2 | 25.2 | 46.0 |
| Source: Environment Canada[17][18][19][20][21][22] | |||||||||||||
Notes
- Extreme high and low temperatures in the table below were recorded at Ottawa from March 1872 to October 1889 and at Ottawa CDA from November 1889 to present.
Historical data
| Climate data for Ottawa (Central Experimental Farm), elevation: 79 m (259 ft), 1961-1990 normals | |||||||||||||
|---|---|---|---|---|---|---|---|---|---|---|---|---|---|
| Month | Jan | Feb | Mar | Apr | May | Jun | Jul | Aug | Sep | Oct | Nov | Dec | Year |
| Average high °C (°F) | −6.4 (20.5) |
−4.5 (23.9) |
1.8 (35.2) |
10.8 (51.4) |
18.6 (65.5) |
23.6 (74.5) |
26.4 (79.5) |
24.7 (76.5) |
19.7 (67.5) |
12.8 (55.0) |
4.8 (40.6) |
−3.6 (25.5) |
10.7 (51.3) |
| Daily mean °C (°F) | −10.7 (12.7) |
−9.2 (15.4) |
−2.6 (27.3) |
5.9 (42.6) |
13.0 (55.4) |
18.1 (64.6) |
20.8 (69.4) |
19.4 (66.9) |
14.7 (58.5) |
8.3 (46.9) |
1.5 (34.7) |
−7.2 (19.0) |
6.0 (42.8) |
| Average low °C (°F) | −15.1 (4.8) |
−14.0 (6.8) |
−7.1 (19.2) |
0.9 (33.6) |
7.3 (45.1) |
12.5 (54.5) |
15.3 (59.5) |
14.1 (57.4) |
9.6 (49.3) |
3.8 (38.8) |
−1.9 (28.6) |
−11.0 (12.2) |
1.2 (34.2) |
| Average precipitation mm (inches) | 50.8 (2.00) |
49.7 (1.96) |
56.6 (2.23) |
64.8 (2.55) |
76.8 (3.02) |
84.3 (3.32) |
86.5 (3.41) |
87.8 (3.46) |
83.6 (3.29) |
74.7 (2.94) |
81.0 (3.19) |
72.9 (2.87) |
869.5 (34.24) |
| Average rainfall mm (inches) | 14.1 (0.56) |
14.7 (0.58) |
30.0 (1.18) |
57.8 (2.28) |
76.2 (3.00) |
84.3 (3.32) |
86.5 (3.41) |
87.8 (3.46) |
83.6 (3.29) |
71.8 (2.83) |
64.1 (2.52) |
29.5 (1.16) |
700.4 (27.59) |
| Average snowfall cm (inches) | 46.1 (18.1) |
41.0 (16.1) |
27.2 (10.7) |
6.7 (2.6) |
0.6 (0.2) |
0.0 (0.0) |
0.0 (0.0) |
0.0 (0.0) |
0.0 (0.0) |
2.9 (1.1) |
19.1 (7.5) |
53.9 (21.2) |
197.5 (77.5) |
| Average precipitation days (≥ 0.2 mm) | 15 | 12 | 12 | 12 | 13 | 13 | 12 | 12 | 13 | 13 | 15 | 16 | 158 |
| Average rainy days (≥ 0.2 mm) | 3 | 3 | 6 | 11 | 13 | 13 | 12 | 12 | 13 | 13 | 11 | 5 | 115 |
| Average snowy days (≥ 0.2 cm) | 14 | 11 | 7 | 2 | trace | 0 | 0 | 0 | 0 | trace | 5 | 14 | 53 |
| Mean monthly sunshine hours | 103.4 | 129.2 | 158.7 | 188.1 | 232.5 | 253.0 | 279.0 | 240.5 | 170.0 | 137.9 | 81.9 | 80.1 | 2,054.3 |
| Source: Environment Canada[23] | |||||||||||||
| Climate data for Ottawa (Ottawa International Airport), elevation: 116 m (381 ft), 1938-1990 normals | |||||||||||||
|---|---|---|---|---|---|---|---|---|---|---|---|---|---|
| Month | Jan | Feb | Mar | Apr | May | Jun | Jul | Aug | Sep | Oct | Nov | Dec | Year |
| Average high °C (°F) | −6.3 (20.7) |
−4.6 (23.7) |
1.8 (35.2) |
10.8 (51.4) |
18.6 (65.5) |
23.6 (74.5) |
26.4 (79.5) |
24.6 (76.3) |
19.6 (67.3) |
12.8 (55.0) |
4.7 (40.5) |
−3.7 (25.3) |
10.7 (51.2) |
| Daily mean °C (°F) | −10.8 (12.6) |
−9.2 (15.4) |
−2.7 (27.1) |
5.6 (42.1) |
12.8 (55.0) |
17.9 (64.2) |
20.8 (69.4) |
19.2 (66.6) |
14.3 (57.7) |
7.9 (46.2) |
1.0 (33.8) |
−7.6 (18.3) |
5.8 (42.4) |
| Average low °C (°F) | −15.5 (4.1) |
−14.0 (6.8) |
−7.3 (18.9) |
0.3 (32.5) |
7.1 (44.8) |
12.2 (54.0) |
15.1 (59.2) |
13.7 (56.7) |
8.9 (48.0) |
3.0 (37.4) |
−2.8 (27.0) |
−11.7 (10.9) |
0.8 (33.4) |
| Average precipitation mm (inches) | 58.0 (2.28) |
58.6 (2.31) |
64.8 (2.55) |
69.0 (2.72) |
76.4 (3.01) |
76.9 (3.03) |
88.1 (3.47) |
92.0 (3.62) |
82.9 (3.26) |
74.8 (2.94) |
86.4 (3.40) |
82.5 (3.25) |
910.4 (35.84) |
| Average rainfall mm (inches) | 15.3 (0.60) |
16.4 (0.65) |
32.0 (1.26) |
58.0 (2.28) |
74.8 (2.94) |
76.9 (3.03) |
88.1 (3.47) |
92.0 (3.62) |
82.9 (3.26) |
70.3 (2.77) |
62.5 (2.46) |
32.6 (1.28) |
701.8 (27.62) |
| Average snowfall cm (inches) | 49.6 (19.5) |
45.2 (17.8) |
32.3 (12.7) |
9.1 (3.6) |
1.2 (0.5) |
0.0 (0.0) |
0.0 (0.0) |
0.0 (0.0) |
0.0 (0.0) |
4.1 (1.6) |
24.2 (9.5) |
55.8 (22.0) |
221.5 (87.2) |
| Average precipitation days (≥ 0.2 mm) | 16 | 13 | 13 | 12 | 13 | 12 | 11 | 11 | 12 | 13 | 16 | 18 | 160 |
| Average rainy days (≥ 0.2 mm) | 3 | 3 | 7 | 10 | 12 | 12 | 11 | 11 | 12 | 12 | 11 | 6 | 110 |
| Average snowy days (≥ 0.2 cm) | 15 | 12 | 9 | 3 | trace | 0 | 0 | 0 | 0 | 1 | 8 | 16 | 64 |
| Average relative humidity (%) | 71 | 68 | 66 | 61 | 61 | 66 | 67 | 71 | 74 | 73 | 77 | 77 | 69 |
| Source: Environment Canada[24] | |||||||||||||
Rivers and creeks


Tributaries of the Ottawa River (from east to west):
- Becketts Creek
- Cardinal Creek
- Taylor Creek
- Bilberry Creek
- Green's Creek
- Mud Creek
- Borthwick Creek
- Nicolet Drain
- Ramsay Creek
- McEwan Creek
- Rideau River
- Rideau Canal (artificial)
- Graham Creek
- Still Water Creek
- Watts Creek
- Shirley's Brook
- Constance Creek
- Carp River
- Mississippi River
- Cartwrights Creek
- Cody Creek
- Madawaska River (mouth not in Ottawa)

Tributaries of the Rideau River (from north to south):
- Sawmill Creek
- Nepean Creek
- Black Rapids Creek
- Mosquito Creek
- Jock River
- Mahoney Creek
- Nichols Creek
- Kings Creek
- Mud Creek
- Stevens Creek
- Cranberry Creek
- McDermot Drain (mouth not in Ottawa)
- Brassills Creek
- Rideau Creek
Other rivers and creeks within City of Ottawa:
- Bear Brook
- South Indian Creek
- Shaws Creek
- McKinnons Creek
- North Castor River
- Black Creek
- Middle Castor River
- South Castor River
Features of the Ottawa River


(from east to west)
- Petrie Island
- Lower Duck Island
- Upper Duck Island
- Governor Bay
- Nepean Point
- Victoria Island
- Chaudière Island
- Chaudière Falls
- Nepean Bay
- Lemieux Island
- Bell Island
- Merrill Island
- Nicholas Island
- Lazy Bay
- Little Chaudière Rapids
- Remic Rapids
- Bate Island
- Cummingham Island
- Riopelle Island
- Deschênes Rapids
- Britannia Bay
- Graham Bay
- Rocky Point
- Crystal Bay
- Beatty Point
- Shirleys Bay
- Haycock Island
- Chartrand Island
- Innis Point
- Aylmer Island
- Pinhey Point
- Stony Point
- Horseshoe Bay
- Constance Bay
- Sand Point
- Buckham's Point
- Buckham's Bay
- Crown Point
- Woolsey Narrows
- Alexandra Island
- Kedey's Island
- Chats Falls
- Morris Island
- Lavergne Point
- Lavergne Bay
- Pickerel Bay
- Snake Island
- Indian Point
- Marshall Bay
- Pocket Bay
- Goodwin Bay
Features of the Rideau River

(from north to south)
- Rideau Falls
- Green Island
- Maple Island
- Porter Island
- Cummings Island
- Hog's Back Falls (Prince of Wales Falls)
- Mooney's Bay
- Black Rapids
- Nicholls Island
- Long Island
- Mahogany Harbour
- Collins Point
- Sanders Island
- James Island
- McGahey's Bend
Lakes

- Brewer Park Pond
- Constance Lake
- Lac des Chats
- Dow's Lake
- Lac Deschênes
- Lake Madawaska
- McKay Lake
- Mud Lake
- Mud Pond
- Sand Pits Lake
References
- Government of Canada, Statistics Canada (9 February 2022). "Census Profile, 2021 Census of Population". www12.statcan.gc.ca. Retrieved 11 December 2022.
- Ottawa High Point, Ontario
- "Ottawa-Gatineau Geoheritage". Retrieved 2018-10-04.
- "Ottawa, Ontario Köppen Climate Classification (Weatherbase)". Weatherbase. Retrieved 2019-07-16.
- Muller, M. J. (2012-12-06). Selected climatic data for a global set of standard stations for vegetation science. Springer Science & Business Media. ISBN 9789400980402.
- "Report from Task 4 of MEWS Project - Task 4-Environmental Conditions Final Report". ResearchGate. Retrieved 2019-07-16.
- "Ottawa CDA". Environment Canada. Retrieved 10 June 2016.
- "Daily Data Report for May 2010". Environment Canada. 22 September 2015. Retrieved 10 June 2016.
- "Daily Data Report for January 1874". Environment Canada. 22 September 2015. Retrieved 10 June 2016.
- "Daily Data Report for November 1875". Environment Canada. 22 September 2015. Retrieved 10 June 2016.
- "Daily Data Report for August 1884". Environment Canada. 22 September 2015. Retrieved 10 June 2016.
- "Daily Data Report for February 2011". Environment Canada. 22 September 2015. Retrieved 10 June 2016.
- "Daily Data Report for March 2012". Environment Canada. 22 September 2015. Retrieved 10 June 2016.
- "Daily Data Report for December 2012". Environment Canada. 22 September 2015. Retrieved 10 June 2016.
- "Daily Data Report for February 2017". Environment Canada. Retrieved 25 February 2017.
- "Ottawa, Canada - Detailed climate information and monthly weather forecast". Weather Atlas. Yu Media Group. Retrieved 2019-07-06.
- "Canadian Climate Normals 1981–2010 Station Data: Ottawa, Ontario". Environment Canada. Retrieved 17 May 2016.
- "1981 to 2010 Canadian Climate Normals". Environment Canada. 2 July 2013. Climate ID: 6106000. Archived from the original on 2020-07-18. Retrieved 19 July 2013.
- "Daily Data Report for October 2015". Environment Canada. 22 September 2015. Climate ID: 6106000. Retrieved 9 February 2016.
- "Daily Data Report for March 2012". Environment Canada. 22 September 2015. Climate ID: 6106000. Retrieved 10 June 2016.
- "Daily Data Report for December 2012". Environment Canada. 22 September 2015. Climate ID: 6106000. Retrieved 10 June 2016.
- "Electricity use to hit highest in years this week in Ontario". The Weather Network. 2 July 2018. Retrieved 3 July 2018.
- "Canadian Climate Normals 1961-1990 Station Data Ottawa CDA". Environment Canada. Retrieved 21 May 2019.
- "Canadian Climate Normals 1961-1990 Station Data Ottawa International Airport". Environment Canada. Retrieved 21 May 2019.
External links
| History |
|
|---|---|
| Geography | |
| Culture | |
| Public services | |
| Education | |
| Government | |
| Transportation and infrastructure |
|
| Features | |
| |