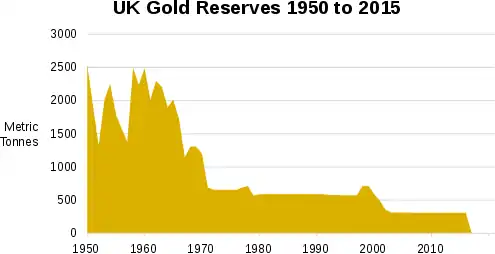
Gold reserves of the United Kingdom
The gold reserve of the United Kingdom is the amount of gold kept by Bank of England as a store of value of part of the United Kingdom's wealth. Leftover from the Gold Standard which the country abandoned in 1931, it is the 17th largest central bank reserve in the world with 310.29 tonnes of gold bars.[1]
History
World War II
Prior to Britain's declaration of war in September 1939 vast amounts of gold were being shipped across the Atlantic to the United States via Montreal, Quebec, Canada to pay for weapons. After France was invaded by Nazi Germany, fear of Britain also suffering the same fate led to most of the country's gold being relocated under a secret operation known as Operation Fish. In May 1940, under the order of the UK Government; 280 tonnes of the nation's gold was transported from the Bank of England in London up to Martins' Bank in Liverpool ready to be shipped to Canada.
By the end of the war in 1945, Britain was estimated to have reserves in excess of 1772.94 tonnes, however, with incomplete records; the figure may have been higher.[2]
Brown's Bottom
In May 1999, then-Chancellor of the Exchequer Gordon Brown announced plans to sell off 415 tonnes of gold in order to diversify the country's reserves owing to the volatile value of gold.[3] The first series of sales amounting to 125 tonnes took place in the year 2000 across five auctions with each selling 25 tonnes.[4] By the end of 2002, UK gold reserves dropped to 355.25 tonnes while at the same time the value of gold increased dramatically leading to an estimated loss of £2,000,000,000 from the gold sold.[5]
Gold reserves

| UK Gold Reserves by year[2][6] | |||||
|---|---|---|---|---|---|
| Year | Tonnes | +/- Change | Year | Tonnes | +/- Change |
| Jan 2017 | 310.29 | 1972 | 656 | ||
| 2016 | 310.29 | 1971 | 690 | ||
| 2015 | 310.29 | 1970 | 1198 | ||
| 2014 | 310.25 | 1969 | 1308 | ||
| 2013 | 310.25 | 1968 | 1309 | ||
| 2012 | 310.25 | 1967 | 1146 | ||
| 2011 | 310.25 | 1966 | 1725 | ||
| 2010 | 310.25 | 1965 | 2012 | ||
| 2009 | 310.25 | 1964 | 1899 | ||
| 2008 | 310.26 | 1963 | 2208 | ||
| 2007 | 310.25 | 1962 | 2294 | ||
| 2006 | 310.8 | 1961 | 2014 | ||
| 2005 | 312.25 | 1960 | 2489 | ||
| 2004 | 313.22 | 1959 | 2234 | ||
| 2003 | 313.87 | 1958 | 2495 | ||
| 2002 | 355.25 | 1957 | 1382 | ||
| 2001 | 487.5 | 1956 | 1576 | ||
| 2000 | 588.27 | 1955 | 1788 | ||
| 1999 | 715 | 1954 | 2255 | ||
| 1998 | 715 | 1953 | 2011 | ||
| 1997 | 573 | 1952 | 1317 | ||
| 1996 | 573 | 1951 | 1930 | ||
| 1995 | 573 | 1950 | 2543 | ||
| 1994 | 574 | 1945 | 1772.94 | ||
| 1993 | 574 | 1940 | 1390.22 | ||
| 1992 | 579 | 1935 | 1464.56 | ||
| 1991 | 588 | 1930 | 1080 | ||
| 1990 | 589 | 1925 | 1045.53 | ||
| 1989 | 591 | 1920 | 863.75 | ||
| 1988 | 591 | 1915 | 584.6 | ||
| 1987 | 591 | 1913 | 248.09 | ||
| 1986 | 591 | 1910 | 223.37 | ||
| 1985 | 592 | 1905 | 199.21 | ||
| 1984 | 592 | 1900 | 198.47 | ||
| 1983 | 591 | 1895 | 304.67 | ||
| 1982 | 591 | 1890 | 166.25 | ||
| 1981 | 592 | 1885 | 141.35 | ||
| 1980 | 586 | 1880 | 170.6 | ||
| 1979 | 568 | 1875 | 153.8 | ||
| 1978 | 710 | 1870 | 161.11 | ||
| 1977 | 691 | 1865 | 93 | ||
| 1976 | 654 | 1860 | 77.63 | ||
| 1975 | 654 | 1855 | 74 | ||
| 1974 | 654 | 1850 | 104.72 | ||
| 1973 | 653 | 1845 | 82 | ||
References
- "The countries with the largest gold reserves". The Telegraph. 13 July 2011. Retrieved 19 May 2018.
- Green, Timothy (November 1999). "Central Bank Gold Reserves An historical perspective since 1845" (PDF). World Gold Council. Retrieved 19 May 2017.
- Coyle, Diane (7 May 1999). "Britain stuns markets with plan to sell gold reserves". The Independent. Retrieved 19 May 2017.
- "Business: The Economy Treasury offloads gold reserves". BBC. 7 May 1999. Retrieved 19 May 2017.
- "Chancellor's '£2 billion gold bungle'". politics.co.uk. 15 April 2007. Retrieved 19 May 2017.
- Watt, Holly (24 March 2010). "Explain why you sold Britain's gold, Gordon Brown told". The Telegraph. Retrieved 19 May 2017.