Hereford, Texas
Hereford (/ˈhɜːrfərd/ HUR-furd[5]) is a city in and county seat of Deaf Smith County, Texas, United States. It is 48 miles southwest of Amarillo. Its population was 15,370 at the 2010 census.[6] It is the only incorporated locality named "Hereford" in the country.[7]
Hereford | |
|---|---|
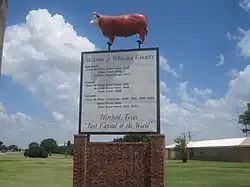 Hereford welcome sign on U.S. Highway 385 | |
| Motto(s): Beef Capital of the World; The Town Without a Toothache; Most Conservative Town in America | |
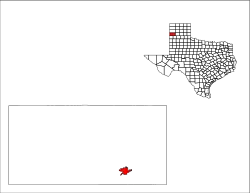
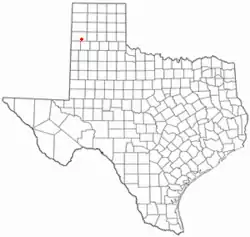 Location of Hereford, Texas | |
 | |
| Coordinates: 34°49′22″N 102°23′55″W | |
| Country | United States of America |
| State | Texas |
| County | Deaf Smith |
| Area | |
| • Total | 6.30 sq mi (16.32 km2) |
| • Land | 6.30 sq mi (16.32 km2) |
| • Water | 0.00 sq mi (0.00 km2) |
| Elevation | 3,819 ft (1,164 m) |
| Population (2010) | |
| • Total | 15,370 |
| • Estimate (2019)[3] | 14,622 |
| • Density | 2,320.22/sq mi (895.80/km2) |
| Time zone | UTC-6 (Central (CST)) |
| • Summer (DST) | UTC-5 (CDT) |
| ZIP code | 79045 |
| Area code | 806 |
| FIPS code | 48-33320 [4] |
| GNIS feature ID | 2410747[2] |
| Website | www |
Hereford's local water supply contains an unusually high level of naturally occurring fluoride. Because fluoride is used to protect against tooth decay, Hereford earned the title "The Town Without a Toothache".
It is also known as the "Beef Capital of the World" because of the large number of cattle feedlots in the area. The city is named for the Hereford breed. The local economy is affected significantly by growth in the dairy and ethanol industries.
The area is known for its semiarid climate, with heavy farming and ranching throughout the area sustained by irrigation from the Ogallala Aquifer and the saltier Santa Rosa Aquifer beneath it.
Hereford is home to the headquarters of the Deaf Smith Electric Cooperative, which serves Deaf Smith, Castro, Parmer, and Oldham Counties.[8]
A rich Western heritage includes the Las Escarbadas ranch house of the XIT Ranch, once located southwest of Hereford. The restored historic structure can now be seen at the National Ranching Heritage Center at Texas Tech University in Lubbock. The Deaf Smith County Historical Museum at 400 Sampson Street in Hereford offers indoor and outdoor exhibits on the settlement of West Texas.
Hereford was once known as the "Windmill City"[9] due to its many windmills supplying fresh water from the Ogallala Aquifer.
In December 2015, the Seattle Post-Intelligencer voted Hereford not only the "most conservative" city in Texas, but also in the United States, in terms of political contributions. Other West Texas communities in the most conservative lineup are Childress (number 9), Dalhart (number 8), and Monahans (number five). Princeton in Collin County north of Dallas was ranked number two. In contrast, Vashon Island, Washington, was named the "most liberal" city in the nation regarding political donations.[10]
History
.jpg.webp)
Hereford was founded as "Blue Water" in 1899 after the Pecos and Northern Texas Railway connected Amarillo to Farwell. After a town already named Blue Water was discovered, residents renamed the town "Hereford" in honor of the cattle of the local ranchers and the city, Hereford, in the United Kingdom.[11]
During World War II, a prisoner-of-war camp existed there for Italian prisoners of war. It was dismantled in 1947.
In 1975, popular high school teacher Wayne Woodward was fired for his efforts to establish a local branch of the American Civil Liberties Union. Mr. Woodward won a subsequent legal suit, that gained national attention, against the Hereford Independent School District. The events were documented in the 2022 book You Will Never Be One of Us by Timothy P. Bowman.[12][13][14]
Geography
Hereford is located in southeastern Deaf Smith County and on the Llano Estacado. According to the United States Census Bureau, the city has a total area of 5.9 square miles (15.4 km2), all land.[6]
U.S. Highway 60 passes through the city as 1st Street, leading northeast 48 miles (77 km) to Amarillo and southwest 57 miles (92 km) to Clovis, New Mexico. U.S. Highway 385 (25 Mile Avenue) runs north–south through the city, leading north 30 miles (48 km) to Interstate 40 at Vega and south 20 miles (32 km) to Dimmitt.
Climate
Hereford's climate is classified as a steppe climate (BSk) using the 2006 map of Köppen climate classification, meaning it is semiarid.[15] Hereford was named as the "coolest" city in Texas with an average summer temperature of 73 °F or 22.8 °C.[16]
| Climate data for Hereford, Texas | |||||||||||||
|---|---|---|---|---|---|---|---|---|---|---|---|---|---|
| Month | Jan | Feb | Mar | Apr | May | Jun | Jul | Aug | Sep | Oct | Nov | Dec | Year |
| Record high °F (°C) | 84 (29) |
83 (28) |
98 (37) |
98 (37) |
103 (39) |
111 (44) |
110 (43) |
105 (41) |
102 (39) |
97 (36) |
87 (31) |
80 (27) |
111 (44) |
| Average high °F (°C) | 49.8 (9.9) |
55.1 (12.8) |
63.6 (17.6) |
72.0 (22.2) |
80.2 (26.8) |
88.9 (31.6) |
91.6 (33.1) |
89.3 (31.8) |
82.6 (28.1) |
72.9 (22.7) |
59.7 (15.4) |
50.6 (10.3) |
71.4 (21.9) |
| Average low °F (°C) | 21.1 (−6.1) |
24.6 (−4.1) |
30.9 (−0.6) |
39.4 (4.1) |
49.7 (9.8) |
59.1 (15.1) |
63.5 (17.5) |
61.2 (16.2) |
54.3 (12.4) |
42.5 (5.8) |
30.1 (−1.1) |
22.6 (−5.2) |
41.7 (5.4) |
| Record low °F (°C) | −15 (−26) |
−17 (−27) |
1 (−17) |
14 (−10) |
16 (−9) |
40 (4) |
51 (11) |
40 (4) |
31 (−1) |
15 (−9) |
0 (−18) |
−12 (−24) |
−17 (−27) |
| Average precipitation inches (mm) | 0.50 (13) |
0.50 (13) |
0.98 (25) |
1.02 (26) |
2.12 (54) |
2.90 (74) |
2.06 (52) |
3.22 (82) |
2.25 (57) |
1.59 (40) |
0.77 (20) |
0.74 (19) |
18.65 (475) |
| Average snowfall inches (cm) | 4.8 (12) |
3.0 (7.6) |
1.5 (3.8) |
0.8 (2.0) |
0 (0) |
0 (0) |
0 (0) |
0 (0) |
0 (0) |
0.3 (0.76) |
1.7 (4.3) |
4.8 (12) |
16.9 (43) |
| Average precipitation days | 3.0 | 3.4 | 4.2 | 4.7 | 6.8 | 7.4 | 6.4 | 7.7 | 6.0 | 4.7 | 3.5 | 3.8 | 61.6 |
| Average snowy days | 1.9 | 1.6 | 0.8 | 0.4 | 0 | 0 | 0 | 0 | 0 | 0.1 | 0.8 | 2.0 | 7.6 |
| Source 1: The Weather Channel [17] | |||||||||||||
| Source 2: NOAA [18] | |||||||||||||
Demographics
| Census | Pop. | Note | %± |
|---|---|---|---|
| 1900 | 532 | — | |
| 1910 | 1,750 | 228.9% | |
| 1920 | 1,696 | −3.1% | |
| 1930 | 2,458 | 44.9% | |
| 1940 | 2,584 | 5.1% | |
| 1950 | 5,207 | 101.5% | |
| 1960 | 6,752 | 29.7% | |
| 1970 | 13,414 | 98.7% | |
| 1980 | 15,853 | 18.2% | |
| 1990 | 14,745 | −7.0% | |
| 2000 | 14,597 | −1.0% | |
| 2010 | 15,370 | 5.3% | |
| 2019 (est.) | 14,622 | [3] | −4.9% |
| U.S. Decennial Census[19] | |||
2020 census
| Race | Number | Percentage |
|---|---|---|
| White (NH) | 2,757 | 18.41% |
| Black or African American (NH) | 98 | 0.65% |
| Native American or Alaska Native (NH) | 39 | 0.26% |
| Asian (NH) | 32 | 0.21% |
| Some Other Race (NH) | 39 | 0.26% |
| Mixed/Multi-Racial (NH) | 129 | 0.86% |
| Hispanic or Latino | 11,878 | 79.33% |
| Total | 14,972 |
As of the 2020 United States census, there were 14,972 people, 4,776 households, and 3,593 families residing in the city.
2010 census
As of the 2010 United States Census, 15,370 people resided in the city. The racial makeup of the city was 71.7% Hispanic or Latino, 26.3% White, 0.9% Black, 0.2% Native American, 0.3% Asian, 0.1% from some other race, and 0.5% from two or more races.
2000 census
As of the census[4] of 2000, 14,597 people, 4,839 households, and 3,730 families resided in the city. The population density was 2,600.8 inhabitants per square mile (1,004.2/km2). The 5,323 housing units averaged 948.4 per square mile (366.3/km2). The racial makeup of the city was 69.86% White, 1.76% African American, 0.82% Native American, 0.26% Asian, 0.12% Pacific Islander, 24.77% from other races, and 2.41% from two or more races. Hispanics or Latinos of any race were 61.37% of the population.
Of the 4,839 households, 42.2% had children under the age of 18 living with them, 58.4% were married couples living together, 14.4% had a female householder with no husband present, and 22.9% were not families. About 20.7% of all households were made up of individuals, and 11.3% had someone living alone who was 65 years of age or older. The average household size was 2.96 and the average family size was 3.44.
In the city, the population was distributed as 34.0% under the age of 18, 9.9% from 18 to 24, 25.6% from 25 to 44, 18.1% from 45 to 64, and 12.4% who were 65 years of age or older. The median age was 30 years. For every 100 females, there were 92.7 males. For every 100 females age 18 and over, there were 87.7 males.
The median income for a household in the city was $29,599, and for a family was $33,387. Males had a median income of $26,488 versus $18,920 for females. The per capita income for the city was $12,787. About 19.4% of families and 20.2% of the population were below the poverty line, including 25.9% of those under age 18 and 15.8% of those age 65 or over.
Education
The first public school was opened in 1900.[23] Today, Hereford's seven public schools serve around 4,000 students and are directed by the Hereford Independent School District.[24]
Notable people
- Parker Bridwell, pitcher for MLB's New York Yankees, was born in Hereford.
- Ron Ely, actor, best remembered for his role as Tarzan on an NBC television series in the 1960s, was born in Hereford in 1938
- Lon L. Fuller (1902–1978), American legal philosopher known for his advocacy of a secular form of natural law theory, was born in Hereford
- Rip Hawk, professional wrestler, lived in Hereford, after retiring from wrestling.
- Edgar Mitchell (1930–2016), who on Apollo 14 in 1971 became the sixth astronaut to walk on the Moon, was born in Hereford.
- Skeeter Skelton, lawman and firearms writer
Gallery
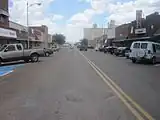 Downtown Hereford, with the grain elevator to the rear
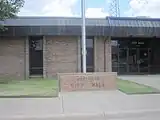 Hereford City Hall
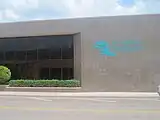 First Bank Southwest in Hereford
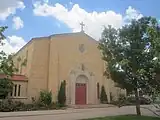 St. Anthony's Roman Catholic Church in Hereford is located off U.S. Highway 385.
 Swimming in Hereford
 Hereford train depot
 Hereford Brand newspaper office
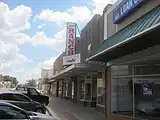 The former Mills Ranch Western Store, once a fixture of downtown Hereford
References
- "2019 U.S. Gazetteer Files". United States Census Bureau. Retrieved August 7, 2020.
- U.S. Geological Survey Geographic Names Information System: Hereford, Texas
- "Population and Housing Unit Estimates". United States Census Bureau. May 24, 2020. Retrieved May 27, 2020.
- "U.S. Census website". United States Census Bureau. Retrieved January 31, 2008.
- "Archived copy". Archived from the original on September 21, 2013. Retrieved November 28, 2012.
{{cite web}}: CS1 maint: archived copy as title (link) - "Geographic Identifiers: 2010 Demographic Profile Data (G001): Hereford city, Texas". American Factfinder. U.S. Census Bureau. Archived from the original on February 13, 2020. Retrieved January 7, 2016.
- "Find a County". National Association of Counties. Archived from the original on May 31, 2011. Retrieved June 7, 2011.
- Spotlight on CRC Member: Deaf Smith Electric Cooperative. Cooperative Response Center.
- Hereford Economic Development Corporation (August 20, 2020). ""The Windmill City"". Hereford, Texas.
- Daniel DeMay (December 17, 2015). "The most liberal and most conservative cities in the US". The Connecticut Post. Bridgeport, Connecticut. Retrieved December 20, 2015.
- "Hereford, TX".
- Bynum, Katherine; Woodward, Wayne (June 9, 2016). "Oral History Interview with Wayne Woodward, June 9, 2016". texashistory.unt.edu. Retrieved October 23, 2022.
- "Woodward v. Hereford Independent Sch. Dist., 421 F. Supp. 93 (N.D. Tex. 1976)". Justia Law. Retrieved October 23, 2022.
- Paul., Bowman, Timothy. You Will Never Be One of Us : a Teacher, a Texas Town, and the Rural Roots of Radical Conservatism. ISBN 0-8061-9133-3. OCLC 1334105884.
{{cite book}}: CS1 maint: multiple names: authors list (link) - M. Kottek; J. Grieser; C. Beck; B. Rudolf; F. Rubel (2006). "World Map of the Köppen-Geiger climate classification updated" (GIF). Meteorol. Z. 15 (3): 259–263. Bibcode:2006MetZe..15..259K. doi:10.1127/0941-2948/2006/0130. Retrieved August 26, 2009.
- "These Are the 10 Best Places to Live in Texas".
- "Monthly Averages for Hereford, TX". The Weather Channel. Archived from the original on July 3, 2014. Retrieved June 29, 2010.
- "NCDC: Climatography of the United States, No. 20, 1971–2000: Hereford, Texas" (PDF). National Oceanic and Atmospheric Administration. Archived from the original (PDF) on July 18, 2014. Retrieved June 29, 2010.
- "Census of Population and Housing". Census.gov. Retrieved June 4, 2015.
- "Explore Census Data". data.census.gov. Retrieved May 19, 2022.
- https://www.census.gov/
- "About the Hispanic Population and its Origin". www.census.gov. Retrieved May 18, 2022.
- The Handbook of Texas Online, retrieved 2009-12-30
- Hereford ISD, retrieved 2009-12-30
External links
- City of Hereford official website
- Historic photographs of Hereford from the Deaf Smith County Library hosted by the Portal to Texas History
Municipalities and communities of Deaf Smith County, Texas, United States | ||
|---|---|---|
| City | 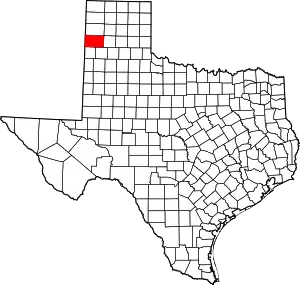 Deaf Smith County map | |
| Unincorporated communities | ||
| Ghost towns | ||
| Footnotes | ‡This populated place also extends into New Mexico | |