Iowa's 2nd congressional district
Iowa's 2nd congressional district is a congressional district in the U.S. state of Iowa that covers most of its northeastern part. It includes Cedar Rapids, Dubuque, Waterloo, and Grinnell.
| Iowa's 2nd congressional district | |||
|---|---|---|---|
Interactive map of district boundaries since January 3, 2023 | |||
| Representative |
| ||
| Distribution |
| ||
| Population (2022) | 793,421 | ||
| Median household income | $67,862[1] | ||
| Ethnicity |
| ||
| Cook PVI | R+4[2] | ||
The district is represented by Republican Ashley Hinson.
Statewide races since 2000
Election results from statewide races:
| Office | Year | District result | Winner | |
|---|---|---|---|---|
| Statewide | Nationwide | |||
| President | 2000 | Al Gore 53% – George W. Bush 43% | Gore | Bush |
| 2004 | John Kerry 55% – George W. Bush 44% | Bush | ||
| 2008 | Barack Obama 60% – John McCain 38% | Obama | Obama | |
| 2012 | Barack Obama 56% – Mitt Romney 43% | |||
| 2016 | Donald Trump 49% – Hillary Clinton 44% | Trump | Trump | |
| 2020 | Donald Trump 51% – Joe Biden 47% | Biden | ||
| U.S. Senator | 2014 | Joni Ernst 49% – Bruce Braley 47% | Ernst | n/a |
| 2016 | Chuck Grassley 56.2% – Patty Judge 39.4% | Grassley | ||
| 2020 | Joni Ernst 49.2% – Theresa Greenfield 47.7% | Ernst | ||
| 2022 | Chuck Grassley 54.6% – Michael Franken 45.3% | Grassley | ||
| Governor | 2014 | Terry Branstad 57% – Jack Hatch 40% | Branstad | |
| 2018 | Fred Hubbell 50.7% – Kim Reynolds 47.3% | Reynolds | ||
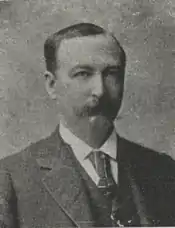
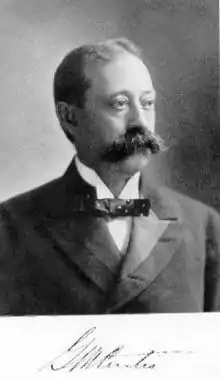
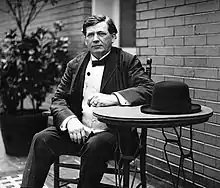
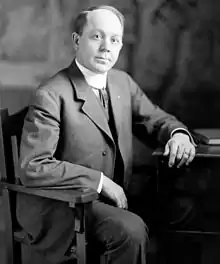
List of members representing the district
- Service effectively ended in 1861 when promoted to Major General, but did not officially resign.
- Although his official congressional biography states he declined to run for a third term, newspaper reports indicate that he was an active but unsuccessful candidate for renomination.
Recent election results
| Year | Winner | Loser | Percentage | ||||
|---|---|---|---|---|---|---|---|
| Party affiliation | Candidate | Votes | Party affiliation | Candidate | Votes | ||
| 1920 | Republican | Harry E. Hull | 50,160 | Farmer–Labor | F. B. Althouse | 6,058 | 89% – 11% |
| 1922 | 27,450 | Democratic | Wayne G. Cook | 25,620 | 51% – 48% | ||
| 1924 | Fred Dickinson Letts | 49,117 | Ralph U. Thompson | 32,893 | 60% – 40% | ||
| 1926 | 29,200 | J. P. Gallagher | 19,612 | 60% – 40% | |||
| 1928 | 49,690 | Frank Z. Titzell | 37,344 | 57% – 43% | |||
| 1930 | Democratic | Bernhard M. Jacobsen | 30,008 | Republican | F. D. Letts | 24,113 | 55% – 45% |
| 1932 | 71,914 | Frank W. Elliott | 50,636 | 59% – 41% | |||
| 1934 | 60,654 | Martin B. Andelfinger | 39,047 | 63% – 35% | |||
| 1936 | William S. Jacobsen | 70,923 | Charles Penningroth | 55,255 | 53% – 41% | ||
| 1938 | 48,155 | Alfred C. Mueller | 47,535 | 50% – 49% | |||
| 1940 | 75,774 | W. A. McCullough | 69,298 | 52% – 48% | |||
| 1942 | Republican | Henry O. Talle | 62,290 | Democratic | William S. Jacobsen | 46,310 | 57% – 43% |
| 1944 | 86,903 | George C. Classen | 68,489 | 56% – 44% | |||
| 1946 | 60,111 | Richard V. Bernhart | 41,544 | 59% – 41% | |||
| 1948 | 82,139 | T. W. Mullaney | 60,272 | 57% – 42% | |||
| 1950 | 79,066 | Eugene J. Kean | 55,359 | 59% – 41% | |||
| 1952 | 114,553 | T. W. Mullaney | 69,421 | 62% – 38% | |||
| 1954 | 72,231 | Ruben V. Austin | 58,092 | 55% – 46% | |||
| 1956 | 95,999 | Leonard G. Wolf | 90,843 | 51% – 49% | |||
| 1958 | Democratic | Leonard G. Wolf | 67,022 | Republican | Henry O. Talle | 64,073 | 51% – 49% |
| 1960 | Republican | James E. Bromwell | 108,137 | Democratic | Leonard G. Wolf | 97,608 | 53% – 47% |
| 1962 | 67,475 | Frank W. Less | 60,296 | 53% – 47% | |||
| 1964 | Democratic | John C. Culver | 97,470 | Republican | James E. Bromwell | 89,299 | 52% – 48% |
| 1966 | 76,281 | Robert M. L. Johnson | 65,079 | 54% – 46% | |||
| 1968 | 103,651 | Tom Riley | 84,634 | 55% – 45% | |||
| 1970 | 84,049 | Cole McMartin | 54,934 | 60% – 40% | |||
| 1972 | 115,489 | Theodore R. Ellsworth | 79,667 | 59% – 41% | |||
| 1974 | Michael T. Blouin | 73,416 | Tom Riley | 69,088 | 51% – 48% | ||
| 1976 | 102,980 | 100,344 | 50% – 49% | ||||
| 1978 | Republican | Thomas J. Tauke | 72,644 | Democratic | Michael T. Blouin | 65,450 | 52% – 47% |
| 1980 | 111,587 | Steve Sovern | 93,175 | 54% – 45% | |||
| 1982 | 99,478 | Brent Appel | 69,539 | 59% – 41% | |||
| 1984 | 136,839 | Joe Welsh | 77,335 | 64% – 36% | |||
| 1986 | 88,708 | Eric Tabor | 55,903 | 61% – 39% | |||
| 1988 | 113,543 | 86,438 | 58% – 43% | ||||
| 1990 | Jim Nussle | 82,650 | 81,008 | 50% – 49% | |||
| 1992 | 134,536 | David R. Nagle | 131,570 | 50% – 49% | |||
| 1994 | 111,076 | 86,087 | 56% – 43% | ||||
| 1996 | 127,827 | Donna L. Smith | 109,731 | 53% – 46% | |||
| 1998 | 104,613 | Rob Tully | 83,405 | 55% – 44% | |||
| 2000 | 139,906 | Donna L. Smith | 110,327 | 55% – 44% | |||
| 2002 | Jim Leach | 108,130 | Julie Thomas | 94,767 | 52% – 46% | ||
| 2004 | 176,684 | Dave Franker | 117,405 | 59% – 39% | |||
| 2006 | Democratic | Dave Loebsack | 107,097 | Republican | Jim Leach | 101,386 | 51% – 49% |
| 2008 | 173,639 | Mariannette Miller-Meeks | 118,040 | 57% – 38% | |||
| 2010 | 115,839 | 104,319 | 50% – 45% | ||||
| 2012 | 211,863 | John Archer | 161,977 | 55% – 42% | |||
| 2014 | 143,431 | Mariannette Miller-Meeks | 129,455 | 52% – 47% | |||
| 2016 | 198,571 | Christopher Peters | 170,933 | 53% – 46% | |||
| 2018 | 171,120 | 133,051 | 54% – 42% | ||||
| 2020 | Republican | Mariannette Miller-Meeks | 196,864 | Democratic | Rita Hart | 196,858 | 49.910% – 49.908% |
- "Election Statistics". 2005. Archived from the original on July 25, 2007.
2002
| Party | Candidate | Votes | % | |
|---|---|---|---|---|
| Republican | Jim Leach | 108,130 | 52.19% | |
| Democratic | Julie Thomas | 94,767 | 45.74% | |
| Libertarian | Kevin Litten | 4,178 | 2.02% | |
| No party | Others | 96 | 0.05% | |
| Total votes | 207,171 | 100.00% | ||
| Republican hold | ||||
2004
| Party | Candidate | Votes | % | |
|---|---|---|---|---|
| Republican | Jim Leach (incumbent) | 176,684 | 58.92% | |
| Democratic | Dave Franker | 117,405 | 39.15% | |
| Libertarian | Kevin Litten | 5,586 | 1.86% | |
| No party | Others | 206 | 0.07% | |
| Total votes | 299,881 | 100.00% | ||
| Republican hold | ||||
2006
| Party | Candidate | Votes | % | |||
|---|---|---|---|---|---|---|
| Democratic | Dave Loebsack | 107,683 | 51.38% | |||
| Republican | Jim Leach (incumbent) | 101,707 | 48.53% | |||
| No party | Others | 196 | 0.09% | |||
| Total votes | 209,586 | 100.00% | ||||
| Democratic gain from Republican | ||||||
2008
| Party | Candidate | Votes | % | |
|---|---|---|---|---|
| Democratic | Dave Loebsack (incumbent) | 175,218 | 57.19% | |
| Republican | Mariannette Miller-Meeks | 118,778 | 38.77% | |
| Green | Wendy Barth | 6,664 | 2.18% | |
| Independent | Brian White | 5,437 | 1.78% | |
| No party | Others | 261 | 0.09% | |
| Total votes | 306,358 | 100.00% | ||
| Democratic hold | ||||
2010
| Party | Candidate | Votes | % | |
|---|---|---|---|---|
| Democratic | Dave Loebsack (incumbent) | 115,839 | 50.99% | |
| Republican | Mariannette Miller-Meeks | 104,319 | 45.92% | |
| Libertarian | Gary Joseph Sicard | 4,356 | 1.92% | |
| Constitution | Jon Tack | 2,463 | 1.08% | |
| No party | Others | 198 | 0.09% | |
| Total votes | 227,175 | 100.00% | ||
| Democratic hold | ||||
2012
| Party | Candidate | Votes | % | |
|---|---|---|---|---|
| Democratic | Dave Loebsack (incumbent) | 211,863 | 55.57% | |
| Republican | John Archer | 161,977 | 42.48% | |
| Independent | Alan Aversa | 7,112 | 1.87% | |
| No party | Others | 323 | 0.08% | |
| Total votes | 381,275 | 100.00% | ||
| Democratic hold | ||||
2014
| Party | Candidate | Votes | % | |
|---|---|---|---|---|
| Democratic | Dave Loebsack (incumbent) | 143,431 | 52.5% | |
| Republican | Mariannette Miller-Meeks | 129,455 | 47.4% | |
| Write-ins | 443 | 0.2% | ||
| Total votes | 273,329 | 100% | ||
| Democratic hold | ||||
2016
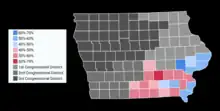
Map showing the results of the 2016 election in Iowa's second congressional district by county
| Party | Candidate | Votes | % | |
|---|---|---|---|---|
| Democratic | Dave Loebsack (incumbent) | 198,571 | 53.7% | |
| Republican | Christopher Peters | 170,933 | 46.2% | |
| Write-ins | 528 | 0.1% | ||
| Total votes | 370,032 | 100.00% | ||
| Democratic hold | ||||
2018
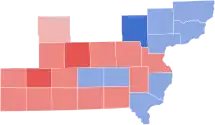
Results of the 2018 Iowa's 2nd congressional district election
| Party | Candidate | Votes | % | ±% | |
|---|---|---|---|---|---|
| Democratic | Dave Loebsack (incumbent) | 171,120 | 54.8% | +1.1 | |
| Republican | Christopher Peters | 133,051 | 42.6% | −3.6 | |
| Libertarian | Mark David Strauss | 6,176 | 1.98% | +1.98 | |
| Independent | Daniel Clark | 1,839 | 0.59% | +0.59 | |
| Write-ins | 171 | 0.05% | −0.05 | ||
| Majority | 38,069 | 12.2% | |||
| Turnout | 312,357 | 100% | |||
| Democratic hold | Swing | +4.7 | |||
2020
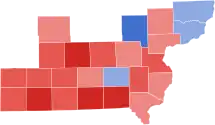
Results of the 2020 Iowa's 2nd congressional district election
| Party | Candidate | Votes | % | |
|---|---|---|---|---|
| Republican | Mariannette Miller-Meeks | 196,864 | 49.912% | |
| Democratic | Rita Hart | 196,858 | 49.910% | |
| Total votes | 394,439 | 100.0 | ||
| Republican gain from Democratic | ||||
Rita Hart announced on March 31, 2021, that she was dropping her challenge before the House Administration Committee but maintained that her attempt to contest — which she lost by six votes —was valid.[4]
Historical district boundaries
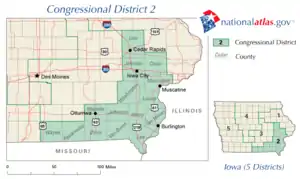
Iowa's 2nd congressional district boundaries from 2003 to 2013
References
- Center for New Media & Promotion (CNMP), US Census Bureau. "My Congressional District". www.census.gov.
- "2022 Cook PVI: District Map and List". The Cook Political Report. Retrieved January 10, 2023.
- "Iowa General Election 2018". Iowa Secretary of State. Retrieved November 11, 2018.
- Conradis, Brandon (April 1, 2021). "Republicans take victory lap after Iowa Democrat drops challenge". The Hill. Retrieved April 2, 2021.
- Martis, Kenneth C. (1989). The Historical Atlas of Political Parties in the United States Congress. New York: Macmillan Publishing Company.
- Martis, Kenneth C. (1982). The Historical Atlas of United States Congressional Districts. New York: Macmillan Publishing Company.
- Congressional Biographical Directory of the United States 1774–present
This article is issued from Wikipedia. The text is licensed under Creative Commons - Attribution - Sharealike. Additional terms may apply for the media files.
.svg.png.webp)
.jpg.webp)
.jpg.webp)
_2.jpg.webp)

.jpg.webp)
.jpg.webp)

_2.jpg.webp)
.jpg.webp)

.jpg.webp)
.jpg.webp)
.jpg.webp)

.jpg.webp)
.jpg.webp)
.jpg.webp)
.jpg.webp)


.tif.png.webp)

