Illinois's 5th congressional district
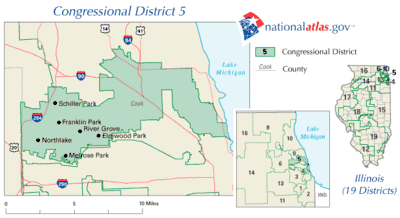
The 5th congressional district of Illinois covers parts of Cook and Lake counties, as of the 2023 redistricting which followed the 2010 census. All or parts of Chicago, Inverness, Arlington Heights, Barrington Hills, Des Plaines, Palatine, Mount Prospect, Deer Park, Kildeer, Lake Zurich, Long Grove, and North Barrington are included.
| Illinois's 5th congressional district | |||
|---|---|---|---|
Interactive map of district boundaries since January 3, 2023 | |||
| Representative |
| ||
| Area | 96 sq mi (250 km2) | ||
| Distribution |
| ||
| Population (2022) | 732,819 | ||
| Median household income | $104,191[1] | ||
| Ethnicity |
| ||
| Cook PVI | D+18[2] | ||
It has been represented by Democrat Mike Quigley since the April 2009 special election.
The district was created as part of the 28th United States Congress, which first met on March 4, 1843; it was initially represented by Stephen A. Douglas, whose Kansas–Nebraska Act prompted the creation of the Republican Party. Since the 1990s redistricting, it has covered most of Chicago's North Side; the 2010 redistricting extended it into DuPage County. It was represented by Democrat Rahm Emanuel from January 2003 until he resigned on January 2, 2009, to become White House Chief of Staff. On April 8, 2009, Mike Quigley won a special election to fill the seat.[3]
The district has a Cook Partisan Voting Index score of D +20.[4] The district and its predecessors have been in Democratic hands for all but four years since 1909. Two of those years came after Dan Rostenkowski lost his seat to Republican Michael Patrick Flanagan because of the Congressional Post Office scandal. On a national level, the scandal helped prompt the Republican Revolution of 1994. However, Flanagan was defeated after only one term by State Representative Rod Blagojevich in 1996, and no Republican has managed even 35 percent of the vote in the district since then. Blagojevich handed the seat to Emanuel in 2003.
Composition
| # | County | Seat | Population |
|---|---|---|---|
| 31 | Cook | Chicago | 5,173,146 |
| 97 | Lake | Waukegan | 711,239 |
Following the 2020 redistricting, this district will shift from a Chicago-based district to one primarily based in Cook County with a portion in southern Lake County.
The 5th district takes in the Chicago neighborhoods of Jefferson Park; the vast majority of O'Hare, Lincoln Park, Norwood Park, North Park, and Lake View; the historic North Mayfair neighborhood of Albany Park; most of Lincoln Square; and part of Irving Park.
Outside of the Chicago city limits, this district takes in the Cook County municipalities of Inverness; most of Arlington Heights and Barrington Hills; half of Des Plaines, Palatine, and Mount Prospect.
Lake County is split between this district and the 9th district. They are partitioned by the Fox River, Kelsey Rd, W Miller Rd, Echo Lake Rd, Sacomano Meadows Pond 1, Midlothian Rd, N Old Henry Rd, N Quentin Rd, Lake Zurich Rd, Twin Orchard Country Club, Mundelein Rd, Hicks Rd, Bridgewater Farm, Crossing Pond Park, and Arlington Heights Rd. The 5th district takes in the municipalities of Deer Park and Kildeer; the vast majority of Lake Zurich; the southern half of Long Grove; and the portion of North Barrington south of Miller Rd.
Presidential election results
- This table indicates how the district has voted in U.S. presidential elections; election results reflect voting in the district as it was configured at the time of the election, not as it is configured today.
| Year | Office | Results |
|---|---|---|
| 2000 | President | Al Gore 63% - George W. Bush 33% |
| 2004 | President | John Kerry 67% - George W. Bush 33% |
| 2008 | President | Barack Obama 70% - John McCain 29% |
| 2012 | President | Barack Obama 66% - Mitt Romney 32% |
| 2016 | President | Hillary Clinton 71% - Donald Trump 24% |
| 2020 | President | Joe Biden 72% - Donald Trump 26% |
Recent election results from statewide races
- This table indicates how the district has voted in recent statewide elections; election results reflect voting in the district as it is currently configured, not necessarily as it was at the time of these elections.
| Year | Office | Results |
|---|---|---|
| 2016 | President | Hillary Clinton 65.5% – Donald Trump 27.3% |
| Senate | Tammy Duckworth 58.6% – Mark Kirk 36.5% | |
| 2018 | Governor | J.B. Pritzker 61.6% – Bruce Rauner 34.5% |
| Attorney General | Kwame Raoul 62.9% – Erika Harold 34.8% | |
| Secretary of State | Jesse White 75.4% – Jason Helland 21.9% | |
| 2020 | President | Joe Biden 69.0% – Donald Trump 29.2% |
| Senate | Dick Durbin 65.2% – Mark Curran 29.2% | |
| 2022 | Senate | Tammy Duckworth 69.9% – Kathy Salvi 28.6% |
| Governor | J.B. Pritzker 69.5% – Darren Bailey 28.0% | |
| Attorney General | Kwame Raoul 68.1% – Tom DeVore 30.1% | |
| Secretary of State | Alexi Giannoulias 68.6% – Dan Brady 29.5% |
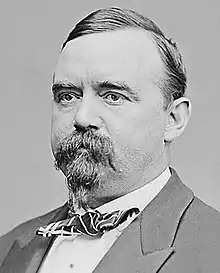
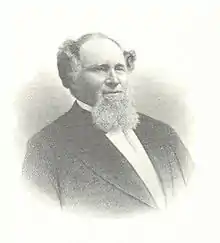
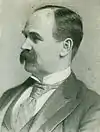
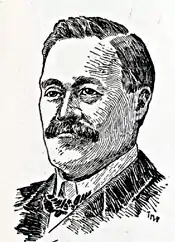
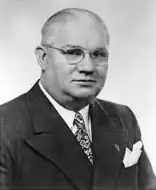
Prominent representatives
List of members representing the district
Election results
2012
| Party | Candidate | Votes | % | |
|---|---|---|---|---|
| Democratic | Mike Quigley (incumbent) | 177,729 | 65.7 | |
| Republican | Dan Schmitt | 77,289 | 28.6 | |
| Green | Nancy Wade | 15,359 | 5.7 | |
| Total votes | 270,377 | 100.0 | ||
| Democratic hold | ||||
2014
| Party | Candidate | Votes | % | |
|---|---|---|---|---|
| Democratic | Mike Quigley (incumbent) | 116,364 | 63.3 | |
| Republican | Vince Kolber | 56,350 | 30.6 | |
| Green | Nancy Wade | 11,305 | 6.1 | |
| Total votes | 184,019 | 100.0 | ||
| Democratic hold | ||||
2016
| Party | Candidate | Votes | % | |
|---|---|---|---|---|
| Democratic | Mike Quigley (incumbent) | 212,842 | 67.8 | |
| Republican | Vince Kolber | 86,222 | 27.5 | |
| Green | Rob Sherman | 14,657 | 4.7 | |
| Independent | Michael Krynski (write-in) | 3 | 0.0 | |
| Total votes | 313,724 | 100.0 | ||
| Democratic hold | ||||
2018
| Party | Candidate | Votes | % | |
|---|---|---|---|---|
| Democratic | Mike Quigley (incumbent) | 213,992 | 76.7 | |
| Republican | Tom Hanson | 65,134 | 23.3 | |
| Independent | Frank Rowder (write-in) | 5 | 0.0 | |
| Total votes | 279,131 | 100.0 | ||
| Democratic hold | ||||
2020
| Party | Candidate | Votes | % | ±% | |
|---|---|---|---|---|---|
| Democratic | Mike Quigley (incumbent) | 255,661 | 70.77 | -5.89% | |
| Republican | Tom Hanson | 96,200 | 26.63 | +3.30% | |
| Green | Thomas J. Wilda | 9,408 | 2.60 | N/A | |
| Write-in | 2 | 0.00 | N/A | ||
| Total votes | 361,271 | 100.0 | |||
| Democratic hold | |||||
2022
| Party | Candidate | Votes | % | |
|---|---|---|---|---|
| Democratic | Mike Quigley (incumbent) | 190,999 | 69.56 | |
| Republican | Tommy Hanson | 79,112 | 28.81 | |
| Independent | Jerico Matias Cruz | 4,439 | 1.61 | |
| Total votes | 274,550 | 100.0 | ||
| Democratic hold | ||||
See also
References
- "My Congressional District".
- "2022 Cook PVI: District Map and List". Cook Political Report. Retrieved January 10, 2023.
- "Topic Galleries". Chicago Tribune.
- "Cook Political Report, PVI for the 110th Congress" (PDF). Cook Political Report. Archived from the original (PDF) on November 26, 2008. Retrieved October 8, 2008.
- "2012 General Election Official Vote Totals" (PDF). Illinois State Board of Elections. Archived from the original (PDF) on November 19, 2013. Retrieved March 26, 2012.
- "Illinois General Election 2014". Illinois State Board of Elections. November 4, 2014. Archived from the original on December 15, 2014. Retrieved March 2, 2015.
- "2018 General Election Official Vote Totals Book".
- "Election Results 2020 GENERAL ELECTION". Illinois State Board of Elections. December 4, 2020. Retrieved December 4, 2020.
- "Illinois 2020 Election Results". Chicago Sun-Times. November 20, 2020. Retrieved November 20, 2020.
- Martis, Kenneth C. (1989). The Historical Atlas of Political Parties in the United States Congress. New York: Macmillan Publishing Company.
- Martis, Kenneth C. (1982). The Historical Atlas of United States Congressional Districts. New York: Macmillan Publishing Company.
- Congressional Biographical Directory of the United States 1774–present
.svg.png.webp)

.jpg.webp)
_(page_16_crop).jpg.webp)



.jpg.webp)
.jpg.webp)
.jpg.webp)
.jpg.webp)


.jpg.webp)
.jpg.webp)
.tif.png.webp)
_(new_version).svg.png.webp)