Kootenay—Columbia
Kootenay—Columbia is a federal electoral district in British Columbia, Canada, that has been represented in the House of Commons of Canada since 1997.
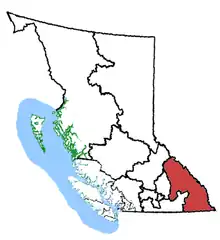 Kootenay—Columbia in relation to other British Columbia federal electoral districts | |||
| Federal electoral district | |||
| Legislature | House of Commons | ||
| MP |
Conservative | ||
| District created | 1996 | ||
| First contested | 1997 | ||
| Last contested | 2021 | ||
| District webpage | profile, map | ||
| Demographics | |||
| Population (2011)[1] | 107,589 | ||
| Electors (2019) | 91,652 | ||
| Area (km²)[1] | 64,336 | ||
| Pop. density (per km²) | 1.7 | ||
| Census subdivision(s) | Cranbrook, Revelstoke, Kimberley, East Kootenay C, Creston, Central Kootenay B, Fernie, Golden, Sparwood, Columbia-Shuswap A, Nelson | ||
Geography
Consisting of:
- (a) the Regional District of East Kootenay;
- (b) that part of the Regional District of Central Kootenay comprising:
- (c) that part of the Columbia-Shuswap Regional District comprising:
- the City of Revelstoke;
- the Town of Golden;
- subdivisions A and B; and
- (d) Tobacco Plains Indian Reserve No. 2.
The riding borders the US states of Idaho, Montana and Washington, more than any other Canadian riding.
History
This district was created in 1996 from parts of Kootenay East and Kootenay West—Revelstoke ridings.
It was amended in 2003 to include a small part of Kootenay—Boundary—Okanagan.
The 2012 federal electoral boundaries redistribution concluded that the electoral boundaries of Kootenay—Columbia should be adjusted, and a modified electoral district of the same name will be contested in future elections.[3] The redefined Kootenay—Columbia gains the communities of Nelson, Salmo and Kaslo and their respective surrounding areas from the current electoral district of British Columbia Southern Interior, while losing Nakusp and area to the new district of South Okanagan—West Kootenay and Needles and area to the new district of North Okanagan—Shuswap. These new boundaries were legally defined in the 2013 representation order, which came into effect upon the call of the 42nd Canadian federal election, scheduled for October 2015.[4]
Demographics
| Panethnic group |
2021[5] | 2016[6] | 2011[7] | |||||||||||
|---|---|---|---|---|---|---|---|---|---|---|---|---|---|---|
| Pop. | % | Pop. | % | Pop. | % | |||||||||
| European[lower-alpha 1] | 103,130 | 87.28% | 98,250 | 89.24% | 96,335 | 91.17% | ||||||||
| Indigenous | 9,040 | 7.65% | 7,865 | 7.14% | 6,305 | 5.97% | ||||||||
| South Asian | 1,570 | 1.33% | 715 | 0.65% | 705 | 0.67% | ||||||||
| East Asian[lower-alpha 2] | 1,555 | 1.32% | 1,290 | 1.17% | 1,220 | 1.15% | ||||||||
| Southeast Asian[lower-alpha 3] | 1,360 | 1.15% | 890 | 0.81% | 385 | 0.36% | ||||||||
| African | 630 | 0.53% | 460 | 0.42% | 255 | 0.24% | ||||||||
| Latin American | 455 | 0.39% | 305 | 0.28% | 165 | 0.16% | ||||||||
| Middle Eastern[lower-alpha 4] | 145 | 0.12% | 70 | 0.06% | 25 | 0.02% | ||||||||
| Other[lower-alpha 5] | 270 | 0.23% | 255 | 0.23% | 245 | 0.23% | ||||||||
| Total responses | 118,155 | 97.84% | 110,095 | 97.99% | 105,660 | 98.21% | ||||||||
| Total population | 120,759 | 100% | 112,354 | 100% | 107,589 | 100% | ||||||||
| Notes: Totals greater than 100% due to multiple origin responses. Demographics based on 2012 Canadian federal electoral redistribution riding boundaries. | ||||||||||||||
Members of Parliament
This riding has elected the following Member of Parliament:
| Parliament | Years | Member | Party | |
|---|---|---|---|---|
| Kootenay—Columbia Riding created from Kootenay East and Kootenay West—Revelstoke |
||||
| 36th | 1997–2000 | Jim Abbott | Reform | |
| 2000–2000 | Alliance | |||
| 37th | 2000–2003 | |||
| 2003–2004 | Conservative | |||
| 38th | 2004–2006 | |||
| 39th | 2006–2008 | |||
| 40th | 2008–2011 | |||
| 41st | 2011–2015 | David Wilks | ||
| 42nd | 2015–2019 | Wayne Stetski | New Democratic | |
| 43rd | 2019–2021 | Rob Morrison | Conservative | |
| 44th | 2021–present | |||
Current Member of Parliament
Its Member of Parliament (MP) is Rob Morrison, first elected in 2019 as a Conservative candidate.
Election results
| 2021 Canadian federal election | ||||||||
|---|---|---|---|---|---|---|---|---|
| Party | Candidate | Votes | % | ±% | Expenditures | |||
| Conservative | Rob Morrison | 28,056 | 43.2 | -1.6 | $110,837.35 | |||
| New Democratic | Wayne Stetski | 23,986 | 36.9 | +2.5 | $127,647.85 | |||
| Liberal | Robin Goldsbury | 5,879 | 9.0 | -0.1 | $10,113.73 | |||
| People's | Sarah Bennett | 4,467 | 6.9 | +4.8 | $0.00 | |||
| Green | Rana Nelson | 2,577 | 4.0 | -5.1 | $6,932.17 | |||
| Total valid votes/Expense limit | 64,965 | 99.5 | – | $152,723.52 | ||||
| Total rejected ballots | 317 | 0.5 | ||||||
| Turnout | 65,282 | 68.4 | ||||||
| Eligible voters | 95,518 | |||||||
| Conservative hold | Swing | -2.1 | ||||||
| Source: Elections Canada[8] | ||||||||
| 2019 Canadian federal election | ||||||||
|---|---|---|---|---|---|---|---|---|
| Party | Candidate | Votes | % | ±% | Expenditures | |||
| Conservative | Rob Morrison | 30,168 | 44.81 | +8.03 | $100,780.99 | |||
| New Democratic | Wayne Stetski | 23,149 | 34.38 | -2.84 | $91,351.20 | |||
| Liberal | Robin Goldsbury | 6,151 | 9.14 | -10.35 | none listed | |||
| Green | Abra Brynne | 6,145 | 9.13 | +2.62 | $17,085.86 | |||
| People's | Rick Stewart | 1,378 | 2.05 | - | none listed | |||
| Animal Protection | Trev Miller | 339 | 0.50 | - | $1,850.63 | |||
| Total valid votes/expense limit | 67,330 | 99.61 | ||||||
| Total rejected ballots | 266 | 0.39 | +0.08 | |||||
| Turnout | 67,596 | 72.68 | -0.28 | |||||
| Eligible voters | 93,002 | |||||||
| Conservative gain from New Democratic | Swing | +5.44 | ||||||
| Source: Elections Canada[9][10] | ||||||||
| 2015 Canadian federal election | ||||||||
|---|---|---|---|---|---|---|---|---|
| Party | Candidate | Votes | % | ±% | Expenditures | |||
| New Democratic | Wayne Stetski | 23,529 | 37.23 | -1.62 | $90,414.74 | |||
| Conservative | David Wilks | 23,247 | 36.78 | -13.31 | $108,293.89 | |||
| Liberal | Don Johnston | 12,315 | 19.48 | +16.00 | $11,677.75 | |||
| Green | Bill Green | 4,115 | 6.51 | +0.08 | $43,921.84 | |||
| Total valid votes/expense limit | 63,206 | 99.69 | $279,227.99 | |||||
| Total rejected ballots | 197 | 0.31 | – | |||||
| Turnout | 63,403 | 72.97 | – | |||||
| Eligible voters | 86,895 | |||||||
| New Democratic gain from Conservative | Swing | +5.84 | ||||||
| Source: Elections Canada[11][12] | ||||||||
| 2011 federal election redistributed results[13] | |||
|---|---|---|---|
| Party | Vote | % | |
| Conservative | 26,447 | 50.09 | |
| New Democratic | 20,510 | 38.84 | |
| Green | 3,395 | 6.43 | |
| Liberal | 1,841 | 3.49 | |
| Others | 610 | 1.16 | |
| 2011 Canadian federal election | ||||||||
|---|---|---|---|---|---|---|---|---|
| Party | Candidate | Votes | % | ±% | ||||
| Conservative | David Wilks | 23,910 | 55.88 | -3.71 | ||||
| New Democratic | Mark Shmigelsky | 14,199 | 33.18 | +10.54 | ||||
| Green | William Green | 2,547 | 5.95 | -4.06 | ||||
| Liberal | Betty Aitchison | 1,496 | 3.50 | -4.25 | ||||
| Independent | Brent Bush | 636 | 1.49 | – | ||||
| Total valid votes | 42,788 | 99.67 | ||||||
| Total rejected ballots | 142 | 0.33 | -0.00 | |||||
| Turnout | 42,930 | 63.45 | +3.69 | |||||
| Eligible voters | 67,663 | |||||||
| Conservative hold | Swing | -7.13 | ||||||
| 2008 Canadian federal election | ||||||||
|---|---|---|---|---|---|---|---|---|
| Party | Candidate | Votes | % | ±% | Expenditures | |||
| Conservative | Jim Abbott | 23,402 | 59.59 | +5.24 | $53,536 | |||
| New Democratic | Leon R. Pendleton | 8,892 | 22.64 | -3.23 | ||||
| Green | Ralph Moore | 3,933 | 10.01 | +3.91 | $1,084 | |||
| Liberal | Betty Aitchison | 3,044 | 7.75 | -5.98 | $1,960 | |||
| Total valid votes/expense limit | 39,271 | 100.0 | $99,498 | |||||
| Total rejected ballots | 131 | 0.3 | ||||||
| Turnout | 39,402 | 59.76 | ||||||
| Conservative hold | Swing | +4.24 | ||||||
| 2006 Canadian federal election | ||||||||
|---|---|---|---|---|---|---|---|---|
| Party | Candidate | Votes | % | ±% | Expenditures | |||
| Conservative | Jim Abbott | 22,181 | 54.35 | +2.33 | $76,689 | |||
| New Democratic | Brent Bush | 10,560 | 25.87 | +2.05 | $20,927 | |||
| Liberal | Jhim Burwell | 5,443 | 13.33 | -4.59 | $8,240 | |||
| Green | Clements Verhoeven | 2,490 | 6.10 | -0.13 | $3,632 | |||
| Canadian Action | Thomas Frederick Sima | 132 | 0.32 | – | $0 | |||
| Total valid votes | 40,806 | 100.0 | ||||||
| Total rejected ballots | 129 | 0.3 | ||||||
| Turnout | 40,935 | 64.39 | -0.3 | |||||
| Conservative hold | Swing | +0.14 | ||||||
| 2004 Canadian federal election | ||||||||
|---|---|---|---|---|---|---|---|---|
| Party | Candidate | Votes | % | ±% | Expenditures | |||
| Conservative | Jim Abbott | 21,336 | 52.02 | -21.48 | $89,327 | |||
| New Democratic | Brent Bush | 9,772 | 23.82 | +15.11 | $32,311 | |||
| Liberal | Ross Priest | 7,351 | 17.92 | +3.18 | $36,595 | |||
| Green | Carmen Gustafson | 2,558 | 6.23 | +3.17 | ||||
| Total valid votes | 41,017 | 100.0 | ||||||
| Total rejected ballots | 130 | 0.3 | ||||||
| Turnout | 41,147 | 65.1 | ||||||
| Conservative hold | Swing | -18.30 | ||||||
| Conservative vote is compared to the total of the Canadian Alliance vote and Progressive Conservative vote in 2000 election. | ||||||||
| 2000 Canadian federal election | ||||||||
|---|---|---|---|---|---|---|---|---|
| Party | Candidate | Votes | % | ±% | Expenditures | |||
| Alliance | Jim Abbott | 25,663 | 67.78 | +5.87 | $62,316 | |||
| Liberal | Delvin R. Chatterson | 5,581 | 14.74 | -2.89 | $18,971 | |||
| New Democratic | Andrea Dunlop | 3,297 | 8.71 | -5.49 | $3,732 | |||
| Progressive Conservative | Jerry Pirie | 2,165 | 5.72 | +1.63 | $340 | |||
| Green | Jubilee Rose Cacaci | 1,158 | 3.06 | +0.89 | ||||
| Total valid votes | 37,864 | 100.0 | ||||||
| Total rejected ballots | 139 | 0.4 | ||||||
| Turnout | 38,003 | 65.2 | +0.3 | |||||
| Alliance hold | Swing | +4.38 | ||||||
| Canadian Alliance vote is compared to the Reform vote in 1997 election. | ||||||||
| 1997 Canadian federal election | ||||||||
|---|---|---|---|---|---|---|---|---|
| Party | Candidate | Votes | % | Expenditures | ||||
| Reform | Jim Abbott | 22,387 | 61.91 | $49,956 | ||||
| Liberal | Mark Shmigelsky | 6,373 | 17.63 | $28,560 | ||||
| New Democratic | Greg Edwards | 5,133 | 14.20 | $29,778 | ||||
| Progressive Conservative | Mark Palmer | 1,479 | 4.09 | $322 | ||||
| Green | Anna Rowe | 786 | 2.17 | |||||
| Total valid votes | 36,158 | 100.0 | ||||||
| Total rejected ballots | 131 | 0.4 | ||||||
| Turnout | 36,289 | 64.9 | ||||||
| This riding was created from parts of Kootenay East and Kootenay West—Revelstoke, both of which elected Reform candidates in the previous election. Jim Abbott was the incumbent from Kootenay East. | ||||||||
Adjacent ridings
See also
Notes
- Statistic includes all persons that did not make up part of a visible minority or an indigenous identity.
- Statistic includes total responses of "Chinese", "Korean", and "Japanese" under visible minority section on census.
- Statistic includes total responses of "Filipino" and "Southeast Asian" under visible minority section on census.
- Statistic includes total responses of "West Asian" and "Arab" under visible minority section on census.
- Statistic includes total responses of "Visible minority, n.i.e." and "Multiple visible minorities" under visible minority section on census.
References
- Statistics Canada: 2012
- "Kootenay-Columbia". Elections Canada. Retrieved July 3, 2015.
- "Final Report – British Columbia", Redecoupage-federal-redistribution.ca, retrieved July 11, 2017
- "Timeline for the Redistribution of Federal Electoral Districts", Redecoupage-federal-redistribution.ca, retrieved July 11, 2017
- Government of Canada, Statistics Canada (October 26, 2022). "Census Profile, 2021 Census of Population". www12.statcan.gc.ca. Retrieved February 14, 2023.
- Government of Canada, Statistics Canada (October 27, 2021). "Census Profile, 2016 Census". www12.statcan.gc.ca. Retrieved February 14, 2023.
- Government of Canada, Statistics Canada (November 27, 2015). "NHS Profile". www12.statcan.gc.ca. Retrieved February 14, 2023.
- "List of confirmed candidates – September 20, 2021 Federal Election". Elections Canada. Retrieved September 2, 2021.
- "List of confirmed candidates". Elections Canada. Retrieved October 4, 2019.
- "Official Voting Results". Elections Canada. Retrieved June 2, 2021.
- "Voter Information Service - Find your electoral district". Elections.ca. Retrieved July 11, 2017.
- "Elections Canada Online | Preliminary Candidates Election Expenses Limits". Web.archive.org. Archived from the original on August 15, 2015. Retrieved July 11, 2017.
{{cite web}}: CS1 maint: bot: original URL status unknown (link) - "Kootenay—Columbia, BC (2013 Rep. Order) ›› Pundits' Guide". Archived from the original on October 1, 2015. Retrieved September 25, 2015.
External links
- Website of the Parliament of Canada
- Website of the Local Riding Association - Conservative Party of Canada
- "Kootenay—Columbia (Code 59012) Census Profile". 2011 census. Government of Canada - Statistics Canada. Retrieved March 6, 2011.
- Library of Parliament Riding Profile
- Campaign expense data from Elections Canada – 2008
- Expenditures - 2004
- Expenditures – 2000
- Expenditures – 1997
- "Final Report – British Columbia - Redistribution Federal Electoral Districts". Redecoupage-federal-redistribution.ca. Retrieved July 11, 2017.
- "Kootenay—Columbia – Commission's Report - Redistribution Federal Electoral Districts". Redecoupage-federal-redistribution.ca. Retrieved July 11, 2017.