Louisiana's 1st congressional district
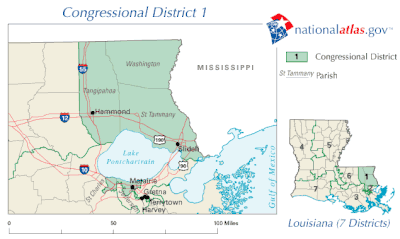
Louisiana's 1st congressional district is a congressional district in the U.S. state of Louisiana. The district comprises land from the northern shore of Lake Pontchartrain south to the Mississippi River delta. It covers most of New Orleans' suburbs, as well as a sliver of New Orleans itself.
| Louisiana's 1st congressional district | |||
|---|---|---|---|
Interactive map of district boundaries since January 3, 2023 | |||
| Representative |
| ||
| Distribution |
| ||
| Population (2022) | 775,766[2] | ||
| Median household income | $69,732[2] | ||
| Ethnicity |
| ||
| Cook PVI | R+23[3] | ||
The district is currently represented by Republican House majority leader Steve Scalise. With a Cook Partisan Voting Index rating of R+22, it is the most Republican district in Louisiana.[3]
History
Prior to 1974, the 1st congressional district was entirely south of Lake Pontchartrain. As a result of population changes reflected in the 1970 U.S. Census and a concern to ensure that the 2nd congressional district was majority African American, the district was redrawn to include the Northshore. This was done to comply with the Voting Rights Act, passed in 1965 to enforce constitutional rights of minorities in voting, including the opportunity to elect a representative of their choosing and to redistrict after censuses.
In 1974, the state legislature redefined the 1st congressional district, dropping its precincts south of the lake and adding St. Tammany Parish, which borders Lake Pontchartrain on the north, from the 6th congressional district. Subsequently, the 1st congressional district acquired Tangipahoa and Washington parishes, both north of the lake, from the 6th congressional district.
Correspondingly, the 1st congressional district shed conservative St. Bernard Parish and other areas south of the lake to the 3rd congressional district from 1984 through 2013. Overall, the 1st congressional district has become a very safe district for the Republican Party.[4] Before the 1960s, it was controlled by Democrats, but conservative whites realigned with the Republican Party.
The number of registered voters north of the lake is, as of 2008, slightly higher than south of the lake; however, the 1st congressional district has yet to be represented by a resident from north of Lake Pontchartrain.[5] The reformulation of the 1st congressional district so that it virtually surrounds "the nation's second-largest saltwater lake" has generated a local joke that in the 1st congressional district of Louisiana, the voters are outnumbered by the fish.
The seat was previously held by former governor Bobby Jindal, who was elected after David Vitter retired to successfully run for the U.S. Senate. Republicans have held the seat since 1977. That year Bob Livingston won a special election after Richard A. Tonry, who won the seat in 1976, was forced to resign the seat and lost the Democratic primary in the special election.
From 2003 to 2013, the district comprised mostly land on the North Shore and South Shore of Lake Pontchartrain, although it also contained areas west of Lake Pontchartrain. The district included some or all of the following parishes: Washington, St. Tammany, Tangipahoa, Jefferson, Orleans and St. Charles. It also included the cities of Hammond and Slidell and most of the western suburbs of New Orleans, including Metairie and Kenner, along with a small portion of the city itself. The district had the lowest percentage of African-American residents among the state's six-district Congressional delegation.
In 2013, St. Bernard and neighboring Plaquemines Parishes were returned to the first district after nearly 30 years in the Third. The First also picked up much of Lafourche Parish and the southernmost portion of Terrebonne Parish for the first time.
Recent presidential elections
| Election results from presidential races | ||
|---|---|---|
| Year | Office | Results |
| 2000 | President | Bush 67–31% |
| 2004 | President | Bush 71–28% |
| 2008 | President | McCain 73–26% |
| 2012 | President | Romney 71–27% |
| 2016 | President | Trump 69–27% |
| 2020 | President | Trump 68–30% |
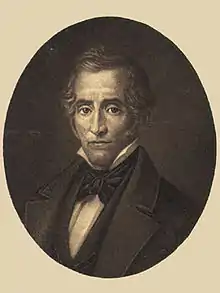
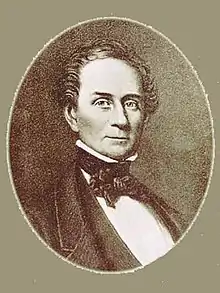
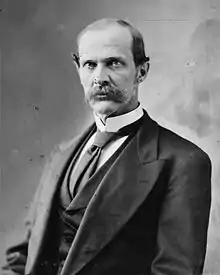
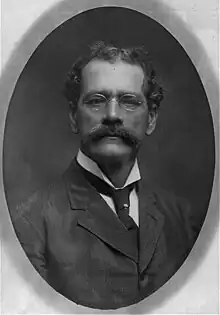
List of members representing the district
- He was elected along with Michael Hahn, assuming the seat left vacant after J. E. Bouligny's term expired in 1861. Flanders and Hahn were not seated in Congress until the last fifteen days of their terms in February 1863.
- There were so many irregularities in the 1868 election that Congress threw it out. Sypher won the second round.
- Sypher's 1872 re-election was successfully contested by Effingham Lawrence. Sypher lost, but only after the original returns were certified in his favor. After protracted court intervention, Lawrence was declared elected, but just one day (March 3, 1875) remained in the term, and in the meantime Lawrence had lost the 1874 election to Democrat Randall Lee Gibson.
Recent election results
2002
| Party | Candidate | Votes | % | |
|---|---|---|---|---|
| Republican | David Vitter (Incumbent) | 147,117 | 81.47 | |
| Republican | Monica L. Monica | 20,268 | 11.22 | |
| Republican | Robert Namer | 7,229 | 4.00 | |
| Libertarian | Ian P. Hawxhurst | 5,956 | 3.30 | |
| Total votes | 180,570 | 100.00 | ||
| Republican hold | ||||
2004
| Party | Candidate | Votes | % | |
|---|---|---|---|---|
| Republican | Bobby Jindal | 225,708 | 78.40 | |
| Democratic | Roy Armstrong | 19,266 | 6.69 | |
| Democratic | Vinny Mendoza | 12,779 | 4.44 | |
| Democratic | Daniel Zimmerman | 12,135 | 4.22 | |
| Democratic | Jerry Watts | 10,034 | 3.49 | |
| Republican | Mike Rogers | 7,975 | 2.77 | |
| Total votes | 287,897 | 100.00 | ||
| Republican hold | ||||
2006
| Party | Candidate | Votes | % | |
|---|---|---|---|---|
| Republican | Bobby Jindal (Incumbent) | 130,508 | 88.11 | |
| Democratic | David Gereighty | 10,919 | 7.37 | |
| Democratic | Stacey Tallitsch | 5,025 | 3.39 | |
| Libertarian | Peter L. Beary | 1,676 | 1.13 | |
| Total votes | 148,128 | 100.00 | ||
| Republican hold | ||||
2008
| Party | Candidate | Votes | % | |
|---|---|---|---|---|
| Republican | Steve Scalise | 33,867 | 75.14 | |
| Democratic | Gilda Reed | 10,142 | 22.50 | |
| Independent | R.A. "Skip" Galan | 786 | 1.74 | |
| Independent | Anthony Gentile | 280 | 0.62 | |
| Total votes | 45,075 | 100.00 | ||
| Republican hold | ||||
| Party | Candidate | Votes | % | |
|---|---|---|---|---|
| Republican | Steve Scalise (Incumbent) | 189,168 | 65.68 | |
| Democratic | Jim Harlan | 98,839 | 34.32 | |
| Total votes | 288,007 | 100.00 | ||
| Republican hold | ||||
2010
| Party | Candidate | Votes | % | |
|---|---|---|---|---|
| Republican | Steve Scalise (Incumbent) | 157,182 | 78.52 | |
| Democratic | Myron Katz | 38,416 | 19.19 | |
| Independent | Arden Wells | 4,578 | 2.29 | |
| Total votes | 200,176 | 100.00 | ||
| Republican hold | ||||
2012
| Party | Candidate | Votes | % | |
|---|---|---|---|---|
| Republican | Steve Scalise (Incumbent) | 193,496 | 66.63 | |
| Democratic | Vinny Mendoza | 61,703 | 21.25 | |
| Republican | Gary King | 24,844 | 8.55 | |
| Independent | David Turknett | 6,079 | 2.09 | |
| Independent | Arden Wells | 4,578 | 1.48 | |
| Total votes | 290,410 | 100.00 | ||
| Republican hold | ||||
2014
| Party | Candidate | Votes | % | |
|---|---|---|---|---|
| Republican | Steve Scalise (Incumbent) | 189,250 | 77.56 | |
| Democratic | Vinny Mendoza | 24,761 | 10.15 | |
| Democratic | Lee Dugas | 21,286 | 8.72 | |
| Libertarian | Jeff Sanford | 8,707 | 3.57 | |
| Total votes | 244,004 | 100.00 | ||
| Republican hold | ||||
2016
| Party | Candidate | Votes | % | |
|---|---|---|---|---|
| Republican | Steve Scalise (Incumbent) | 243,645 | 74.56 | |
| Democratic | Lee Ann Dugas | 41,840 | 12.80 | |
| Democratic | Danil Faust | 12,708 | 3.89 | |
| Libertarian | Howard Kearney | 9,405 | 2.88 | |
| Democratic | Joe Swider | 9,237 | 2.83 | |
| Green | Eliot Barron | 6,717 | 2.06 | |
| Independent | Chuemal Yang | 3,236 | 0.99 | |
| Total votes | 326,788 | 100.00 | ||
| Republican hold | ||||
2018
| Party | Candidate | Votes | % | |
|---|---|---|---|---|
| Republican | Steve Scalise (Incumbent) | 192,526 | 71.5 | |
| Democratic | Tammy Savoie | 44,262 | 16.4 | |
| Democratic | Lee Ann Dugas | 18,552 | 6.9 | |
| Democratic | Jim Francis | 8,685 | 3.2 | |
| Libertarian | Howard Kearney | 2,806 | 1.0 | |
| Independent | Frederick "Ferd" Jones | 2,442 | 0.9 | |
| Total votes | 269,325 | 100.0 | ||
| Republican hold | ||||
2020
| Party | Candidate | Votes | % | |
|---|---|---|---|---|
| Republican | Steve Scalise (incumbent) | 270,330 | 72.21 | |
| Democratic | Lee Ann Dugas | 94,730 | 25.30 | |
| Libertarian | Howard Kearney | 9,309 | 2.49 | |
| Total votes | 374,369 | 100.0 | ||
| Republican hold | ||||
2022
| Party | Candidate | Votes | % | ||
|---|---|---|---|---|---|
| Republican | Steve Scalise (incumbent) | 177,670 | 72.8 | ||
| Democratic | Katie Darling | 61,467 | 25.2 | ||
| Libertarian | Howard Kearney | 4,907 | 2.0 | ||
| Total votes | 244,044 | 100.0 | |||
| Republican hold | |||||
References
- "Congressional Districts Relationship Files (State-based)". U.S. Census Bureau. Archived from the original on April 2, 2013. Retrieved February 7, 2018.
- "My Congressional District".
- "2022 Cook PVI: District Map and List". Cook Political Report. Retrieved January 10, 2023.
- Cook Partisan Voting Index
- Several residents of the northlake area (eastern Florida Parishes) served in Congress to represent the 6th congressional district before it ceded territory to the 1st congressional district.
- Martis, Kenneth C. (1989). The Historical Atlas of Political Parties in the United States Congress. New York: Macmillan Publishing Company.
- Martis, Kenneth C. (1982). The Historical Atlas of United States Congressional Districts. New York: Macmillan Publishing Company.
- Congressional Biographical Directory of the United States 1774–present
_(square).svg.png.webp)


.jpg.webp)

.png.webp)


.jpg.webp)
.png.webp)

.jpg.webp)


.jpg.webp)
.tif.png.webp)
.svg.png.webp)