List of Indian states and union territories by GDP
These are lists of Indian states and union territories by their nominal gross state domestic product (GSDP). GSDP is the sum of all value added by industries within each state or union territory and serves as a counterpart to the national gross domestic product (GDP).[1]
In India, the Government accounts for around 21% of the GDP, agriculture accounts for 21%, the corporate sector accounts for 12% and the balance 48% of the GDP is sourced from small proprietorship and partnership companies, unorganized sector and households.[2]
_vs_State_UT_(1).png.webp)
_vs_State_UT_(2).png.webp)
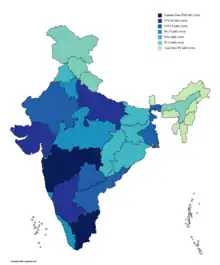
The following list gives the latest available gross state domestic product (GSDP) figures for all Indian States and Union Territories at current prices in millions or trillions of Indian rupees. No data is available for the union territories of Dadra and Nagar Haveli and Daman and Diu, Ladakh and Lakshadweep.
List
| State/union territory | GSDP (₹ millions) | GSDP (US$ billions) |
|---|---|---|
| Maharashtra * | 28,185,545.7 | 350 |
| Tamil Nadu * | 17,972,287.2 | 230 |
| Uttar Pradesh * | 16,878,179.9 | 210 |
| Gujarat * | 16,302,401.2 | 200 |
| Karnataka * | 16,289,279.3 | 200 |
| Bengal * | 12,078,226.1 | 150 |
| Rajasthan * | 9,989,991.1 | 130 |
| Andhra | 9,712,242.2 | 120 |
| Telangana * | 9,572,071.0 | 120 |
| Madhya Pradesh * | 9,374,051.8 | 120 |
| Kerala * | 8,546,889.9 | 110 |
| Delhi * | 8,308,724.9 | 100 |
| Haryana * | 7,806,123.5 | 98 |
| Bihar * | 5,940,164.0 | 74 |
| Odisha * | 5,479,590.8 | 69 |
| Punjab * | 5,396,865.5 | 68 |
| Chhattisgarh * | 3,449,553.5 | 43 |
| Assam * | 3,352,381.1 | 42 |
| Jharkhand * | 3,211,573.1 | 40 |
| Uttarakhand * | 2,536,662.5 | 32 |
| Jammu and Kashmir * | 1,703,821.1 | 21 |
| Himachal * | 1,628,159.3 | 20 |
| Goa * | 748,283.7 | 9.4 |
| Tripura * | 558,569.4 | 7.0 |
| Chandigarh * | 436,743.4 | 5.5 |
| Puducherry * | 380,036.9 | 4.8 |
| Meghalaya * | 347,157.0 | 4.3 |
| Manipur * | 317,903.0 | 4.0 |
| Sikkim * | 308,089.9 | 3.9 |
| Nagaland * | 295,359.3 | 3.7 |
| Arunachal | 280,461.3 | 3.5 |
| Mizoram * | 251,485.7 | 3.1 |
| Andaman and Nicobar Islands * | 97,192.3 | 1.2 |
| Zonal councils | Nominal GDP (est) | Population (2023) (est) | |
|---|---|---|---|
| (₹ trillions) | (US$ billions) | ||
| Southern | 74.16 | 995 | 273,692,000 |
| Western | 51.98 | 698 | 200,730,000 |
| Northern | 40.17 | 539 | 185,925,000 |
| Central | 36.98 | 496 | 364,083,000 |
| Eastern | 31.89 | 428 | 311,582,000 |
| North-Eastern | 6.73 | 90 | 50,592,000 |
| India | 241.90 | 3,250 | 1,386,604,000 |
Nominal GSDP from 2011–12 to 2020–21
The following table shows the annual growth in nominal GSDP for the financial years 2011–12 to 2020–21, from the Ministry of Statistics and Programme Implementation.[6][7] Revised data for the past years differ from the tables below.[8] Figures are in millions of Indian rupees at current prices.[1] No data was available for the union territories of Dadra and Nagar Haveli, Daman and Diu and Lakshadweep.
| State/union territory | 2011–12 | 2012–13 | 2013–14 | 2014–15 | 2015–16 | 2016–17 | 2017–18 | 2018–19 | 2019–20 | 2020–21 |
|---|---|---|---|---|---|---|---|---|---|---|
| Andhra | 3,794,020 | 4,114,040 | 4,642,720 | 5,249,760 | 6,042,290 | 6,975,080 | 8,095,470 | 9,334,020 | 10,806,570 | – |
| Arunachal | 110,630 | 125,470 | 145,810 | 179,590 | 185,090 | 196,270 | 220,450 | – | – | – |
| Assam * | 1,431,750 | 1,568,640 | 1,777,450 | 1,957,230 | 2,279,590 | 2,544,780 | 2,884,940 | 3,329,390 | 3,740,960 | 4,086,270 |
| Bihar * | 2,471,440 | 2,823,680 | 3,171,010 | 3,429,510 | 3,716,020 | 4,223,160 | 4,847,400 | 5,574,900 | 5,728,270 | – |
| Chhattisgarh * | 1,580,740 | 1,775,110 | 2,068,330 | 2,211,180 | 2,273,830 | 2,547,220 | 2,841,940 | 3,116,600 | 3,639,000 | – |
| Goa * | 423,670 | 381,200 | 359,210 | 478,140 | 550,540 | 634,600 | 704,930 | 771,720 | – | – |
| Gujarat * | 6,156,060 | 7,244,950 | 8,076,230 | 9,217,730 | 10,290,100 | 11,533,270 | 13,146,800 | 14,990,130 | 17,014,950 | 17,780,000 |
| Haryana * | 2,975,390 | 3,470,320 | 3,992,680 | 4,371,450 | 4,952,490 | 5,563,250 | 6,260,540 | 7,071,260 | 7,849,100 | – |
| Himachal * | 727,200 | 828,200 | 947,640 | 1,037,720 | 1,142,390 | 1,256,340 | 1,406,130 | 1,531,810 | 1,689,720 | – |
| Jammu and Kashmir (state) * | 782,560 | 871,380 | 956,190 | 983,700 | 1,171,680 | 1,253,790 | 1,384,880 | – | – | – |
| Jharkhand * | 1,509,180 | 1,747,240 | 1,885,670 | 2,185,250 | 2,066,130 | 2,362,500 | 2,762,430 | 3,075,810 | 3,297,260 | 3,832,330 |
| Karnataka * | 6,060,480 | 6,954,130 | 8,166,660 | 9,139,230 | 10,451,680 | 12,091,360 | 13,502,570 | 15,352,240 | 15,883,030 | 18,036,090 |
| Kerala * | 3,640,480 | 4,123,130 | 4,650,410 | 5,125,640 | 5,619,940 | 6,348,860 | 7,015,770 | 7,816,530 | 8,755,140 | 9,780,640 |
| Madhya Pradesh * | 3,155,620 | 3,809,250 | 4,394,830 | 4,799,390 | 5,411,890 | 6,488,490 | 7,282,420 | 8,093,270 | 9,066,720 | 9,175,550 |
| Maharashtra * | 12,803,690 | 14,596,290 | 16,496,470 | 17,791,380 | 19,661,470 | 21,885,320 | 24,116,000 | 26,565,510 | 29,795,560 | 30,790,860 |
| Manipur * | 129,150 | 137,430 | 161,820 | 181,290 | 195,310 | 212,940 | 239,680 | – | – | – |
| Meghalaya * | 199,180 | 218,720 | 229,380 | 232,350 | 251,170 | 274,390 | 307,900 | – | – | – |
| Mizoram * | 72,590 | 83,620 | 102,930 | 135,090 | 151,390 | 171,920 | 194,570 | – | – | – |
| Nagaland * | 121,770 | 141,210 | 166,120 | 184,010 | 195,240 | 217,220 | 242,810 | – | – | – |
| Odisha * | 2,309,870 | 2,617,000 | 2,964,750 | 3,142,500 | 3,285,500 | 3,938,080 | 4,363,740 | 4,853,760 | 5,408,120 | – |
| Punjab * | 2,666,280 | 2,977,340 | 3,321,470 | 3,551,020 | 3,900,870 | 4,269,880 | 4,791,410 | 5,218,610 | 5,778,290 | – |
| Rajasthan * | 4,348,370 | 4,935,510 | 5,610,310 | 6,156,420 | 6,814,850 | 7,588,090 | 8,355,580 | 9,291,240 | – | – |
| Sikkim * | 111,650 | 123,380 | 138,620 | 154,070 | 180,340 | 206,870 | 234,950 | 267,860 | – | – |
| Tamil Nadu * | 7,514,860 | 8,548,250 | 9,685,300 | 10,726,780 | 11,765,000 | 13,026,390 | 14,618,410 | 16,641,590 | 18,542,390 | 21,240,000 |
| Telangana * | 3,594,340 | 4,015,940 | 4,515,800 | 5,058,490 | 5,779,020 | 6,590,330 | 7,538,110 | 8,656,880 | 9,696,040 | – |
| Tripura * | 192,080 | 216,630 | 255,930 | 295,330 | 359,380 | 396,120 | 461,330 | – | – | – |
| Uttar Pradesh * | 7,240,500 | 8,223,930 | 9,403,560 | 10,117,900 | 11,372,100 | 12,483,740 | 13,763,240 | 15,424,320 | 17,910,000 | 19,480,000 |
| Uttarakhand * | 1,153,280 | 1,316,130 | 1,490,740 | 1,614,390 | 1,771,630 | 1,951,250 | 2,228,360 | 2,458,950 | 2,632,330 | – |
| Bengal * | 5,204,850 | 5,914,640 | 6,768,480 | 7,180,820 | 7,973,000 | 8,725,270 | 9,995,850 | 11,775,860 | 13,145,290 | 14,440,000[9] |
| Andaman and Nicobar Islands * | 39,780 | 44,210 | 50,230 | 54,770 | 60,320 | 68,360 | 78,710 | – | – | – |
| Chandigarh * | 187,680 | 216,090 | 248,220 | 265,490 | 292,800 | 327,410 | 388,060 | – | – | – |
| Delhi * | 3,437,980 | 3,913,880 | 4,439,600 | 4,948,030 | 5,508,040 | 6,156,050 | 6,900,980 | 7,796,520 | 8,308,720 | 7,983,090 |
| Puducherry * | 168,180 | 188,750 | 218,700 | 225,740 | 266,170 | 295,730 | 329,620 | 366,560 | – | – |
| India * | 87,360,390 | 99,466,360 | 112,366,350 | 124,337,490 | 136,753,310 | 152,510,280 | 170,950,050 | 190,101,640 | – | – |
Nominal GDDP from 2001–02 to 2010–11
The following table shows the annual growth in nominal GSDP for the financial years 2001–02 to 2010–11, released by the Planning Commission of India, in the Indian rupees.[1]
Revised data for the past years differ from the tables below. Figures are in millions of Indian rupees at current prices.[1] No data was available for the union territories of Dadra and Nagar Haveli, Daman and Diu and Lakshadweep.
| State/union territory | 2001–02 | 2002–03 | 2003–04 | 2004–05 | 2005–06 | 2006–07 | 2007–08 | 2008–09 | 2009–10 | 2010–11 |
|---|---|---|---|---|---|---|---|---|---|---|
| Andhra | 1,567,110 | 1,670,960 | 1,900,170 | 2,247,130 | 2,559,410 | 3,010,350 | 3,648,130 | 4,267,650 | 4,768,350 | 5,837,620 |
| Arunachal | 21,040 | 20,710 | 23,680 | 34,880 | 37,550 | 41,080 | 48,100 | 56,870 | 74,740 | 90,130 |
| Assam * | 383,130 | 434,070 | 473,050 | 533,980 | 593,850 | 646,920 | 710,760 | 810,740 | 959,750 | 1,126,880 |
| Bihar * | 576,570 | 649,650 | 661,740 | 777,810 | 824,900 | 1,007,370 | 1,136,800 | 1,422,790 | 1,629,230 | 2,042,890 |
| Chhattisgarh * | 295,390 | 324,930 | 388,020 | 478,620 | 533,810 | 668,750 | 802,550 | 969,720 | 993,640 | 1,194,200 |
| Goa * | 70,970 | 81,000 | 93,010 | 127,130 | 143,270 | 165,230 | 195,650 | 254,140 | 291,260 | 336,050 |
| Gujarat * | 1,235,730 | 1,415,340 | 1,680,800 | 2,033,730 | 2,447,360 | 2,836,930 | 3,292,850 | 3,679,120 | 4,312,620 | 5,215,190 |
| Haryana * | 655,050 | 725,280 | 828,620 | 957,950 | 1,088,850 | 1,287,320 | 1,515,960 | 1,825,220 | 2,236,000 | 2,606,210 |
| Himachal * | 171,480 | 189,050 | 207,210 | 240,770 | 271,270 | 302,740 | 339,630 | 414,830 | 481,890 | 574,520 |
| Jammu and Kashmir (state) * | 180,390 | 203,260 | 221,940 | 273,050 | 299,200 | 332,300 | 370,990 | 423,150 | 483,850 | 580,730 |
| Jharkhand * | 350,690 | 379,670 | 424,490 | 597,580 | 609,010 | 669,350 | 839,500 | 877,940 | 1,006,210 | 1,272,810 |
| Karnataka * | 1,128,470 | 1,208,890 | 1,309,900 | 1,667,470 | 1,959,040 | 2,272,370 | 2,706,290 | 3,103,120 | 3,375,590 | 4,107,030 |
| Kerala * | 779,240 | 868,950 | 966,980 | 1,192,640 | 1,368,420 | 1,537,580 | 1,751,410 | 2,027,830 | 2,319,990 | 2,637,730 |
| Madhya Pradesh * | 867,450 | 868,320 | 1,028,390 | 1,129,270 | 1,242,760 | 1,445,770 | 1,614,790 | 1,972,760 | 2,279,840 | 2,633,960 |
| Maharashtra * | 2,731,880 | 2,994,790 | 3,406,000 | 4,154,800 | 4,867,660 | 5,844,980 | 6,848,170 | 7,539,690 | 8,557,510 | 10,350,860 |
| Manipur * | 33,690 | 35,060 | 39,790 | 51,330 | 57,180 | 61,370 | 67,830 | 73,990 | 82,540 | 91,370 |
| Meghalaya * | 44,780 | 47,630 | 52,800 | 65,590 | 72,650 | 86,250 | 97,350 | 116,170 | 127,090 | 145,830 |
| Mizoram * | 19,470 | 21,660 | 23,250 | 26,820 | 29,710 | 32,900 | 38,160 | 45,770 | 52,600 | 63,880 |
| Nagaland * | 39,720 | 44,670 | 48,120 | 58,390 | 65,880 | 72,570 | 80,750 | 94,360 | 105,270 | 117,590 |
| Odisha * | 467,560 | 497,130 | 610,080 | 777,290 | 850,960 | 1,018,390 | 1,292,740 | 1,484,910 | 1,629,460 | 1,975,300 |
| Punjab * | 796,110 | 822,490 | 900,890 | 968,390 | 1,086,370 | 1,271,230 | 1,522,450 | 1,740,390 | 1,975,000 | 2,262,040 |
| Rajasthan * | 917,710 | 885,500 | 1,116,060 | 1,277,460 | 1,422,360 | 1,710,430 | 1,948,220 | 2,309,490 | 2,658,250 | 3,383,480 |
| Sikkim * | 11,360 | 12,760 | 14,300 | 17,390 | 19,930 | 21,610 | 25,060 | 32,290 | 61,330 | 74,120 |
| Tamil Nadu * | 1,488,610 | 1,581,550 | 1,753,710 | 2,190,030 | 2,578,330 | 3,105,260 | 3,508,190 | 4,013,360 | 4,797,330 | 5,848,960 |
| Telangana * | – | – | – | – | – | – | – | – | – | – |
| Tripura * | 63,700 | 67,330 | 75,510 | 89,040 | 98,260 | 109,140 | 117,970 | 135,730 | 154,030 | 178,680 |
| Uttar Pradesh * | 1,902,690 | 2,068,550 | 2,269,720 | 2,608,410 | 2,931,720 | 3,363,170 | 3,830,260 | 4,446,850 | 5,233,940 | 6,001,640 |
| Uttarakhand * | 151,440 | 184,730 | 204,390 | 247,860 | 299,680 | 367,950 | 458,560 | 560,250 | 707,300 | 839,690 |
| Bengal * | 1,571,440 | 1,680,000 | 1,892,590 | 2,086,560 | 2,302,450 | 2,616,820 | 2,994,830 | 3,419,420 | 3,988,800 | 4,609,590 |
| Andaman and Nicobar Islands * | 10,820 | 12,280 | 13,920 | 18,130 | 20,440 | 25,380 | 29,900 | 34,800 | 41,200 | 43,450 |
| Chandigarh * | 54,900 | 64,530 | 74,190 | 85,040 | 101,850 | 122,760 | 136,690 | 153,340 | 177,170 | 200,170 |
| Delhi * | 650,270 | 713,610 | 794,680 | 1,003,250 | 1,153,740 | 1,355,840 | 1,579,470 | 1,895,530 | 2,197,530 | 2,527,530 |
| Puducherry * | 42,590 | 49,310 | 54,380 | 57,540 | 79,770 | 83,350 | 92,510 | 100,500 | 123,040 | 130,920 |
| India * | 20,977,260 | 22,614,150 | 25,381,700 | 29,714,640 | 33,905,030 | 39,532,760 | 45,820,860 | 53,035,670 | 61,089,030 | 72,488,600 |
Nominal GSDP growth rate
This table shows annual growth rate in each state's or union territory's nominal GSDP.[1][7] No data was available for the union territories of Dadra and Nagar Haveli, Daman and Diu and Lakshadweep.
| State/union territory | 2010–11 | 2011–12 | 2012–13 | 2013–14 | 2014–15 | 2015–16 | 2016–17 | 2017–18 | 2018–19 |
|---|---|---|---|---|---|---|---|---|---|
| Andhra | |||||||||
| Arunachal | – | – | |||||||
| Assam * | – | – | |||||||
| Bihar * | – | ||||||||
| Chhattisgarh * | |||||||||
| Goa * | – | ||||||||
| Gujarat * | |||||||||
| Haryana * | |||||||||
| Himachal * | |||||||||
| Jammu and Kashmir (state) * | – | – | |||||||
| Jharkhand * | |||||||||
| Karnataka * | – | ||||||||
| Kerala * | – | – | |||||||
| Madhya Pradesh * | |||||||||
| Maharashtra * | |||||||||
| Manipur * | – | – | |||||||
| Meghalaya * | – | – | |||||||
| Mizoram * | – | – | |||||||
| Nagaland * | – | – | |||||||
| Odisha * | |||||||||
| Punjab * | |||||||||
| Rajasthan * | – | ||||||||
| Sikkim * | – | ||||||||
| Tamil Nadu * | |||||||||
| Telangana * | |||||||||
| Tripura * | – | – | |||||||
| Uttar Pradesh * | – | ||||||||
| Uttarakhand * | – | ||||||||
| Bengal * | |||||||||
| Chandigarh * | – | – | |||||||
| Delhi * | – | ||||||||
| Puducherry * | – | ||||||||
| Andaman and Nicobar Islands * | – | – | |||||||
| India * |
See also
References
- "Gross State Domestic Product (GSDP) at Current Prices (as on 31-05-2014)" (PDF). Planning Commission Government of India. Archived from the original (PDF) on 15 July 2014.
- "National economic debate – Stock markets or rigged casinos – talk by Professor Dr. R. Vaidyanathan (IIM Bangalore) – 21 Jan 2011, Mumbai". National Economic Debates. Retrieved 1 November 2016.
- "Reserve Bank of India - Publications". www.rbi.org.in. Retrieved 17 June 2022.
- "Reserve Bank of India - Publications". www.rbi.org.in. Retrieved 17 June 2022.
- "Second Advance Estimates of National Income, 2019-20 and Quarterly Estimates of Gross Domestic Product for the Third Quarter (Oct-Dec), 2019-20". Press Information Bureau, Government of India. 28 February 2020. Retrieved 8 March 2021.
- "State Domestic Product and other aggregates, 2004–05 series". Ministry of Statistics and Programme Implementation. 27 February 2015. Archived from the original on 23 March 2015. Retrieved 18 June 2015.
- "MOSPI GSDP". MOSPI.
- "MOSPI State Domestic Product, Ministry of Statistics and Programme Implementation, Government of India". 15 March 2021. Retrieved 17 April 2021.
- "Bengal - at a Glance".