IPCC list of greenhouse gases
This is a list of the most influential long-lived, well-mixed greenhouse gases, along with their tropospheric concentrations and direct radiative forcings, as identified by the Intergovernmental Panel on Climate Change (IPCC).[4] Abundances of these trace gases are regularly measured by atmospheric scientists from samples collected throughout the world.[5][6][7] Since the 1980s, their forcing contributions (relative to year 1750) are also estimated with high accuracy using IPCC-recommended expressions derived from radiative transfer models.[3]

This list excludes:
- water vapor which is responsible overall for about half of all atmospheric gas forcing. Water vapor and clouds are more dynamic atmospheric constituents and contribute strong climate change feedback influences.[8]
- other short-lived gases (e.g. carbon monoxide, NOx) and aerosols (e.g. mineral dust, black carbon) that also vary more strongly over location and time. Ozone has warming influences comparable to nitrous oxide and CFCs, and is longer lived and more abundant in the stratosphere than in the troposphere.[9]
- many refrigerants and other halogenated gases that have been mass-produced in smaller quantities. Most are long-lived and well-mixed. Some are also listed in Appendix 8A of the 2013 IPCC Assessment Report.[4]: 731–738 and Annex III of the 2021 IPCC WG1 Report[10]: 4–9
- oxygen, nitrogen, argon, and other gases that are less influenced by human activity and interact relatively little with Earth's thermal radiation.[11][12]
Combined Summary from IPCC Assessment Reports (TAR, AR4, AR5, AR6)
Mole fractions: μmol/mol = ppm = parts per million (106); nmol/mol = ppb = parts per billion (109); pmol/mol = ppt = parts per trillion (1012).
| Species | Lifetime (years) [4]: 731 |
100-yr GWP [4]: 731 |
Mole Fraction [ppt - except as noted] | Radiative forcing [W m−2] [B] | |||||||
|---|---|---|---|---|---|---|---|---|---|---|---|
| Base 1750 |
TAR[13] 1998 |
AR4[14] 2005 |
AR5[4]: 678 2011 |
Data[15][16] 2020 |
TAR[13] 1998 |
AR4[14] 2005 |
AR5[4]: 678 2011 |
AR6[10]: 4–9 2019 | |||
| CO2 [ppm] | [A] | 1 | 278 | 365 | 379 | 391 |  | 1.46 | 1.66 | 1.82 | 2.16 |
| CH4 [ppb] | 12.4 | 28 | 700 | 1,745 | 1,774 | 1,801 |  | 0.48 | 0.48 | 0.48 | 0.54 |
| N2O [ppb] | 121 | 265 | 270 | 314 | 319 | 324 | 0.15 | 0.16 | 0.17 | 0.21 | |
| CFC-11 | 45 | 4,660 | 0 | 268 | 251 | 238 | 0.07 | 0.063 | 0.062 | 0.066 | |
| CFC-12 | 100 | 10,200 | 0 | 533 | 538 | 528 | 0.17 | 0.17 | 0.17 | 0.18 | |
| CFC-13 | 640 | 13,900 | 0 | 4 | - | 2.7 | cfc13 | 0.001 | - | 0.0007 | 0.0009 |
| CFC-113 | 85 | 6,490 | 0 | 84 | 79 | 74 | 0.03 | 0.024 | 0.022 | 0.021 | |
| CFC-114 | 190 | 7,710 | 0 | 15 | - | - | cfc114 | 0.005 | - | - | 0.005 |
| CFC-115 | 1,020 | 5,860 | 0 | 7 | - | 8.37 | cfc115 | 0.001 | - | 0.0017 | 0.0021 |
| HCFC-22 | 11.9 | 5,280 | 0 | 132 | 169 | 213 | 0.03 | 0.033 | 0.0447 | 0.0528 | |
| HCFC-141b | 9.2 | 2,550 | 0 | 10 | 18 | 21.4 | 0.001 | 0.0025 | 0.0034 | 0.0039 | |
| HCFC-142b | 17.2 | 5,020 | 0 | 11 | 15 | 21.2 | 0.002 | 0.0031 | 0.0040 | 0.0043 | |
| CH3CCl3 | 5 | 160 | 0 | 69 | 19 | 6.32 | 0.004 | 0.0011 | 0.0004 | 0.0001 | |
| CCl4 | 26 | 1,730 | 0 | 102 | 93 | 85.8 | 0.01 | 0.012 | 0.0146 | 0.0129 | |
| HFC-23 | 222 | 12,400 | 0 | 14 | 18 | 24 | 0.002 | 0.0033 | 0.0043 | 0.0062 | |
| HFC-32 | 5.2 | 677 | 0 | - | - | 4.92 | - | - | 0.0005 | 0.0022 | |
| HFC-125 | 28.2 | 3,170 | 0 | - | 3.7 | 9.58 | - | 0.0009 | 0.0022 | 0.0069 | |
| HFC-134a | 13.4 | 1,300 | 0 | 7.5 | 35 | 62.7 | _concentration.png.webp) | 0.001 | 0.0055 | 0.0100 | 0.018 |
| HFC-143a | 47.1 | 4,800 | 0 | - | - | 12.0 | - | - | 0.0019 | 0.0040 | |
| HFC-152a | 1.5 | 138 | 0 | 0.5 | 3.9 | 6.4 | 0.000 | 0.0004 | 0.0006 | 0.0007 | |
| CF4 (PFC-14) | 50,000 | 6,630 | 40 | 80 | 74 | 79 | 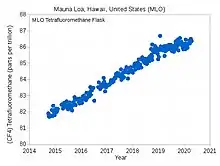 | 0.003 | 0.0034 | 0.0040 | 0.0051 |
| C2F6 (PFC-116) | 10,000 | 11,100 | 0 | 3 | 2.9 | 4.16 | 0.001 | 0.0008 | 0.0010 | 0.0013 | |
| SF6 | 3,200 | 23,500 | 0 | 4.2 | 5.6 | 7.28 |  | 0.002 | 0.0029 | 0.0041 | 0.0056 |
| SO2F2 | 36 | 4,090 | 0 | - | - | 1.71 | - | - | 0.0003 | 0.0005 | |
| NF3 | 500 | 16,100 | 0 | - | - | 0.9 | - | - | 0.0002 | 0.0004 | |
A The IPCC states that "no single atmospheric lifetime can be given" for CO2.[4]: 731 This is mostly due to the rapid growth and cumulative magnitude of the disturbances to Earth's carbon cycle by the geologic extraction and burning of fossil carbon.[17] As of year 2014, fossil CO2 emitted as a theoretical 10 to 100 GtC pulse on top of the existing atmospheric concentration was expected to be 50% removed by land vegetation and ocean sinks in less than about a century, as based on the projections of coupled models referenced in the AR5 assessment.[18] A substantial fraction (20-35%) was also projected to remain in the atmosphere for centuries to millennia, where fractional persistence increases with pulse size.[19][20]
B Values are relative to year 1750. AR6 reports the effective radiative forcing which includes effects of rapid adjustments in the atmosphere and at the surface.[21]
Gases from IPCC Fourth Assessment Report
The following table has its sources in Chapter 2, p. 141, Table 2.1. of the IPCC Fourth Assessment Report, Climate Change 2007 (AR4), Working Group 1 Report, The Physical Science Basis.[14]
| Mole fractions and their changes | Radiative forcing | |||
|---|---|---|---|---|
| Species | 2005 | Change since 1998 | 2005 (W m−2) | 1998 (%) |
| CO2 | 379 ± 0.65 μmol/mol | +13 μmol/mol | 1.66 | +13 |
| CH4 | 1,774 ± 1.8 nmol/mol | +11 nmol/mol | 0.48 | – |
| N2O | 319 ± 0.12 nmol/mol | +5 nmol/mol | 0.16 | +11 |
| CFC-11 | 251 ± 0.36 pmol/mol | −13 | 0.063 | −5 |
| CFC-12 | 538 ± 0.18 pmol/mol | +4 | 0.17 | +1 |
| CFC-113 | 79 ± 0.064 pmol/mol | −4 | 0.024 | −5 |
| HCFC-22 | 169 ± 1.0 pmol/mol | +38 | 0.033 | +29 |
| HCFC-141b | 18 ± 0.068 pmol/mol | +9 | 0.0025 | +93 |
| HCFC-142b | 15 ± 0.13 pmol/mol | +6 | 0.0031 | +57 |
| CH3CCl3 | 19 ± 0.47 pmol/mol | −47 | 0.0011 | −72 |
| CCl4 | 93 ± 0.17 pmol/mol | −7 | 0.012 | −7 |
| HFC-125 | 3.7 ± 0.10 pmol/mol | +2.6 | 0.0009 | +234 |
| HFC-134a | 35 ± 0.73 pmol/mol | +27 | 0.0055 | +349 |
| HFC-152a | 3.9 ± 0.11 pmol/mol | +2.4 | 0.0004 | +151 |
| HFC-23 | 18 ± 0.12 pmol/mol | +4 | 0.0033 | +29 |
| SF6 | 5.6 ± 0.038 pmol/mol | +1.5 | 0.0029 | +36 |
| CF4 (PFC-14) | 74 ± 1.6 pmol/mol | – | 0.0034 | – |
| C2F6 (PFC-116) | 2.9 ± 0.025 pmol/mol | +0.5 | 0.0008 | +22 |
Gases from IPCC Third Assessment Report
The following table has its sources in Chapter 6, p. 358, Table 6.1. of the IPCC Third Assessment Report, Climate Change 2001 (TAR), Working Group 1, The Scientific Basis.[13]
Gases relevant to radiative forcing only
| Gas | Alternate name | Formula | 1998 level | Increase since 1750 | Radiative forcing (Wm−2) | Specific heat at STP (J kg−1) |
|---|---|---|---|---|---|---|
| Carbon dioxide | Carbon Dioxide | (CO2) | 365 μmol/mol | 87 μmol/mol | 1.46 | 0.819 |
| Methane | Marsh gas | (CH4) | 1,745 nmol/mol | 1,045 nmol/mol | 0.48 | 2.191 |
| Nitrous oxide | Laughing gas | (N2O) | 314 nmol/mol | 44 nmol/mol | 0.15 | 0.88 |
| Tetrafluoromethane | Carbon tetrafluoride | (CF4) | 80 pmol/mol | 40 pmol/mol | 0.003 | 1.33 |
| Hexafluoroethane | Perfluoroethane | (C2F6) | 3 pmol/mol | 3 pmol/mol | 0.001 | 0.067 |
| Sulfur hexafluoride | Sulfur fluoride | (SF6) | 4.2 pmol/mol | 4.2 pmol/mol | 0.002 | 0.074 |
| HFC-23 | Trifluoromethane | (CHF3) | 14 pmol/mol | 14 pmol/mol | 0.002 | 0.064 |
| HFC-134a | 1,1,1,2-Tetrafluoroethane | C2H2F4 | 7.5 pmol/mol | 7.5 pmol/mol | 0.001 | 0.007 |
| HFC-152a | 1,1-Difluoroethane | (C2H4F2) | 0.5 pmol/mol | 0.5 pmol/mol | 0.000 | 0.04 |
Gases relevant to radiative forcing and ozone depletion
| Gas | Alternate name | Formula | 1998 level | Increase since 1750 | Radiative forcing (Wm−2) |
|---|---|---|---|---|---|
| CFC-11§ | Trichlorofluoromethane | (CFCl3) | 268 pmol/mol | 268 pmol/mol | 0.07 |
| CFC-12§ | Dichlorodifluoromethane | (CF2Cl2) | 533 pmol/mol | 533 pmol/mol | 0.17 |
| CFC-13§ | Chlorotrifluoromethane | (CClF3) | 4 pmol/mol | 4 pmol/mol | 0.001 |
| CFC-113 | 1,1,1-Trichlorotrifluoroethane | (C2F3Cl3) | 84 pmol/mol | 84 pmol/mol | 0.03 |
| CFC-114 | 1,2-Dichlorotetrafluoroethane | (C2F4Cl2) | 15 pmol/mol | 15 pmol/mol | 0.005 |
| CFC-115 | Chloropentafluoroethane | (C2F5Cl) | 7 pmol/mol | 7 pmol/mol | 0.001 |
| Carbon tetrachloride | Tetrachloromethane | (CCl4) | 102 pmol/mol | 102 pmol/mol | 0.01 |
| 1,1,1-Trichloroethane | Methyl chloroform | (CH3CCl3) | 69 pmol/mol | 69 pmol/mol | 0.004 |
| HCFC-141b | 1,1-Dichloro-1-fluoroethane | (C2H3FCl2) | 10 pmol/mol | 10 pmol/mol | 0.001 |
| HCFC-142b | 1-Chloro-1,1-difluoroethane | (C2H3F2Cl) | 11 pmol/mol | 11 pmol/mol | 0.002 |
| Halon-1211 | Bromochlorodifluoromethane | (CClF2Br) | 3.8 pmol/mol | 3.8 pmol/mol | 0.001 |
| Halon-1301 | Bromotrifluoromethane | (CF3Br) | 2.5 pmol/mol | 2.5 pmol/mol | 0.001 |
See also
References
- "The NOAA Annual Greenhouse Gas Index (AGGI)". NOAA.gov. National Oceanographic and Atmospheric Administration (NOAA). Spring 2023. Archived from the original on 24 May 2023.
- "Annual Greenhouse Gas Index". U.S. Global Change Research Program. Retrieved 5 September 2020.
- Butler J. and Montzka S. (2020). "The NOAA Annual Greenhouse Gas Index (AGGI)". NOAA Global Monitoring Laboratory/Earth System Research Laboratories.
- "Chapter 8". AR5 Climate Change 2013: The Physical Science Basis.
- "Global Monitoring Laboratory". NOAA Earth System Research Laboratories. Retrieved 2020-12-11.
- "World Data Centre for Greenhouse Gases". World Meteorological Organization Global Atmosphere Watch Programme and Japan Meteorological Agency. Retrieved 2020-12-11.
- "Advanced Global Atmospheric Gas Experiment". Massachusetts Institute of Technology. Retrieved 2020-12-11.
- Gavin Schmidt (2010-10-01). "Taking the Measure of the Greenhouse Effect". NASA Goddard Institute for Space Studies - Science Briefs.
- "Atmospheric Concentration of Greenhouse Gases" (PDF). U.S. Environmental Protection Agency. 2016-08-01.
- Dentener F. J.; B. Hall; C. Smith, eds. (2021-08-09), "Annex III: Tables of historical and projected well-mixed greenhouse gas mixing ratios and effective radiative forcing of all climate forcers", Climate Change 2021: The Physical Science Basis. Contribution of Working Group I to the Sixth Assessment Report of the Intergovernmental Panel on Climate Change, Cambridge University Press
- "Which Gases Are Greenhouse Gases?". American Chemical Society. Retrieved 2021-05-31.
- Höpfner, M.; Milz, M.; Buehler, S.; Orphall, J.; Stiller, G. (24 May 2012). "The natural greenhouse effect of atmospheric oxygen (O2) and nitrogen (N2)". Geophysical Research Letters. 39 (L10706). doi:10.1029/2012GL051409. ISSN 1944-8007. S2CID 128823108.
- "Chapter 6". TAR Climate Change 2001: The Scientific Basis. p. 358.
- "Chapter 2". AR4 Climate Change 2007: The Physical Science Basis. p. 141.
- "Long-term global trends of atmospheric trace gases". NOAA Earth System Research Laboratories. Retrieved 2021-02-11.
- "AGAGE Data and Figures". Massachusetts Institute of Technology. Retrieved 2021-02-11.
- Friedlingstein, P., Jones, M., O'Sullivan, M., Andrew, R., Hauck, J., Peters, G., Peters, W., Pongratz, J., Sitch, S., Le Quéré, C. and 66 others (2019) "Global carbon budget 2019". Earth System Science Data, 11(4): 1783–1838. doi:10.5194/essd-11-1783-2019
- "Figure 8.SM.4" (PDF). Intergovernmental Panel on Climate Change Fifth Assessment Report - Supplemental Material. p. 8SM-16.
- Archer, David (2009). "Atmospheric lifetime of fossil fuel carbon dioxide". Annual Review of Earth and Planetary Sciences. 37 (1): 117–34. Bibcode:2009AREPS..37..117A. doi:10.1146/annurev.earth.031208.100206. hdl:2268/12933.
- Joos, F.; Roth, R.; Fuglestvedt, J.D.; et al. (2013). "Carbon dioxide and climate impulse response functions for the computation of greenhouse gas metrics: A multi-model analysis". Atmospheric Chemistry and Physics. 13 (5): 2793–2825. doi:10.5194/acpd-12-19799-2012.
- Hansen, J.; Sato, M.; Ruedy, R.; et al. (2005). "Efficacy of Climate Forcings". Journal of Geophysical Research: Atmospheres. 119 (D18104). doi:10.1029/2005JD005776.