2000 Lombard regional election
The 2000 Lombard regional election took place on 16 April 2000. The 7th term of the Regional Council was chosen.
| |||||||||||||||||||||||||||||||
All 80 seats to the Regional Council of Lombardy | |||||||||||||||||||||||||||||||
|---|---|---|---|---|---|---|---|---|---|---|---|---|---|---|---|---|---|---|---|---|---|---|---|---|---|---|---|---|---|---|---|
| Turnout | 75.59% ( | ||||||||||||||||||||||||||||||
| |||||||||||||||||||||||||||||||
 | |||||||||||||||||||||||||||||||
 |
|---|
|
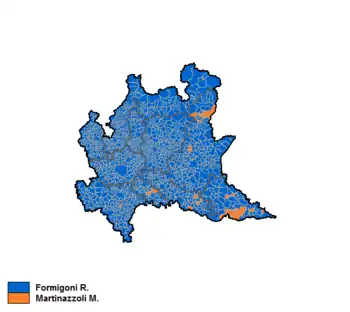
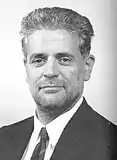
Roberto Formigoni (Forza Italia) was re-elected for the second time in a row President, defeating Mino Martinazzoli (Italian People's Party). His re-election resulted in a landslide, as this time he was supported also by the Northern League.
Electoral system
Regional elections in Lombardy were ruled by the "Tatarella law" (approved in 1995), which provided for a mixed electoral system: four fifths of the regional councilors were elected in provincial constituencies by proportional representation, using the largest remainder method with a droop quota and open lists, while the residual votes and the unassigned seats were grouped into a "single regional constituency", where the whole ratios and the highest remainders were divided with the Hare method among the provincial party lists; one fifth of the council seats instead was reserved for regional lists and assigned with a majoritarian system: the leader of the regional list that scored the highest number of votes was elected to the presidency of the Region while the other candidates were elected regional councilors.
A threshold of 3% had been established for the provincial lists, which, however, could still have entered the regional council if the regional list to which they were connected had scored at least 5% of valid votes.
The panachage was also allowed: the voter can indicate a candidate for the presidency but prefer a provincial list connected to another candidate.
Council apportionment
According to the official 1991 Italian census, the 64 Council seats which must be covered by proportional representation were so distributed between Lombard provinces.
| BG | BS | CO | CR | LC | LO | MN | MI | PV | SO | VA | total |
|---|---|---|---|---|---|---|---|---|---|---|---|
| 7 | 8 | 4 | 2 | 2 | 1 | 3 | 27 | 3 | 1 | 6 | 64 |
The allocation is not fixed. Remaining seats and votes after proportional distribution, are all grouped at regional level and divided by party lists. The consequent division of these seats at provincial level usually change the original apportionment. Only 43 seats were directly assigned at provincial level, and the final distribution between provinces changed in this way.
| BG | BS | CO | CR | LC | LO | MN | MI | PV | SO | VA | total |
|---|---|---|---|---|---|---|---|---|---|---|---|
| +2 | = | = | = | +1 | +1 | -1 | +2 | -1 | +1 | +2 | +7 |
As it can be seen, the landslide victory of the Pole for Freedoms caused the distribution of seven more seats to the oppositions at provincial level. Bergamo and Varese received two new seats, Cremona and Lodi and Sondrio one each.
Parties and candidates
| Political party or alliance | Constituent lists | Previous result | Candidate | |||
|---|---|---|---|---|---|---|
| Votes (%) | Seats | |||||
| Pole for Freedoms | Forza Italia | 29.2 | 28 | Roberto Formigoni | ||
| Northern League | 17.7 | 12 | ||||
| National Alliance | 10.0 | 8 | ||||
| Christian Democratic Centre | 2.2 | 2 | ||||
| Pensioners' Party | 1.4 | – | ||||
| United Christian Democrats | — | — | ||||
| Others | — | — | ||||
| The Olive Tree | The Olive Tree | 26.4 | 17 | Mino Martinazzoli | ||
| Communist Refoundation Party | 7.7 | 5 | ||||
| Italian Democratic Socialists – Liberals | — | — | ||||
| Bonino List | 1.8 | – | Benedetto Della Vedova | |||
| Party of Italian Communists | — | — | Nerio Nesi | |||
Results
The 1999 European election marked a turning point in relations between Forza Italia and the Northern League. Silvio Berlusconi's attempt to destroy the League by a media campaign aimed at shifting protesting votes to the Italian Radicals, succeeded only in part: the consensus of the federalist movement had fallen so sharply, but not enough to ensure the coalition of the Knight from possible disasters like the 1996 election. In addition, the assembly works in parliament had highlighted a growing programmatic convergence between the two major Lombard parties. And so, in view of the 2001 general election, Berlusconi and Umberto Bossi put aside the old, and even bloody quarrels, and formed a new coalition: the Pole for Freedoms, which found in the regional elections its first test.
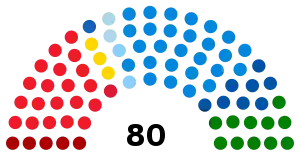
The combination of what were the major forces of regional politics, securing a safe and agile reappointment to the Communion and Liberation's incumbent President, Roberto Formigoni, which ensured stability of the Regional Cabinet that the new regulations wanted to coincide in term with the legislature. Forza Italia was confirmed as the largest party in the region with an historic 34% of the vote, while Lega Nord was the second largest party with 15%. The Olive Tree, an alliance comprising several centre-left parties including the Italian People's Party, the Democrats of the Left, The Democrats, the Federation of the Greens and Italian Renewal, which here run in a single list for the first time in Italian history, had a great shock losing a fifth of its votes, falling at only 20%.
 | |||||||||
| Candidates | Votes | % | Seats | Parties | Votes | % | Seat | ||
|---|---|---|---|---|---|---|---|---|---|
| Roberto Formigoni | 3,355,803 | 62.37 | 8 | ||||||
| Forza Italia | 1,539,359 | 33.79 | 24 | ||||||
| Northern League – Lombard League | 702,479 | 15.42 | 10 | ||||||
| National Alliance | 441,087 | 9.68 | 6 | ||||||
| United Christian Democrats | 111,112 | 2.44 | 1 | ||||||
| Christian Democratic Centre | 76,423 | 1.68 | 1 | ||||||
| Pensioners' Party | 71,925 | 1.58 | 1 | ||||||
| Socialist Party | 31,178 | 0.68 | – | ||||||
| The Liberals Sgarbi | 21,876 | 0.48 | – | ||||||
| Total | 2,995,439 | 65.75 | 43 | ||||||
| Mino Martinazzoli | 1,692,474 | 31.46 | 1 | ||||||
| The Olive Tree | 918,345 | 20.16 | 19 | ||||||
| Communist Refoundation Party | 289,572 | 6.36 | 5 | ||||||
| Italian Democratic Socialists–Liberals–Others | 86,517 | 1.90 | 1 | ||||||
| Total | 1,294,434 | 28.41 | 25 | ||||||
| Benedetto Della Vedova | 178,406 | 3.32 | – | Bonino List | 154,396 | 3.39 | 3 | ||
| Nerio Nesi | 110,202 | 2.05 | – | Party of Italian Communists | 86,027 | 1.89 | – | ||
| Giorgio Schultze | 43,696 | 0.81 | – | Humanist Party | 25,350 | 0.56 | – | ||
| Total candidates | 5,380,581 | 100.00 | 9 | Total parties | 4,555,646 | 100.00 | 71 | ||
| Source: Ministry of the Interior – Historical Archive of Elections | |||||||||
Results by province

| Province | Roberto Formigoni | Mino Martinazzoli | Benedetto Della Vedova | Turnout |
|---|---|---|---|---|
| Milan | 1,311,057 (60.01%) | 724,518 (33.16%) | 75,064 (3.44%) |
73.38% |
| Brescia | 410,929 (62.24%) | 220,489 (33.39%) | 16,039 (2.43%) |
78.34% |
| Bergamo | 400,883 (67.94%) | 159,419 (27.02%) | 16,367 (2.77%) |
79.15% |
| Varese | 319,092 (67.06%) | 124,027 (26.07%) | 18,742 (3.94%) |
74.05% |
| Como | 226,699 (69.81%) | 81,712 (25.16%) |
11,721 (3.61%) |
75.71% |
| Pavia | 188,138 (62.02%) | 92,449 (30.48%) |
11,997 (3.96%) |
77.28% |
| Mantua | 121,621 (53.08%) | 88,549 (38.65%) |
8,202 (3.58%) |
77.40% |
| Cremona | 123,317 (59.72%) |
70,621 (34.20%) |
5,667 (2.74%) |
79.51% |
| Lecco | 117,140 (62.06%) | 62,995 (33.37%) |
6,004 (3.18%) |
78.66% |
| Lodi | 68,245 (58.21%) |
41,716 (35.58%) |
3,778 (3.22%) |
78.38% |
| Sondrio | 68,682 (68.44%) |
25,979 (25.89%) |
4,825 (4.81%) |
69.26% |
Results by capital city
| City | Roberto Formigoni | Mino Martinazzoli | Benedetto Della Vedova | Turnout |
|---|---|---|---|---|
| Milan | 435,304 (59.83%) |
244,591 (33.62%) |
26,177 (3.60%) |
68.80% |
| Brescia | 67,017 (57.09%) |
44,515 (37.92%) |
3,337 (2.88%) |
76.65% |
| Bergamo | 45,064 (62.11%) |
23,506 (32.40%) |
2,374 (3.27%) |
77.10% |
| Como | 33,466 (66.37%) |
13,798 (27.37%) |
2,222 (4.41%) |
72.76% |
| Varese | 31,297 (66.37%) |
12,602 (26.73%) |
1,988 (4.22%) |
69.82% |
| Pavia | 27,578 (59.69%) |
15,281 (33.07%) |
1,809 (3.92%) |
79.16% |
| Cremona | 24,833 (55.20%) |
17,015 (37.82%) |
1,447 (3.22%) |
77.78% |
| Mantua | 14,621 (47.96%) |
13,077 (42.90%) |
1,312 (4.30%) |
76.66% |
| Lecco | 16,800 (60.36%) |
9,846 (35.37%) |
808 (2.90%) |
75.95% |
| Lodi | 15,151 (58.98%) |
8,980 (34.96%) |
836 (3.25%) |
77.73% |
| Sondrio | 7,827 (61.26%) |
4,169 (32.63%) |
645 (5.05%) |
69.49% |
References
- The swing comes from the combined result of the Pole of Freedoms (41.6%) and Lega Nord (17.7%) in the 1995 regional election.

