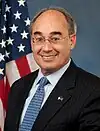
Maine's 2nd congressional district
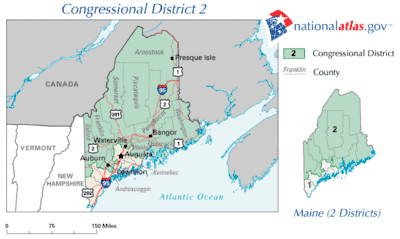
Maine's 2nd congressional district is a congressional district in the U.S. state of Maine. Covering 27,326 square miles (70,770 km2), it comprises nearly 80% of the state's total land area. The district comprises most of the land area north of the Portland and Augusta metropolitan areas. It includes the cities of Lewiston, Bangor, Auburn, and Presque Isle. The district is represented by Democrat Jared Golden, who took office in 2019.
| Maine's 2nd congressional district | |||
|---|---|---|---|
.png.webp) Maine's 2nd congressional district since January 3, 2023 | |||
| Representative |
| ||
| Distribution |
| ||
| Population (2022) | 687,642 | ||
| Median household income | $59,676 | ||
| Ethnicity |
| ||
| Cook PVI | R+6[1] | ||
It is the largest district by area east of the Mississippi River, and the 24th largest overall. It is the second-most rural district in the United States, with 72% of its population in rural areas, and it has the second highest proportion of non-Hispanic White residents (94%); only Kentucky's 5th congressional district exceeds it in the two categories.[2] Furthermore, it is the only district in New England that voted for Donald Trump in 2020. Additionally, it was one of five districts that would have voted for Trump in 2020 had they existed in their current configuration while being won or held by a Democrat in 2022.
History
Until the Missouri Compromise was reached in 1820, Maine was a part of Massachusetts as the District of Maine. When it became a state in 1820, Maine had seven congressional districts credited to it (Massachusetts including Maine had been given 20 districts after the 1810 census). Since Maine became a state, all but two districts have been reallocated to other states.
In 2018, the district became the first in the United States to elect the ranked choice winner over the first-past-the-post winner, after a referendum in 2016 changed Maine's electoral system from the latter system to the former. Incumbent representative Bruce Poliquin won a plurality of the first preference votes. However, the second and third preferences from two independent candidates flowed overwhelmingly to Jared Golden, allowing him to win with 50.6% of the vote once all preferences were distributed.
Historically, the district has tended to keep its incumbents regardless of party. When Golden defeated two-term Republican incumbent Bruce Poliquin in 2018, it was the first time an incumbent had lost reelection in the district since 1916.[3] Since 1965, the district's representatives have frequently sought statewide office. Three U.S. senators (Democrat William Hathaway and Republicans William Cohen and Olympia Snowe), one governor (Democrat John Baldacci), and one nominee for governor (Democrat Mike Michaud) all previously held the seat. Due to its size, the district's congressman is usually reckoned as a statewide figure; its footprint includes portions of all three television markets anchored in the state.
Composition
The boundaries of the district are open for reconsideration in light of population shifts revealed by the decennial US census. Until 2011, Maine's constitution provided for the state to reapportion the congressional districts based on census data every ten years beginning in 1983, which would have meant that the state was next due to consider redistricting in 2013. However, a federal lawsuit filed in March 2011 led to a requirement that Maine speed up its redistricting process.[4] Maine state legislators approved new boundaries on September 27, 2011.[5]
Election results from presidential races
In US presidential elections, most states give all the state's electoral votes to the candidate that wins the statewide popular vote. This is a type of winner-takes-all voting. Maine and Nebraska instead use the congressional district method, where the winner in each of the state's congressional districts gets one electoral vote, and the statewide winner gets an additional two electoral votes. Since Maine introduced this system in 1969, Maine's second district voted the same way as the entire state of Maine for every election until 2016 and 2020.
| Year | Results |
|---|---|
| 1972 | Nixon 62–38% |
| 1976 | Ford 49–48% |
| 1980 | Reagan 46–43% |
| 1984 | Reagan 62–38% |
| 1988 | Bush 55–45% |
| 1992 | Clinton 38–33%–28% |
| 1996 | Clinton 51–30% |
| 2000 | Gore 47–46% |
| 2004 | Kerry 52–46% |
| 2008 | Obama 55–43% |
| 2012 | Obama 53–44% |
| 2016 | Trump 51–41% |
| 2020 | Trump 52–45% |
List of members representing the district
Election history
1978
| Party | Candidate | Votes | % | |
|---|---|---|---|---|
| Republican | Olympia Snowe | 87,939 | 50.82 | |
| Democratic | Markham L. Gartley | 70,691 | 40.85 | |
| Independent | Frederick W. Whittaker | 8,035 | 4.64 | |
| Independent | Eddie Shurtleff | 1,923 | 1.11 | |
| Independent | Robert H. Burmeister | 1,653 | 0.96 | |
| Independent | Margaret E. Cousins | 1,573 | 0.91 | |
| Independent | Robert L. Cousins | 1,223 | 0.71 | |
| Majority | 17,248 | 9.97 | ||
| Turnout | 173,037 | |||
| Republican hold | ||||
1980
| Party | Candidate | Votes | % | |
|---|---|---|---|---|
| Republican | Olympia Snowe (Incumbent) | 186,406 | 78.51 | |
| Democratic | Harold L. Silverman | 51,026 | 21.49 | |
| Majority | 135,380 | 57.02 | ||
| Turnout | 237,612 | |||
| Republican hold | ||||
| Party | Candidate | Votes | % | |
|---|---|---|---|---|
| Republican | Olympia Snowe (Incumbent) | 136,075 | 66.65 | |
| Democratic | James P. Dunleavy | 68,086 | 33.35 | |
| Majority | 67,989 | 33.30 | ||
| Turnout | 204,161 | |||
| Republican hold | ||||
1982
| Party | Candidate | Votes | % | |
|---|---|---|---|---|
| Republican | Olympia Snowe (Incumbent) | 192,166 | 75.73 | |
| Democratic | Chipman C. Bull | 57,347 | 22.60 | |
| Constitution | Kenneth E. Stoddard | 4,242 | 1.67 | |
| Majority | 134,819 | 53.13 | ||
| Turnout | 253,755 | |||
| Republican hold | ||||
1984
| Party | Candidate | Votes | % | |
|---|---|---|---|---|
| Republican | Olympia Snowe (Incumbent) | 148,770 | 77.33 | |
| Democratic | Kenneth P. Hayes | 43,614 | 22.67 | |
| Majority | 105,156 | 54.66 | ||
| Turnout | 192,384 | |||
| Republican hold | ||||
1986
| Party | Candidate | Votes | % | |
|---|---|---|---|---|
| Republican | Olympia Snowe (Incumbent) | 167,226 | 66.21 | |
| Democratic | Kenneth P. Hayes | 85,346 | 33.79 | |
| Majority | 81,880 | 32.42 | ||
| Turnout | 252,572 | |||
| Republican hold | ||||
1990
| Party | Candidate | Votes | % | |
|---|---|---|---|---|
| Republican | Olympia Snowe (Incumbent) | 121,704 | 51.02 | |
| Democratic | Patrick K. McGowan | 116,798 | 48.97 | |
| write-ins | 20 | 0.01 | ||
| Majority | 4,906 | 2.06 | ||
| Turnout | 238,522 | |||
| Republican hold | ||||
1992
| Party | Candidate | Votes | % | |
|---|---|---|---|---|
| Republican | Olympia Snowe (Incumbent) | 153,022 | 49.13 | |
| Democratic | Patrick K. McGowan | 130,824 | 42.01 | |
| Green | Jonathan Carter | 27,526 | 8.84 | |
| write-ins | 61 | 0.02 | ||
| Majority | 22,198 | 7.13 | ||
| Turnout | 311,433 | |||
| Republican hold | ||||
1994
| Party | Candidate | Votes | % | |||
|---|---|---|---|---|---|---|
| Democratic | John Baldacci | 109,615 | 45.69 | |||
| Republican | Richard A. Bennett | 97,754 | 40.75 | |||
| Independent | John M. Michael | 21,117 | 8.80 | |||
| Green | Charles Fitzgerald | 11,353 | 4.73 | |||
| write-ins | 55 | 0.02 | ||||
| Majority | 11,861 | 4.94 | ||||
| Turnout | 239,894 | |||||
| Democratic gain from Republican | ||||||
1996
| Party | Candidate | Votes | % | |
|---|---|---|---|---|
| Democratic | John Baldacci (Incumbent) | 205,439 | 71.92 | |
| Republican | Paul R. Young | 70,856 | 24.81 | |
| Independent | Aldric Saucier | 9,294 | 3.25 | |
| write-ins | 47 | 0.02 | ||
| Majority | 134,583 | 47.12 | ||
| Turnout | 285,636 | |||
| Democratic hold | ||||
1998
| Party | Candidate | Votes | % | |
|---|---|---|---|---|
| Democratic | John Baldacci (Incumbent) | 146,202 | 76.20 | |
| Republican | Jonathan Reisman | 45,674 | 23.80 | |
| Majority | 100,528 | 52.39 | ||
| Turnout | 191,876 | |||
| Democratic hold | ||||
2000
| Party | Candidate | Votes | % | |
|---|---|---|---|---|
| Democratic | John Baldacci (Incumbent) | 219,783 | 73.43 | |
| Republican | Richard H. Campbell | 79,522 | 26.57 | |
| Majority | 140,261 | 46.86 | ||
| Turnout | 299,305 | |||
| Democratic hold | ||||
2002
| Party | Candidate | Votes | % | |
|---|---|---|---|---|
| Democratic | Mike Michaud | 116,868 | 52.01 | |
| Republican | Kevin Raye | 107,849 | 47.99 | |
| Total votes | 224,717 | 100.00 | ||
| Turnout | ||||
| Democratic hold | ||||
| Party | Candidate | Votes | % | |
|---|---|---|---|---|
| Democratic | Mike Michaud (incumbent) | 199,303 | 58.03 | |
| Republican | Brian Hamel | 135,547 | 39.47 | |
| Socialist Equality | Carl Cooley | 8,586 | 2.50 | |
| Total votes | 343,436 | 100.00 | ||
| Turnout | ||||
| Democratic hold | ||||
2006
| Party | Candidate | Votes | % | |
|---|---|---|---|---|
| Democratic | Mike Michaud (incumbent) | 179,732 | 70.52 | |
| Republican | L. Scott D'Amboise | 75,146 | 29.48 | |
| Total votes | 254,878 | 100.00 | ||
| Turnout | ||||
| Democratic hold | ||||
2008
| Party | Candidate | Votes | % | |
|---|---|---|---|---|
| Democratic | Mike Michaud (incumbent) | 226,274 | 67.44 | |
| Republican | John Frary | 109,268 | 32.57 | |
| Total votes | 335,542 | 100.00 | ||
| Turnout | ||||
| Democratic hold | ||||
| Party | Candidate | Votes | % | |
|---|---|---|---|---|
| Democratic | Mike Michaud (incumbent) | 147,042 | 55.13 | |
| Republican | Jason J. Levesque | 119,669 | 44.87 | |
| Total votes | 266,711 | 100.00 | ||
| Turnout | ||||
| Democratic hold | ||||
2012
| Party | Candidate | Votes | % | |
|---|---|---|---|---|
| Democratic | Mike Michaud (incumbent) | 191,456 | 58.2 | |
| Republican | Kevin Raye | 137,542 | 41.8 | |
| Total votes | 328,998 | 100.0 | ||
| Turnout | ||||
| Democratic hold | ||||
2014
| Party | Candidate | Votes | % | |
|---|---|---|---|---|
| Republican | Bruce Poliquin | 133,320 | 47.03 | |
| Democratic | Emily Ann Cain | 118,568 | 41.83 | |
| Independent | Blaine Richardson | 31,337 | 11.05 | |
| Others | 248 | 0.09 | ||
| Total votes | 283,473 | 100 | ||
| Turnout | ||||
| Republican gain from Democratic | ||||
2016
| Party | Candidate | Votes | % | |
|---|---|---|---|---|
| Republican | Bruce Poliquin (incumbent) | 192,878 | 54.77 | |
| Democratic | Emily Cain | 159,081 | 45.17 | |
| Libertarian | Jay Parker Dresser (Declared Write-In) | 224 | 0.06 | |
| Blank ballots | 12,703 | N/A | ||
| Total votes | 364,886 | 100 | ||
| Republican hold | ||||
2018
| Party | Candidate | Votes | % | |
|---|---|---|---|---|
| Republican | Bruce Poliquin (incumbent) | 134,184 | 46.33 | |
| Democratic | Jared Golden | 132,013 | 45.58 | |
| Independent | Tiffany L. Bond | 16,552 | 5.71 | |
| Independent | William R.S. Hoar | 6,875 | 2.37 | |
| Exhausted ballots (not included in total) |
6,453 | N/A | ||
| Total votes | 289,624 | 100 | ||
| Democratic | Jared Golden | 142,440 | 50.62 | |
| Republican | Bruce Poliquin (incumbent) | 138,931 | 49.38 | |
| Democratic gain from Republican | ||||
2020
| Party | Candidate | Votes | % | |
|---|---|---|---|---|
| Democratic | Jared Golden (incumbent) | 197,974 | 53.0 | |
| Republican | Dale Crafts | 175,228 | 46.9 | |
| Write-in | 33 | 0.0 | ||
| Total votes | 373,235 | 100.0 | ||
| Democratic hold | ||||
2022
| Party | Candidate | Votes | % | |
|---|---|---|---|---|
| Democratic | Jared Golden (incumbent) | 153,074 | 48.38 | |
| Republican | Bruce Poliquin | 141,260 | 44.65 | |
| Independent | Tiffany L. Bond | 21,655 | 6.84 | |
| Write-in | 393 | 0.12 | ||
| Total votes | 316,382 | 100 | ||
| Democratic | Jared Golden (incumbent) | 165,136 | 53.05 | |
| Republican | Bruce Poliquin | 146,142 | 46.95 | |
| Democratic hold | ||||
References
- The 2018 election was the first to use ranked-choice voting as opposed to plurality voting since the district's creation.
- "2022 Cook PVI: District Map and List". Cook Political Report. Retrieved January 10, 2023.
- "Congressional Districts – 113th Congress Demographics – Urban Rural Patterns". proximityone.com. Archived from the original on April 20, 2013. Retrieved September 12, 2015.
- Kate Taylor; Liam Stack (November 15, 2018). "Maine's Bruce Poliquin, Lone Republican in House From New England, Loses Re-election". The New York Times. Archived from the original on November 21, 2018. Retrieved November 21, 2018.
- Associated Press (2011). "Lawsuit aims to speed Maine redistricting". Bangor Daily News. Archived from the original on August 20, 2012. Retrieved December 17, 2012.
- Russell, Eric (2011). "After long partisan fight, redistricting deal keeps boundaries much the same". Bangor Daily News. Archived from the original on November 22, 2011. Retrieved December 17, 2012.
- "November 3, 2020 General Election". Maine Department of Secretary of State. Archived from the original on November 26, 2020. Retrieved November 24, 2020.
External links
- Martis, Kenneth C. (1989). The Historical Atlas of Political Parties in the United States Congress. New York: Macmillan Publishing Company.
- Martis, Kenneth C. (1982). The Historical Atlas of United States Congressional Districts. New York: Macmillan Publishing Company.
- Congressional Biographical Directory of the United States 1774–present
- Former Congressman Bruce Poliquin's web site
.jpg.webp)


.jpg.webp)
.jpg.webp)

.jpg.webp)
.jpg.webp)




.jpg.webp)
.jpg.webp)
.jpg.webp)

.jpg.webp)
.jpg.webp)
.jpg.webp)
.jpg.webp)
.jpg.webp)


.tif.png.webp)
