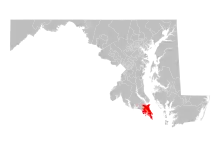
Maryland House of Delegates District 29B
Maryland House of Delegates District 29B is one of the 67 districts that compose the Maryland House of Delegates. Along with subdistricts 29A and 29C, it makes up the 29th district of the Maryland Senate. District 29B includes part of St. Mary's County, and is represented by one delegate.[1]
| Maryland's legislative district 29B | |
|---|---|
| Represents part of St. Mary's County | |
 | |
| Delegate(s) | Brian M. Crosby (D) |
| Registration |
|
| Demographics |
|
| Population (2020) | 44,620 |
| Voting-age population | 34,184 |
| Registered voters | 26,285 |
Demographic characteristics
As of the 2020 United States census, the district had a population of 44,620, of whom 34,184 (76.6%) were of voting age. The racial makeup of the district was 25,721 (57.6%) White, 10,841 (24.3%) African American, 193 (0.4%) Native American, 1,878 (4.2%) Asian, 32 (0.1%) Pacific Islander, 1,502 (3.4%) from some other race, and 4,429 (9.9%) from two or more races.[2][3] Hispanic or Latino of any race were 3,936 (8.8%) of the population.[4]
The district had 26,285 registered voters as of October 17, 2020, of whom 5,785 (22.0%) were registered as unaffiliated, 8,554 (32.5%) were registered as Republicans, 11,468 (43.6%) were registered as Democrats, and 265 (1.0%) were registered to other parties.[5]
Past Election Results
1990
| Name | Party | Votes | Percent | Outcome |
|---|---|---|---|---|
| J. Ernest Bell II | Democratic | 5,956 | 70.0% | Won[6][7] |
| O'Donnell | Republican | 2,590 | 30.0% | Lost |
1994
| Name | Party | Votes | Percent | Outcome |
|---|---|---|---|---|
| John F. Slade III | Democratic | 5,228 | 63.0% | Won[8] |
| Donald Lee O'Neal | Republican | 3,083 | 37.0% | Lost |
1998
| Name | Party | Votes | Percent | Outcome |
|---|---|---|---|---|
| John F. Slade III | Democratic | 6,327 | 66.0% | Won[9] |
| Donald Lee O'Neal | Republican | 3,316 | 34.0% | Lost |
2002
| Name | Party | Votes | Percent | Outcome |
|---|---|---|---|---|
| John L. Bohanan Jr. | Democratic | 6,340 | 58.8% | Won[10] |
| Joseph L. Dick | Republican | 4,434 | 41.2% | Lost |
| Other Write-Ins | 2 | 0.0% |
2006
| Name | Party | Votes | Percent | Outcome |
|---|---|---|---|---|
| John L. Bohanan Jr. | Democratic | 8,077 | 64.0% | Won[11] |
| Noel Temple Wood | Republican | 4,528 | 35.9% | Lost |
| Other Write-Ins | 8 | 0.1% |
2010
| Name | Party | Votes | Percent | Outcome |
|---|---|---|---|---|
| John L. Bohanan Jr. | Democratic | 7,654 | 52.4% | Won[12] |
| Erik Anderson | Republican | 6,946 | 47.5% | Lost |
| Other Write-Ins | 11 | 0.1% |
2014
| Name | Party | Votes | Percent | Outcome |
|---|---|---|---|---|
| Deb Rey | Republican | 5,334 | 50.3% | Won[13] |
| John L. Bohanan Jr. | Democratic | 5,258 | 49.6% | Lost |
| Other Write-Ins | 10 | 0.1% |
2018
| Name | Party | Votes | Percent | Outcome |
|---|---|---|---|---|
| Brian M. Crosby | Democratic | 7,351 | 53.4% | Won[14] |
| Deb Rey | Republican | 6,409 | 46.5% | Lost |
| Other Write-Ins | 16 | 0.1% |
List of delegates
| Delegate | Party | Years | Electoral history | Notes |
|---|---|---|---|---|
| J. Ernest Bell II | Democratic | 1983–1994 | Elected in 1990 | [6][15] |
| John F. Slade III | Democratic | 1995–2002 | Elected in 1994 and 1998 | [9] |
| John L. Bohanan Jr. | Democratic | 2003–2014 | Elected in 2002, 2006 and 2010. Lost election in 2014. | [10][11][12][13] |
| Deb Rey | Republican | 2015–2018 | Elected in 2014. Lost election in 2018. | [13][14] |
| Brian M. Crosby | Democratic | 2019–present | Elected in 2018. | [14] |
References
- "LEGISLATIVE DISTRICTING PLAN OF 2012 - LEGISLATIVE DISTRICT 29". Maryland State Archives. March 29, 2018. Archived from the original on December 10, 2021. Retrieved March 26, 2022.
- "RACE". United States Census Bureau. Archived from the original on October 16, 2021. Retrieved March 26, 2022.
- "RACE FOR THE POPULATION 18 YEARS AND OVER". United States Census Bureau. Archived from the original on October 16, 2021. Retrieved March 26, 2022.
- "HISPANIC OR LATINO, AND NOT HISPANIC OR LATINO BY RACE". United States Census Bureau. Archived from the original on October 16, 2021. Retrieved March 26, 2022.
- "2020 Presidential General Voter Registration Counts as of Close of Registration, By Legislative". Maryland State Archives. October 17, 2020. Archived from the original on April 24, 2021. Retrieved March 26, 2022.
- "House of Delegates, Legislative Districts 29, 29A, 29B, 29C (1975-1990)". Retrieved April 2, 2022.
- "Legislatives Races Outside the Baltimore Area". The Baltimore Sun. November 7, 1990. Retrieved April 2, 2022 – via Newspapers.com.

- "GENERAL ELECTION RETURNS - NOVEMBER 8, 1994". Archived from the original on December 10, 2021. Retrieved April 2, 2022.
- "1998 Gubernatorial Election". Archived from the original on July 27, 2021. Retrieved March 27, 2022.
- "2002 Gubernatorial Election". Archived from the original on July 27, 2021. Retrieved March 27, 2022.
- "Official 2006 Gubernatorial General Election results for Legislative District 29B". Archived from the original on July 20, 2021. Retrieved March 27, 2022.
- "2010 General Election Results". Archived from the original on July 3, 2021. Retrieved March 27, 2022.
- "2014 Election Results". Archived from the original on March 27, 2022. Retrieved March 27, 2022.
- "2018 Election Results". Archived from the original on May 14, 2021. Retrieved March 27, 2022.
- "House of Delegates, Legislative Districts 29, 29A, 29B, 29C (1975-1990)". Maryland Manual On-Line. Maryland State Archives. Retrieved April 2, 2022.