2012 Minnesota Senate election
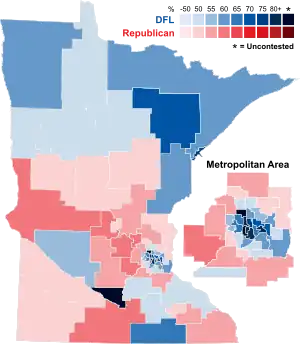
The 2012 Minnesota Senate election was held in the U.S. state of Minnesota on November 6, 2012, to elect members to the Senate of the 88th and 89th Minnesota Legislatures. A primary election was held in several districts on August 14, 2012.
| ||||||||||||||||||||||||||||||||||
All 67 seats in the Minnesota Senate 34 seats needed for a majority | ||||||||||||||||||||||||||||||||||
|---|---|---|---|---|---|---|---|---|---|---|---|---|---|---|---|---|---|---|---|---|---|---|---|---|---|---|---|---|---|---|---|---|---|---|
| ||||||||||||||||||||||||||||||||||
 | ||||||||||||||||||||||||||||||||||
| Elections in Minnesota |
|---|
 |
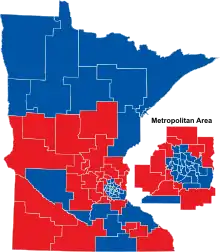
The Minnesota Democratic–Farmer–Labor Party (DFL) won a majority of seats, defeating the majority of the Republican Party of Minnesota.[1] This was the first election for the Republicans since it won a majority of seats in the 2010 election, its first since the return of partisan elections to the Senate in 1976. The new Legislature convened on January 8, 2013.
Primary election results
| District | Party | Candidates | Votes | % |
|---|---|---|---|---|
| 1 | Republican | Steve Nordhagen | 1,574 | 72.77 |
| Jual Carlson | 589 | 27.23 | ||
| DFL | LeRoy Stumpf | 3,218 | 100.00 | |
| 5 | Republican | John Carlson | 2,654 | 100.00 |
| DFL | Tom Saxhaug | 3,981 | 72.39 | |
| Laverne Pederson | 1,518 | 27.61 | ||
| 10 | Republican | Carrie Ruud | 2,350 | 100.00 |
| DFL | Taylor Stevenson | 2,873 | 57.38 | |
| Anne Marcotte | 2,134 | 42.62 | ||
| 13 | Republican | Michelle Fischbach | 1,484 | 90.27 |
| Fadumo Yusuf | 160 | 9.73 | ||
| DFL | Peggy Boeck | 765 | 100.00 | |
| 15 | Republican | Dave Brown | 1,725 | 100.00 |
| DFL | Sally Knox | 1,183 | 62.56 | |
| Ron Thiessen | 708 | 37.44 | ||
| 17 | Republican | Joe Gimse | 1,490 | 100.00 |
| DFL | Lyle Koenen | 3,019 | 57.20 | |
| Larry Rice | 2,259 | 42.80 | ||
| 20 | Republican | Mike Dudley | 2,590 | 86.62 |
| Gene Thomas Kornder | 400 | 13.38 | ||
| DFL | Kevin Dahle | 2,323 | 100.00 | |
| 30 | Republican | Mary Kiffmeyer | 1,620 | 73.44 |
| Paul Bolin | 586 | 26.56 | ||
| DFL | Paul Perovich | 806 | 100.00 | |
| 33 | Republican | David Osmek | 2,885 | 50.94 |
| Connie Doepke | 2,778 | 49.06 | ||
| DFL | Judy Rogosheske | 1,187 | 100.00 | |
| 39 | Republican | Karin Housley | 1,941 | 67.26 |
| Eric Michael Langness | 945 | 32.74 | ||
| DFL | Julie Bunn | 2,235 | 100.00 | |
| 40 | DFL | Chris Eaton | 2,005 | 81.01 |
| Timothy Davis | 470 | 18.99 | ||
| 45 | Republican | Blair Tremere | 978 | 54.36 |
| Timothy Hall | 821 | 45.64 | ||
| DFL | Ann Rest | 3,851 | 100.00 | |
| 46 | Republican | Paul Scofield | 544 | 56.43 |
| Roger Champagne | 420 | 43.57 | ||
| DFL | Ron Latz | 3,205 | 100.00 | |
| 47 | Republican | Julianne Ortman | 2,114 | 58.43 |
| Bruce Schwichtenberg | 1,504 | 41.57 | ||
| DFL | James Weygand | 824 | 100.00 | |
| 55 | Republican | Eric Pratt | 1,666 | 100.00 |
| DFL | Kathy Busch | 1,059 | 87.52 | |
| Josh Ondich | 151 | 12.48 | ||
| 57 | Republican | Pat Hall | 1,937 | 100.00 |
| DFL | Greg Clausen | 1,456 | 78.66 | |
| Mike Germain | 395 | 21.34 | ||
| 64 | Republican | Sharon Anderson | 632 | 100.00 |
| DFL | Dick Cohen | 5,797 | 89.43 | |
| Alexander Jeffries | 685 | 10.57 | ||
| 67 | Republican | Mike Capistrant | 425 | 100.00 |
| DFL | Foung Hawj | 2,142 | 44.21 | |
| Robert Humphrey | 1,897 | 39.15 | ||
| Tom Dimond | 806 | 16.64 |
Source: Minnesota Secretary of State[2]
General election
Opinion polling
| Polling firm/client | Polling period | Sample size |
Margin of error (pp) |
Republican | DFL | Independence | Other | Undecided |
|---|---|---|---|---|---|---|---|---|
| SurveyUSA/KSTP-TV | November 1–3, 2012 | 556 LV | ±4.2 | 40% | 48% | 6% | 6% | 1% |
| SurveyUSA/KSTP-TV | October 26–28, 2012 | 574 LV | ±4.2 | 40% | 45% | 8% | 6% | 1% |
| SurveyUSA/KSTP-TV | October 12–14, 2012 | 550 LV | ±4.3 | 36% | 45% | 8% | 3% | 9% |
| Public Policy Polling | October 5–8, 2012 | 937 LV | ±3.2 | 40% | 52% | — | — | 8% |
| Public Policy Polling | September 10–11, 2012 | 824 LV | ±3.4 | 44% | 47% | — | — | 9% |
| SurveyUSA/KSTP-TV | September 6–9, 2012 | 551 LV | ±4.3 | 38% | 45% | 6% | 3% | 9% |
| SurveyUSA/KSTP-TV | July 17–19, 2012 | 552 LV | ±4.3 | 40% | 45% | 8% | 2% | 6% |
| Public Policy Polling | May 31 – June 3, 2012 | 973 | ±3.1 | 36% | 48% | — | — | 16% |
| Public Policy Polling | January 21–22, 2012 | 1,236 | ±2.8 | 39% | 48% | — | — | 14% |
| Public Policy Polling Archived 2013-05-12 at the Wayback Machine | May 27–30, 2011 | 1,179 | ±2.9 | 40% | 49% | — | — | 11% |
Results

Districts won
| Party | Candidates | Votes | Seats | |||||
|---|---|---|---|---|---|---|---|---|
| No. | % | ∆pp | No. | ∆No. | % | |||
| Minnesota Democratic–Farmer–Labor Party | 67 | 1,532,065 | 55.83 | 39 | 58.21 | |||
| Republican Party of Minnesota | 63 | 1,193,356 | 43.49 | 28 | 41.79 | |||
| Independence Party of Minnesota | 2 | 6,102 | 0.22 | 0 | 0.00 | |||
| Independent | 1 | 5,196 | 0.19 | 0 | 0.00 | |||
| Write-in | N/A | 7,251 | 0.26 | 0 | 0.00 | |||
| Total | 2,743,970 | 100.00 | ±0.00 | 67 | ±0 | 100.00 | ||
| Invalid/blank votes | 206,810 | 7.01 | ||||||
| Turnout (out of 3,861,043 eligible voters)[3] | 2,950,780 | 76.42 | ||||||
| Source: Minnesota Secretary of State,[4] Minnesota Legislative Reference Library[5] | ||||||||
District results
| District | Candidates | Party | Votes | % | Winner Party |
|---|---|---|---|---|---|
| 1 | LeRoy Stumpf | DFL | 22,298 | 60.59 | DFL |
| Steve Nordhagen | Republican | 14,475 | 39.33 | ||
| 2 | Rod Skoe | DFL | 21,269 | 54.92 | DFL |
| Dennis Moser | Republican | 17,423 | 44.99 | ||
| 3 | Tom Bakk | DFL | 28,427 | 64.59 | DFL |
| Jennifer Havlick | Republican | 15,509 | 35.24 | ||
| 4 | Kent Eken | DFL | 19,833 | 52.17 | DFL |
| Phil Hansen | Republican | 18,132 | 47.70 | ||
| 5 | Tom Saxhaug | DFL | 21,301 | 52.33 | DFL |
| John Carlson | Republican | 19,362 | 47.56 | ||
| 6 | David Tomassoni | DFL | 30,882 | 71.58 | DFL |
| Brandon Anderson | Republican | 12,220 | 28.32 | ||
| 7 | Roger Reinert | DFL | 32,684 | 76.90 | DFL |
| Tyler Verry | Republican | 9,621 | 22.64 | ||
| 8 | Bill Ingebrigtsen | Republican | 22,693 | 52.86 | Republican |
| Dan Skogen | DFL | 20,197 | 47.04 | ||
| 9 | Paul Gazelka | Republican | 20,527 | 53.65 | Republican |
| Al Doty | DFL | 17,687 | 46.22 | ||
| 10 | Carrie Ruud | Republican | 22,848 | 53.88 | Republican |
| Taylor Stevenson | DFL | 19,490 | 45.96 | ||
| 11 | Tony Lourey | DFL | 24,342 | 64.22 | DFL |
| Bill Saumer | Republican | 13,505 | 35.63 | ||
| 12 | Torrey Westrom | Republican | 25,279 | 61.49 | Republican |
| John Schultz | DFL | 15,801 | 38.44 | ||
| 13 | Michelle Fischbach | Republican | 26,015 | 63.53 | Republican |
| Peggy Boeck | DFL | 14,871 | 36.32 | ||
| 14 | John Pederson | Republican | 19,351 | 52.47 | Republican |
| Jerry McCarter | DFL | 17,434 | 47.27 | ||
| 15 | Dave Brown | Republican | 21,917 | 56.55 | Republican |
| Sally Knox | DFL | 16,787 | 43.31 | ||
| 16 | Gary Dahms | Republican | 20,922 | 53.01 | Republican |
| Ted Suss | DFL | 18,496 | 46.87 | ||
| 17 | Lyle Koenen | DFL | 21,621 | 55.40 | DFL |
| Joe Gimse | Republican | 17,350 | 44.46 | ||
| 18 | Scott Newman | Republican | 22,556 | 58.15 | Republican |
| Steven Schiroo | DFL | 16,180 | 41.71 | ||
| 19 | Kathy Sheran | DFL | 33,291 | 97.52 | DFL |
| 20 | Kevin Dahle | DFL | 20,627 | 50.02 | DFL |
| Mike Dudley | Republican | 20,556 | 49.85 | ||
| 21 | Matt Schmit | DFL | 21,937 | 52.43 | DFL |
| John Howe | Republican | 19,846 | 47.44 | ||
| 22 | Bill Weber | Republican | 19,548 | 52.76 | Republican |
| Alan Oberloh | DFL | 17,457 | 47.11 | ||
| 23 | Julie Rosen | Republican | 25,838 | 63.97 | Republican |
| Paul Marquardt | DFL | 14,516 | 35.94 | ||
| 24 | Vicki Jensen | DFL | 19,248 | 52.60 | DFL |
| Vern Swedin | Republican | 17,286 | 47.23 | ||
| 25 | Dave Senjem | Republican | 22,299 | 53.72 | Republican |
| Judy Ohly | DFL | 19,149 | 46.13 | ||
| 26 | Carla Nelson | Republican | 22,263 | 55.62 | Republican |
| Kenneth Moen | DFL | 17,692 | 44.20 | ||
| 27 | Dan Sparks | DFL | 26,552 | 68.22 | DFL |
| Linden Anderson | Republican | 12,334 | 31.69 | ||
| 28 | Jeremy Miller | Republican | 23,122 | 57.12 | Republican |
| Jack Krage | DFL | 17,303 | 42.74 | ||
| 29 | Bruce Anderson | Republican | 24,486 | 60.56 | Republican |
| Brian Doran | DFL | 15,867 | 39.25 | ||
| 30 | Mary Kiffmeyer | Republican | 25,205 | 62.41 | Republican |
| Paul Perovich | DFL | 15,125 | 37.45 | ||
| 31 | Michelle Benson | Republican | 24,774 | 58.64 | Republican |
| Mike Starr | DFL | 17,423 | 41.24 | ||
| 32 | Sean Nienow | Republican | 21,955 | 54.25 | Republican |
| Jeske Noordergraaf | DFL | 18,450 | 45.59 | ||
| 33 | David Osmek | Republican | 28,195 | 58.92 | Republican |
| Judy Rogosheske | DFL | 19,547 | 40.85 | ||
| 34 | Warren Limmer | Republican | 25,847 | 57.04 | Republican |
| Sharon Bahensky | DFL | 19,406 | 42.83 | ||
| 35 | Branden Petersen | Republican | 22,874 | 54.21 | Republican |
| Peter Perovich | DFL | 19,253 | 45.63 | ||
| 36 | John Hoffman | DFL | 22,194 | 53.10 | DFL |
| Benjamin Kruse | Republican | 19,522 | 46.71 | ||
| 37 | Alice Johnson | DFL | 22,814 | 53.23 | DFL |
| Pam Wolf | Republican | 19,962 | 46.57 | ||
| 38 | Roger Chamberlain | Republican | 23,817 | 53.22 | Republican |
| Timothy Henderson | DFL | 20,849 | 46.59 | ||
| 39 | Karin Housley | Republican | 23,385 | 50.62 | Republican |
| Julie Bunn | DFL | 22,754 | 49.25 | ||
| 40 | Chris Eaton | DFL | 25,165 | 96.93 | DFL |
| 41 | Barb Goodwin | DFL | 25,842 | 62.82 | DFL |
| Gina Bauman | Republican | 15,200 | 36.95 | ||
| 42 | Bev Scalze | DFL | 25,607 | 55.57 | DFL |
| April King | Republican | 20,400 | 44.27 | ||
| 43 | Chuck Wiger | DFL | 26,767 | 62.25 | DFL |
| Duane Johnson | Republican | 16,137 | 37.53 | ||
| 44 | Terri Bonoff | DFL | 27,203 | 55.81 | DFL |
| David Gaither | Republican | 21,464 | 44.04 | ||
| 45 | Ann Rest | DFL | 28,608 | 65.45 | DFL |
| Blair Tremere | Republican | 15,036 | 34.40 | ||
| 46 | Ron Latz | DFL | 29,755 | 66.82 | DFL |
| Paul Scofield | Republican | 14,680 | 32.97 | ||
| 47 | Julianne Ortman | Republican | 27,128 | 63.76 | Republican |
| James Weygand | DFL | 15,297 | 35.96 | ||
| 48 | David Hann | Republican | 23,730 | 51.32 | Republican |
| Laurie McKendry | DFL | 22,459 | 48.58 | ||
| 49 | Melisa Franzen | DFL | 26,893 | 52.74 | DFL |
| Keith Downey | Republican | 24,045 | 47.15 | ||
| 50 | Melissa Halvorson Wiklund | DFL | 25,300 | 60.85 | DFL |
| Vern Wilcox | Republican | 16,193 | 38.95 | ||
| 51 | Jim Carlson | DFL | 23,969 | 53.09 | DFL |
| Ted Daley | Republican | 21,096 | 46.73 | ||
| 52 | James Metzen | DFL | 27,149 | 62.00 | DFL |
| Dwight Rabuse | Republican | 16,542 | 37.78 | ||
| 53 | Susan Kent | DFL | 22,781 | 52.13 | DFL |
| Ted Lillie | Republican | 20,857 | 47.73 | ||
| 54 | Katie Sieben | DFL | 26,998 | 63.80 | DFL |
| Janis Quinlan | Republican | 15,256 | 36.05 | ||
| 55 | Eric Pratt | Republican | 22,254 | 55.11 | Republican |
| Kathy Busch | DFL | 18,070 | 44.75 | ||
| 56 | Dan Hall | Republican | 22,226 | 53.92 | Republican |
| Leon Thurman | DFL | 18,922 | 45.90 | ||
| 57 | Greg Clausen | DFL | 23,890 | 54.09 | DFL |
| Pat Hall | Republican | 20,199 | 45.73 | ||
| 58 | Dave Thompson | Republican | 24,097 | 57.60 | Republican |
| Andrew Brobston | DFL | 17,686 | 42.28 | ||
| 59 | Bobby Joe Champion | DFL | 28,441 | 82.02 | DFL |
| Jim Lilly | Republican | 6,082 | 17.54 | ||
| 60 | Kari Dziedzic | DFL | 29,014 | 77.06 | DFL |
| Mark Lazarchic | Republican | 6,400 | 17.00 | ||
| Rahn Workcuff | Independence | 2,077 | 5.52 | ||
| 61 | Scott Dibble | DFL | 41,075 | 98.08 | DFL |
| 62 | Jeff Hayden | DFL | 27,516 | 86.84 | DFL |
| Eric Blair | Independence | 4,025 | 12.70 | ||
| 63 | Patricia Torres Ray | DFL | 36,866 | 80.81 | DFL |
| Patrick Marron | Republican | 8,636 | 18.93 | ||
| 64 | Dick Cohen | DFL | 33,008 | 69.67 | DFL |
| Sharon Anderson | Republican | 9,069 | 19.14 | ||
| Scott Larson | Independent | 5,196 | 10.97 | ||
| 65 | Sandy Pappas | DFL | 27,365 | 81.72 | DFL |
| Rick Karschnia | Republican | 5,998 | 17.91 | ||
| 66 | John Marty | DFL | 27,735 | 73.82 | DFL |
| Wayde Brooks | Republican | 9,718 | 25.87 | ||
| 67 | Foung Hawj | DFL | 21,630 | 72.46 | DFL |
| Mike Capistrant | Republican | 8,094 | 27.11 |
See also
References
- Brooks, Jennifer (November 7, 2012). "DFLers end GOP control in Legislature after two years". Star Tribune. Retrieved November 30, 2012.
- "Results for All State Senate Races". Minnesota Secretary of State. Retrieved February 18, 2014.
- "Minnesota election statistics 1950-2014" (PDF). Minnesota Secretary of State. Retrieved August 13, 2016.
- "Results for All State Senate Races". Minnesota Secretary of State. Retrieved December 6, 2012.
- "Party Control of the Minnesota Senate, 1951-present". Minnesota Legislative Reference Library. Retrieved December 6, 2012.
External links
This article is issued from Wikipedia. The text is licensed under Creative Commons - Attribution - Sharealike. Additional terms may apply for the media files.

.jpg.webp)