Myrtle Beach metropolitan area
The Myrtle Beach metropolitan area (also Myrtle Beach-Conway-North Myrtle Beach, SC Metropolitan Statistical Area) is a census-designated metropolitan statistical area consisting of Horry County in South Carolina. The wider Myrtle Beach CSA includes Georgetown County, South Carolina. From 2013 to 2023, Brunswick County, North Carolina was included in the MSA. In 2023, it was moved to the Wilmington, NC Metropolitan Statistical Area, where is was originally located before 2013.[2][3] The region's primary cities, in order by population are Myrtle Beach, South Carolina; Conway, South Carolina; North Myrtle Beach, South Carolina and Georgetown, South Carolina.
Myrtle Beach metropolitan area | |
|---|---|
| Myrtle Beach-Conway-North Myrtle Beach, SC Metropolitan Statistical Area | |
 | |
| Coordinates: 33°35′20″N 79°03′18″W | |
| Country | United States |
| State(s) | South Carolina, North Carolina |
| Largest city | Myrtle Beach |
| Other cities | - Conway - North Myrtle Beach - Georgetown - Loris |
| Population (2010)[1] | |
| • Total | 487,722 |
| • Rank | 114th in the U.S. |
Area
Myrtle Beach metropolitan area
| County | 2021 Estimate | 2020 Census | Change |
|---|---|---|---|
| Horry County | 365,579 | 351,029 | +4.14% |
| Brunswick County[lower-alpha 1] | 144,215 | 136,693 | +5.50% |
| Georgetown County | 63,921 | 63,404 | +0.82% |
| Total | 573,715 | 551,126 | +4.10% |
Largest cities and towns
| Rank | City / town | County | 2021 Estimate | 2020 Census | Change |
|---|---|---|---|---|---|
| 1 | Myrtle Beach | Horry County | 37,100 | 35,682 | +3.97% |
| 2 | Leland[lower-alpha 1] | Brunswick County | 25,974 | 22,908 | +13.38% |
| 3 | Conway | Horry County | 23,119 | 24,849 | −6.96% |
| 4 | North Myrtle Beach | Horry County | 19,485 | 18,790 | +3.70% |
| 5 | Oak Island[lower-alpha 1] | Brunswick County | 8,878 | 8,396 | +5.74% |
| 6 | Georgetown | Georgetown County | 8,333 | 8,403 | −0.83% |
| 7 | St. James[lower-alpha 1] | Brunswick County | 6,913 | 6,529 | +5.88% |
| 8 | Boiling Spring Lakes[lower-alpha 1] | Brunswick County | 6,168 | 5,943 | +3.79% |
| 9 | Carolina Shores[lower-alpha 1] | Brunswick County | 4,763 | 4,588 | +3.81% |
| 10 | Surfside Beach | Horry County | 4,253 | 4,155 | +2.36% |
Demographics
| Year | Population[4] | Growth | Counties Included |
|---|---|---|---|
| 1970 | 69,992 | --- | Horry, Georgetown |
| 1980 | 101,419 | 44.90% | Horry, Georgetown |
| 1990 | 144,053 | 42.04% | Horry, Georgetown |
| 2000 | 196,629 | 36.50% | Horry, Georgetown |
| 2010 | 329,449 | 67.50% | Horry, Georgetown |
| 2013 | 465,391[5] | 41.27% | Horry, Georgetown and Brunswick[lower-alpha 1] |
See also
References
- Archived October 16, 2013, at the Wayback Machine
- Still, Johanna F. (July 21, 2023). "Brunswick back in Wilmington MSA". WilmingtonBiz. Retrieved July 26, 2023.
- "OMB Bulletin No. 23-01: Revised Delineations of Metropolitan Statistical Areas, Micropolitan Statistical Areas, and Combined Statistical Areas, and Guidance on Uses of the Delineations of These Areas" (PDF). United States Office of Management and Budget. July 21, 2023. Retrieved August 10, 2023.
- "Myrtle Beach-Conway-North Myrtle Beach, SC Metropolitan Statistical Area (CBSA) Population and Components of Change". Archived from the original on 2009-02-18. Retrieved 2009-06-21.
- "Annual Estimates of the Population of Combined Statistical Areas: April 1, 2000 to July 1, 2006 (CBSA-EST2006-02)". 2006 Population Estimates. United States Census Bureau, Population Division. 2007-04-05. Archived from the original (CSV) on 2007-09-14. Retrieved 2007-04-09.
Municipalities and communities of Horry County, South Carolina, United States | ||
|---|---|---|
| Cities | 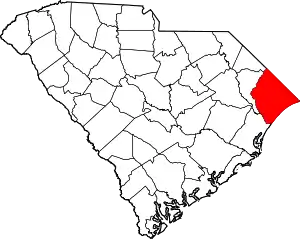 Map of South Carolina highlighting Horry County | |
| Towns | ||
| CDPs | ||
| Other communities | ||
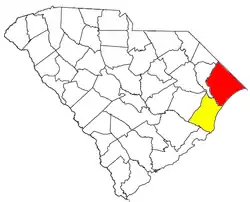
Municipalities and communities of Georgetown County, South Carolina, United States | ||
|---|---|---|
| City |  Map of South Carolina highlighting Georgetown County | |
| Towns | ||
| CDPs | ||
| Other communities | ||
| Footnotes | ‡This populated place also has portions in an adjacent county or counties | |
Municipalities and communities of Brunswick County, North Carolina, United States | ||
|---|---|---|
| Cities | 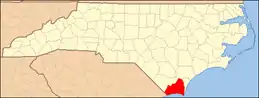 | |
| Towns | ||
| Village | ||
| Townships |
| |
| Unincorporated communities | ||
This article is issued from Wikipedia. The text is licensed under Creative Commons - Attribution - Sharealike. Additional terms may apply for the media files.