New York's 21st congressional district
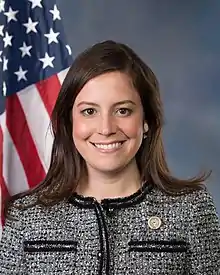
New York's 21st congressional district is a congressional district for the United States House of Representatives that is currently represented by Republican Elise Stefanik.
| New York's 21st congressional district | |||
|---|---|---|---|
Interactive map of district boundaries since January 3, 2023 | |||
| Representative |
| ||
| Distribution |
| ||
| Population (2022) | 776,361[1] | ||
| Median household income | $66,565[2] | ||
| Ethnicity |
| ||
| Cook PVI | R+9[3] | ||
The district is rural and it includes the cities of Ogdensburg, Glens Falls, Plattsburgh, and Watertown. The district includes most of the Adirondack Mountains and the Thousand Islands region. It borders Vermont to the east and Canada to the north. It also includes Fort Drum of the U.S. Army.
History
From 2003 to 2013, the district with that number contained most of the Capital District of New York. It included all or parts of Albany, Fulton, Montgomery, Rensselaer, Saratoga, Schenectady, and Schoharie counties. It contained the cities of Albany, Schenectady, Troy, Amsterdam, Cohoes, Watervliet, Gloversville, and Johnstown. Up until 1980, the 21st district was located in Upper Manhattan (including parts of Harlem and Washington Heights), and The Bronx.
From 2013 to present: Clinton, Essex, Franklin, Fulton, Hamilton, Herkimer, Lewis, Montgomery, Schoharie, St. Lawrence, Warren, and Washington counties, and parts of Jefferson, Otsego, and Rensselaer counties.
Recent statewide election results
| Year | Office | Results |
|---|---|---|
| 1992 | President | Clinton 48–34% |
| 1996 | President | Clinton 57–30% |
| 2000 | President | G. W. Bush 56–39% |
| 2004 | President | G. W. Bush 55–43% |
| 2008 | President | Obama 58–40% |
| 2012 | President | Obama 52–46% |
| 2016 | President | Trump 54–40% |
| 2020 | President | Trump 54–43% |
List of members representing the district
1813–1821: two seats
From the creation of the district in 1813 to 1821, two seats were apportioned, elected at-large on a general ticket.
1821–present: one seat
Recent election results
In New York State electoral politics there are numerous minor parties at various points on the political spectrum. Certain parties will invariably endorse either the Republican or Democratic candidate for every office, hence the state electoral results contain both the party votes, and the final candidate votes (Listed as "Recap").
| Party | Candidate | Votes | % | ±% | |
|---|---|---|---|---|---|
| Democratic | Michael R. McNulty (incumbent) | 158,491 | 66.1 | ||
| Republican | Nancy Norman | 64,471 | 26.9 | ||
| Liberal | Lee H. Wasserman | 16,794 | 7.0 | ||
| Margin of victory | 94,020 | 39.2 | |||
| Turnout | 239,756 | 100 | |||
| Party | Candidate | Votes | % | ±% | |
|---|---|---|---|---|---|
| Democratic | Michael R. McNulty (incumbent) | 146,729 | 74.2 | +8.1 | |
| Republican | Lauren Ayers | 50,931 | 25.8 | −1.1 | |
| Margin of victory | 95,798 | 48.5 | +9.3 | ||
| Turnout | 197,660 | 100 | −17.6 | ||
| Party | Candidate | Votes | % | ±% | |
|---|---|---|---|---|---|
| Democratic | Michael R. McNulty (incumbent) | 175,339 | 74.4 | +0.2 | |
| Republican | Thomas G. Pillsworth | 60,333 | 25.6 | −0.2 | |
| Margin of victory | 115,006 | 48.8 | +0.3 | ||
| Turnout | 235,672 | 100 | +19.2 | ||
| Party | Candidate | Votes | % | ±% | |
|---|---|---|---|---|---|
| Democratic | Michael R. McNulty (incumbent) | 161,329 | 75.1 | +0.7 | |
| Republican | Charles B. Rosenstein | 53,525 | 24.9 | −0.7 | |
| Margin of victory | 107,804 | 50.2 | +1.4 | ||
| Turnout | 214,854 | 100 | −8.8 | ||
| Party | Candidate | Votes | % | ±% | |
|---|---|---|---|---|---|
| Democratic | Michael R. McNulty (incumbent) | 194,033 | 70.8 | −4.3 | |
| Republican | Warren Redlich | 80,121 | 29.2 | +4.3 | |
| Margin of victory | 113,912 | 41.6 | -8.6 | ||
| Turnout | 274,154 | 100 | +27.6 | ||
| Party | Candidate | Votes | % | ±% | |
|---|---|---|---|---|---|
| Democratic | Michael R. McNulty (incumbent) | 167,604 | 78.2 | +7.4 | |
| Republican | Warren Redlich | 46,752 | 21.8 | −7.4 | |
| Margin of victory | 120,852 | 56.4 | +14.8 | ||
| Turnout | 214,356 | 100 | −21.8 | ||
| Party | Candidate | Votes | % | ±% | |
|---|---|---|---|---|---|
| Democratic | Paul D. Tonko | 105,313 | 61.8 | −16.4 | |
| Republican | Jim Burhmaster | 57,086 | 35.4 | +13.6 | |
| Independence | Philip Steck | 5,025 | 2.8 | +2.8 | |
| Margin of victory | 43,202 | 23.6 | −32.8 | ||
| Turnout | 167,424 | 100 | −12.9 | ||
| Party | Candidate | Votes | % | ±% | |
|---|---|---|---|---|---|
| Democratic | Paul D. Tonko (incumbent) | 124,889 | 56.9 | −4.9 | |
| Republican | Theodore J. Danz Jr. | 85,752 | 43.1 | +7.7 | |
| Margin of victory | 39,137 | 13.8 | −9.8 | ||
| Turnout | 219,425 | 100 | +31.1 | ||
| Party | Candidate | Votes | % | ±% | |
|---|---|---|---|---|---|
| Democratic | Bill Owens | 126,631 | 47.1 | −9.8 | |
| Republican | Matt Doheny | 121,646 | 45.3 | +2.2 | |
| Green | Donald L. Hassig | 4,174 | 1.6 | +1.6 | |
| Margin of victory | 4,985 | 1.8 | −12 | ||
| Turnout | 268,784 | 100 | +22.5 | ||
| Party | Candidate | Votes | % | ±% | |
|---|---|---|---|---|---|
| Republican | Elise Stefanik | 96,226 | 53.0 | +7.7 | |
| Democratic | Aaron G. Woolf | 53,140 | 29.3 | −17.8 | |
| Green | Matthew J. Funiciello | 19,238 | 10.6 | +9 | |
| Margin of victory | 43,086 | 23.7 | +21.9 | ||
| Turnout | 181,558 | 100 | −32.5 | ||
| Party | Candidate | Votes | % | ±% | |
|---|---|---|---|---|---|
| Republican | Elise Stefanik (incumbent) | 177,886 | 65.3 | +12.3 | |
| Democratic | Mike Derrick | 82,161 | 30.2 | +0.9 | |
| Green | Matthew J. Funiciello | 12,452 | 4.6 | −6 | |
| Margin of victory | 95,725 | 35.1 | +11.4 | ||
| Turnout | 272,499 | 100 | +50.1 | ||
| Party | Candidate | Votes | % | ±% | |
|---|---|---|---|---|---|
| Republican | Elise Stefanik (incumbent) | 131,981 | 56.1 | −9.2 | |
| Democratic | Tedra Cobb | 99,791 | 42.4 | +12.2 | |
| Green | Lynn Kahn | 3,437 | 1.5 | −3.1 | |
| Margin of victory | 32,190 | 13.7 | −61 | ||
| Turnout | 235,209 | 100 | −13.7 | ||
| Party | Candidate | Votes | % | ±% | |
|---|---|---|---|---|---|
| Republican | Elise Stefanik (incumbent) | 188,649 | 58.8 | +2.7 | |
| Democratic | Tedra Cobb | 131,992 | 41.1 | −1.3 | |
| Margin of victory | 56,657 | 17.7 | +4.0 | ||
| Turnout | 320,779 | 100 | +36.4 | ||
| Party | Candidate | Votes | % | |
|---|---|---|---|---|
| Republican | Elise Stefanik | 148,068 | 52.32% | |
| Conservative | Elise Stefanik | 17,566 | 6.21% | |
| Total | Elise Stefanik (Incumbent) | 165,634 | 58.53% | |
| Democratic | Matt Castelli | 109,600 | 38.73% | |
| Moderate Party | Matt Castelli | 3,655 | 1.29% | |
| Total | Matt Castelli | 113,255 | 40.02% | |
| Write-in | 4,099 | 1.45% | ||
| Total votes | 282,988 | 100% | ||
See also
References
Inline references
- "Congressional District 21 (118th Congress), New York: People; Source: 2022 ACS", U.S. Census Bureau. Retrieved 2023-10-05.
- "Congressional District 21 (118th Congress), New York: Socio-Economic; Source: 2022 ACS", U.S. Census Bureau. Retrieved 2023-10-05.
- "2022 Cook PVI: District Map and List". Cook Political Report. Retrieved January 10, 2023.
- Stanforth, Lauren; Carol DeMare (November 5, 2008). "Tonko cruises to win in 21st Congressional District". Times Union (Albany). Retrieved December 6, 2008.
- Neuman, William (November 5, 2008). "Election Results 2008: New York". The New York Times. Retrieved December 6, 2008.
- "2022 General Election Results — Certified December 15, 2022". New York State Board of Elections. Archived from the original on December 30, 2022. Retrieved December 30, 2022.
Bibliography
- Martis, Kenneth C. (1989). The Historical Atlas of Political Parties in the United States Congress. New York: Macmillan Publishing Company.
- Martis, Kenneth C. (1982). The Historical Atlas of United States Congressional Districts. New York: Macmillan Publishing Company.
- Congressional Biographical Directory of the United States 1774–present
- OpenSecrets.org-21st Congressional District candidates 2008 campaign contributions for each candidate
- 2014 election data
- 2012 election data
- 2010 election data
- 2004 House election data Clerk of the House of Representatives
- 2002 House election data Clerk of the House of Representatives
- 2000 House election data Clerk of the House of Representatives
- 1998 House election data Clerk of the House of Representatives
- 1996 House election data Clerk of the House of Representatives
.jpg.webp)
.jpg.webp)
.jpg.webp)
.jpg.webp)




.jpg.webp)
.jpg.webp)




.tif.png.webp)
_(since_2023).svg.png.webp)