New York's 5th congressional district
New York's 5th congressional district is a congressional district for the United States House of Representatives, represented by Democrat Gregory Meeks. The district is located in Queens. A plurality of the district's population is African-American, and a majority of the district's population is non-white.
| New York's 5th congressional district | |||
|---|---|---|---|
Interactive map of district boundaries since January 3, 2023 | |||
| Representative |
| ||
| Distribution |
| ||
| Population (2022) | 751,997[1] | ||
| Median household income | $81,621[2] | ||
| Ethnicity |
| ||
| Cook PVI | D+30[3] | ||
The district includes the entire Rockaway Peninsula as well as the Queens neighborhoods of Broad Channel, Cambria Heights, Hollis, Howard Beach, Jamaica, Kew Gardens, Laurelton, Queens Village, Richmond Hill, Rosedale, Saint Albans, Springfield Gardens, and South Ozone Park, as well as John F. Kennedy International Airport.
Recent statewide election results
| Year | Office | Results |
|---|---|---|
| 1992 | President | Clinton 52–35% |
| 1996 | President | Clinton 60–32% |
| 2000 | President | Gore 67–30% |
| 2004 | President | Kerry 63–36% |
| 2008 | President | Obama 63–36% |
| 2012 | President | Obama 91–9% |
| 2016 | President | Clinton 86–13% |
| 2020 | President | Biden 83–16% |
History
1789–1913:
- Parts of Manhattan
1913–45:
- Parts of Brooklyn
1945–63:
- Parts of Queens
1963–93:
- Parts of Nassau
1993–2003:
2003–2023:
2023—:
- Parts of Queens
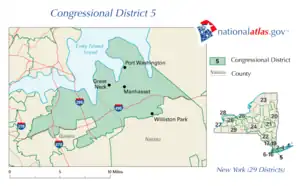
Various New York districts have been numbered "5" over the years, including areas in New York City and various parts of upstate New York. From 2003–13, the district consisted of northeastern Queens County and northwestern Nassau County. The Queens portion of the district included the neighborhoods of Bayside, Corona, Douglaston, Flushing, Jamaica Estates, Little Neck, and Whitestone. The Nassau portion of the district included Albertson, Great Neck, Manhasset, Port Washington, Roslyn, and Sands Point.
.tif.png.webp)
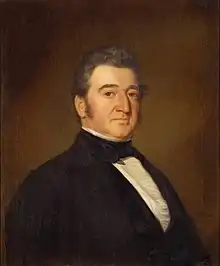
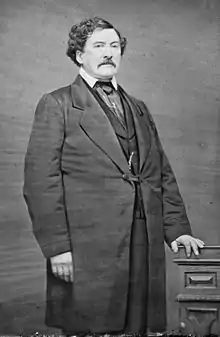
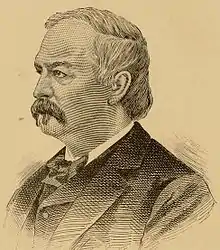
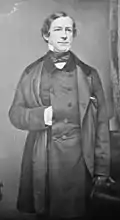
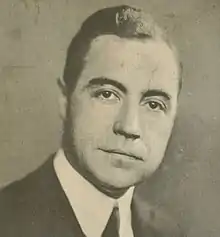
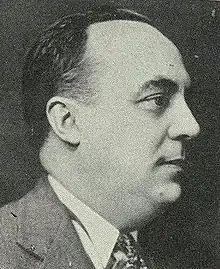
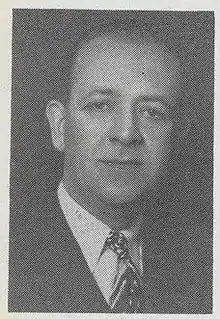
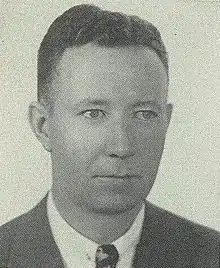
List of members representing the district
Prior to 1992 the 5th District was centered on the south shore of Nassau County including towns mostly now in the 3rd and 4th District. The Queens portions of the 5th had been previously primarily in the 8th District of the 1980s. In general, the present 5th District greatly mirrors the 6th District from 1972 to 1982. The 1990s version of this district included northeast Nassau and northwest Suffolk counties; these areas were placed in the 2nd and 3rd District in 2002 and the 5th District gained areas in Queens formerly in the 18th District.
Election results
Note that in New York State electoral politics there are numerous minor parties at various points on the political spectrum. Certain parties normally endorse either the Republican or Democratic candidate for every office, hence the state electoral results contain both the party votes, and the final candidate votes (Listed as "Recap").
| Party | Candidate | Votes | % | |
|---|---|---|---|---|
| Democratic | Gregory Meeks (incumbent) | 229,125 | 100.0 | |
| Total votes | 229,125 | 100.0 | ||
| Democratic hold | ||||
| Party | Candidate | Votes | % | |
|---|---|---|---|---|
| Democratic | Gregory Meeks (incumbent) | 160,500 | 100.0 | |
| Total votes | 160,500 | 100.0 | ||
| Democratic hold | ||||
| Party | Candidate | Votes | % | |
|---|---|---|---|---|
| Democratic | Gregory Meeks | 197,591 | 84.7 | |
| Women's Equality | Gregory Meeks | 1,961 | 0.8 | |
| Total | Gregory Meeks (incumbent) | 199,552 | 85.5 | |
| Republican | Michael A. O'Reilly | 26,741 | 11.5 | |
| Conservative | Michael A. O'Reilly | 3,516 | 1.5 | |
| Total | Michael A. O'Reilly | 30,257 | 13.0 | |
| Green | Frank Francois | 3,583 | 1.5 | |
| Total votes | 233,392 | 100.0 | ||
| Democratic hold | ||||
| Party | Candidate | Votes | % | |
|---|---|---|---|---|
| Democratic | Gregory Meeks (incumbent) | 75,712 | 95.1 | |
| Allen 4 Congress | Allen F. Steinhardt | 3,870 | 4.9 | |
| Total votes | 79,582 | 100.0 | ||
| Democratic hold | ||||
| Party | Candidate | Votes | % | |
|---|---|---|---|---|
| Democratic | Gregory Meeks | 167,836 | 89.7 | |
| Republican | Alan Jennings | 17,875 | 9.6 | |
| Libertarian | Catherine Wark | 1,345 | 0.7 | |
| Total votes | 187,056 | 100.0 | ||
| Democratic hold | ||||
| Party | Candidate | Votes | % | ±% | |
|---|---|---|---|---|---|
| Democratic | Gary Ackerman (incumbent) | 72,239 | 63.1 | −7.9 | |
| Republican | James Milano | 41,493 | 36.2 | +9.1 | |
| Tax Revolt Party | Elizabeth Berney | 798 | 0.7 | +0.7 | |
| Majority | 30,746 | 26.8 | −17.1 | ||
| Turnout | 114,530 | 100 | −27.9 | ||
| Party | Candidate | Votes | % | ±% | |
|---|---|---|---|---|---|
| Democratic | Gary Ackerman (incumbent) | 112,724 | 71.0 | −29.0 | |
| Republican | Elizabeth Berney | 43,039 | 27.1 | +27.1 | |
| Conservative | Jun Policarpio | 3,010 | 1.9 | +1.9 | |
| Majority | 69,685 | 43.9 | −56.1 | ||
| Turnout | 158,773 | 100 | +105.7 | ||
| Party | Candidate | Votes | % | ±% | |
|---|---|---|---|---|---|
| Democratic | Gary Ackerman (incumbent) | 77,190 | 100 | +28.7 | |
| Majority | 77,190 | 100 | +56.6 | ||
| Turnout | 77,190 | 100 | −54.0 | ||
| Party | Candidate | Votes | % | ±% | |
|---|---|---|---|---|---|
| Democratic | Gary Ackerman (incumbent) | 119,726 | 71.3 | −21.0 | |
| Republican | Stephen Graves | 46,867 | 27.9 | +27.9 | |
| Independent | Gonzalo Policarpio | 1,248 | 0.7 | +0.7 | |
| Majority | 72,859 | 43.4 | −41.2 | ||
| Turnout | 167,841 | 100 | +125.3 | ||
| Party | Candidate | Votes | % | ±% | |
|---|---|---|---|---|---|
| Democratic | Gary Ackerman (incumbent) | 68,773 | 92.3 | +24.3 | |
| Conservative | Perry S. Reich | 5,718 | 7.7 | +7.7 | |
| Majority | 63,055 | 84.6 | +46.8 | ||
| Turnout | 74,491 | 100 | −63.2 | ||
| Party | Candidate | Votes | % | ±% | |
|---|---|---|---|---|---|
| Democratic | Gary Ackerman (incumbent) | 137,684 | 68.0 | +3.0 | |
| Republican | Edward Elkowitz | 61,084 | 30.1 | −3.0 | |
| Right to Life | Anne T. Robinson | 3,846 | 1.9 | −0.0 | |
| Majority | 76,600 | 37.8 | +5.9 | ||
| Turnout | 202,614 | 100 | +35.2 | ||
| Party | Candidate | Votes | % | ±% | |
|---|---|---|---|---|---|
| Democratic | Gary Ackerman (incumbent) | 97,404 | 65.0 | +1.3 | |
| Republican | David C. Pinzon | 49,586 | 33.1 | −1.9 | |
| Right to Life | Anne T. Robinson | 2,872 | 1.9 | +0.6 | |
| Majority | 47,818 | 31.9 | +3.2 | ||
| Turnout | 149,862 | 100 | −24.2 | ||
| Party | Candidate | Votes | % | ±% | |
|---|---|---|---|---|---|
| Democratic | Gary Ackerman (incumbent) | 125,918 | 63.7 | ||
| Republican | Grant M. Lally | 69,244 | 35.0 | ||
| Right to Life | Andrew J. Duff | 2,623 | 1.3 | ||
| Majority | 56,674 | 28.7 | |||
| Turnout | 197,785 | 100 | |||
| Party | Candidate | Votes | % | ±% | |
|---|---|---|---|---|---|
| Democratic | William R. Roberts | 14,566 | 85.6 | ||
| Republican | James A. Briggs | 2,287 | 13.5 | ||
| Tammany Republican | George W. Gibbons | 157 | 0.9 | ||
| Majority | 12,279 | 72.1 | |||
| Turnout | 17,010 | 100 | |||
See also
Notes
- "New York congressional districts by urban and rural population and land area". United States Census Bureau. June 8, 2017. Archived from the original on November 21, 2019. Retrieved November 21, 2019.
- "My Congressional District".
- "2022 Cook PVI: District Map and List". Cook Political Report. Retrieved January 10, 2023.
- Ryder, Grover (April 17, 1980). "Rep. Wydler Won't Seek a 10th Term". Daily News. New York, NY. p. NS 1 – via Newspapers.com.
- Gruson, Lindsey (June 10, 1992). "McGrath to Leave Congress, Reducing the Region's Clout". The New York Times. New York, NY. p. B-6 – via TimesMachine.
- Sisk, Richard (June 10, 1992). "He'll Trade the House for Home". Daily News. New York, NY. News Washington Bureau. p. NSL QLI 2 – via Newspapers.com.
- November Election, 1870. Complete Statement of the Official Canvass, in Detail of the Election Held November 8, 1870, Giving the Vote of Each Election District, with Proceedings of County And State... Vol. II. County of New York. 1871. p. 2027. Retrieved July 30, 2009.
{{cite book}}: CS1 maint: others (link)
References
- Martis, Kenneth C. (1989). The Historical Atlas of Political Parties in the United States Congress. New York: Macmillan Publishing Company.
- Martis, Kenneth C. (1982). The Historical Atlas of United States Congressional Districts. New York: Macmillan Publishing Company.
- Congressional Biographical Directory of the United States 1774–present
- 2004 House election data Clerk of the House of Representatives
- 2002 House election data "
- 2000 House election data "
- 1998 House election data "
- 1996 House election data "
.svg.png.webp)
.jpg.webp)

.jpg.webp)
.jpg.webp)
.jpg.webp)
.jpg.webp)

.jpg.webp)

.jpg.webp)


.jpg.webp)



.jpg.webp)
.jpg.webp)






.tif.png.webp)
_(since_2023).svg.png.webp)