Nampicuan
Nampicuan, officially the Municipality of Nampicuan (Ilocano: Ili ti Nampicuan; Tagalog: Bayan ng Nampicuan), is a 5th class municipality in the province of Nueva Ecija, Philippines. According to the 2020 census, it has a population of 14,471 people.[3]
Nampicuan | |
|---|---|
| Municipality of Nampicuan | |
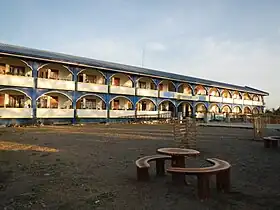
 Downtown area | |
 Flag  Seal | |
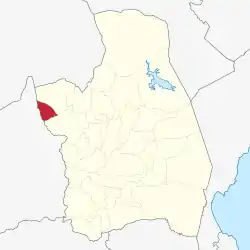
 Map of Nueva Ecija with Nampicuan highlighted | |
OpenStreetMap | |
.svg.png.webp) Nampicuan Location within the Philippines | |
| Coordinates: 15°44′03″N 120°38′08″E | |
| Country | Philippines |
| Region | Central Luzon |
| Province | Nueva Ecija |
| District | 1st district |
| Barangays | 21 (see Barangays) |
| Government | |
| • Type | Sangguniang Bayan |
| • Mayor | Victor M. Badar |
| • Vice Mayor | Remedios Tablada Badar |
| • Representative | Estrellita B. Suansing |
| • Municipal Council | Members |
| • Electorate | 10,873 voters (2022) |
| Area | |
| • Total | 52.60 km2 (20.31 sq mi) |
| Elevation | 22 m (72 ft) |
| Highest elevation | 44 m (144 ft) |
| Lowest elevation | 16 m (52 ft) |
| Population (2020 census)[3] | |
| • Total | 14,471 |
| • Density | 280/km2 (710/sq mi) |
| • Households | 3,522 |
| Economy | |
| • Income class | 5th municipal income class |
| • Poverty incidence | 6.62 |
| • Revenue | ₱ 88.01 million (2020) |
| • Assets | ₱ 285.4 million (2020) |
| • Expenditure | ₱ 83.17 million (2020) |
| • Liabilities | ₱ 86.84 million (2020) |
| Service provider | |
| • Electricity | Tarlac 1 Electric Cooperative (TARELCO 1) |
| Time zone | UTC+8 (PST) |
| ZIP code | 3116 |
| PSGC | |
| IDD : area code | +63 (0)44 |
| Native languages | Ilocano Tagalog |
History
The name Nampicuan emanated from the word “Nagpicuan” which means a curve road, originated in a trail called “Curva” as inhabitants of Pangasinan used to call. According to the first settlers, the site was a sitio named used “Surgue” or ‘SULI” situated in the eastern part of what eventually became the poblacion of Nampicuan and was the point where the feeder road from Moncada, Tarlac turned abruptly north-east towards the town of Cuyapo, Nueva Ecija.
The first known settlers were the Ilocanos. They came from Paoay, Ilocos Region, Pangasinan and Zambales. In 1880, having found the soil productive for agricultural purposes, the early settlers cleared the place, cultivate the land and cut down the trees. The trees were sawed into lumber out of which their houses were constructed. At time passes and population continues to grow, more and more demands are made for land and its resources. So much so, on the end of the 19th century, the barrio Nampicuan became a municipality and the first “alcalde mayors” were Andres Tabilangan and Feliciano Cuaresma. Before its formal creation and declaration as a municipality, Nampicuan was then a part and under the political jurisdiction of the town of Cuyapo.
In 1903, while the Philippines was still under the American Occupation, Nampicuan was reverted to the status of a barrio of the Cuyapo town. Upon proper presentation however of the prominent residents of this place, Nampicuan was again elevated to the status of municipality. In 1907, the first church was constructed led by REV. Luis Corpuz and the establishment of Gabaldon Primary School under the first Principal/Teacher, Clodualdo Bringas. After a year Nampicuan become a third class municipality of Nueva Ecija with the first leaders, President Laureano O. Gonzales and Vice – President Simeon Quiaoit.
Geography
Barangays
Nampicuan is politically subdivided into 21 barangays. Each barangay consists of puroks and some have sitios.
- Alemania
- Ambassador Alzate Village
- Cabaducan East (Poblacion)
- Cabaducan West (Poblacion)
- Cabawangan
- East Central Poblacion
- Edy
- Maeling
- Mayantoc
- Medico
- Monic
- North poblacion
- Northwest Poblacion
- Estacion
- West Poblacion
- Recuerdo
- South Central Poblacion
- Southeast Poblacion
- Southwest Poblacion
- Tony
- West Central Poblacion.
Climate
| Climate data for Nampicuan, Nueva Ecija | |||||||||||||
|---|---|---|---|---|---|---|---|---|---|---|---|---|---|
| Month | Jan | Feb | Mar | Apr | May | Jun | Jul | Aug | Sep | Oct | Nov | Dec | Year |
| Average high °C (°F) | 30 (86) |
31 (88) |
33 (91) |
35 (95) |
33 (91) |
31 (88) |
30 (86) |
29 (84) |
29 (84) |
30 (86) |
31 (88) |
30 (86) |
31 (88) |
| Average low °C (°F) | 19 (66) |
19 (66) |
20 (68) |
22 (72) |
24 (75) |
24 (75) |
24 (75) |
24 (75) |
23 (73) |
22 (72) |
21 (70) |
20 (68) |
22 (71) |
| Average precipitation mm (inches) | 3 (0.1) |
2 (0.1) |
5 (0.2) |
10 (0.4) |
80 (3.1) |
107 (4.2) |
138 (5.4) |
147 (5.8) |
119 (4.7) |
70 (2.8) |
26 (1.0) |
8 (0.3) |
715 (28.1) |
| Average rainy days | 2.0 | 1.7 | 2.7 | 4.6 | 16.1 | 20.8 | 24.0 | 23.0 | 21.4 | 15.5 | 8.0 | 3.2 | 143 |
| Source: Meteoblue [5] | |||||||||||||
Demographics
|
| |||||||||||||||||||||||||||||||||||||||||||||||||||
| Source: Philippine Statistics Authority[6][7][8][9] | ||||||||||||||||||||||||||||||||||||||||||||||||||||

Economy
Education

- Nampicuan Central School
- Nampicuan Christian Academy
- Alzate Village Elementary School
- United Methodist Church Learning Central
- Cabawangan Elementary School
- Mayantoc Elementary School
- Recuerdo Elementary School
- Monic Elementary School
- Maeling Elementary School
- Nampicuan High School
- St. Pius X Institute of Nampicuan, Inc.
- Recuerdo National High School
In 2020, a bill was filed at the Congress of the Philippines to construct a regular NEUST campus in Nampicuan.[17]
References
- Municipality of Nampicuan | (DILG)
- "2015 Census of Population, Report No. 3 – Population, Land Area, and Population Density" (PDF). Philippine Statistics Authority. Quezon City, Philippines. August 2016. ISSN 0117-1453. Archived (PDF) from the original on May 25, 2021. Retrieved July 16, 2021.
- Census of Population (2020). "Region III (Central Luzon)". Total Population by Province, City, Municipality and Barangay. Philippine Statistics Authority. Retrieved 8 July 2021.
- "PSA Releases the 2018 Municipal and City Level Poverty Estimates". Philippine Statistics Authority. 15 December 2021. Retrieved 22 January 2022.
- "Nampicuan: Average Temperatures and Rainfall". Meteoblue. Retrieved 4 May 2020.
- Census of Population (2015). "Region III (Central Luzon)". Total Population by Province, City, Municipality and Barangay. Philippine Statistics Authority. Retrieved 20 June 2016.
- Census of Population and Housing (2010). "Region III (Central Luzon)" (PDF). Total Population by Province, City, Municipality and Barangay. National Statistics Office. Retrieved 29 June 2016.
- Censuses of Population (1903–2007). "Region III (Central Luzon)". Table 1. Population Enumerated in Various Censuses by Province/Highly Urbanized City: 1903 to 2007. National Statistics Office.
- "Province of Nueva Ecija". Municipality Population Data. Local Water Utilities Administration Research Division. Retrieved 17 December 2016.
- "Poverty incidence (PI):". Philippine Statistics Authority. Retrieved December 28, 2020.
- "Estimation of Local Poverty in the Philippines" (PDF). Philippine Statistics Authority. 29 November 2005.
- "2003 City and Municipal Level Poverty Estimates" (PDF). Philippine Statistics Authority. 23 March 2009.
- "City and Municipal Level Poverty Estimates; 2006 and 2009" (PDF). Philippine Statistics Authority. 3 August 2012.
- "2012 Municipal and City Level Poverty Estimates" (PDF). Philippine Statistics Authority. 31 May 2016.
- "Municipal and City Level Small Area Poverty Estimates; 2009, 2012 and 2015". Philippine Statistics Authority. 10 July 2019.
- "PSA Releases the 2018 Municipal and City Level Poverty Estimates". Philippine Statistics Authority. 15 December 2021. Retrieved 22 January 2022.
- "18th Congress - House Bill No. 7692 - Senate of the Philippines". Legacy.senate.gov.ph. Retrieved 2022-08-28.