New York's 7th congressional district
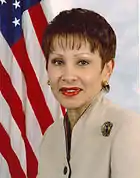
New York's 7th congressional district is a congressional district for the United States House of Representatives in New York City. It includes parts of Brooklyn and Queens. Democrat Nydia Velázquez represents the district in Congress.
| New York's 7th congressional district | |||
|---|---|---|---|
Interactive map of district boundaries since January 3, 2023 | |||
| Representative |
| ||
| Distribution |
| ||
| Population (2022) | 699,930[1] | ||
| Median household income | $88,141[2] | ||
| Ethnicity |
| ||
| Cook PVI | D+31[3] | ||
Like many Congressional districts around the country, the New York Seventh's boundaries were drawn as to link disparate and widely separated neighborhoods with a large percentage of minority voters (see majority-minority districts). While no minority in the district constitutes an absolute majority, the boundaries group together heavily Puerto Rican neighborhoods in the New York City boroughs of Brooklyn and Queens.
The district includes the Queens neighborhoods of Long Island City, Astoria, Sunnyside, Maspeth, Ridgewood, and Woodhaven; the Brooklyn neighborhoods of Bushwick, Clinton Hill, Downtown Brooklyn, East New York, East Williamsburg, Fort Greene, Greenpoint, and Williamsburg.
Until 2012, the 7th consisted of parts of Northern Queens and Eastern portions of the Bronx. The Queens portion included the neighborhoods of College Point, East Elmhurst, Jackson Heights and Woodside. The Bronx portion of the district included the neighborhoods of Co-op City, Morris Park, Parkchester, Pelham Bay, and Throgs Neck as well as City Island. Until the latest redistricting in 2022, the 7th also included a portion of Manhattan's Lower East Side.
Recent statewide election results
| Year | Office | Results |
|---|---|---|
| 1992 | President | Clinton 56–35% |
| 1996 | President | Clinton 68–25% |
| 2000 | President | Gore 75–21% |
| 2004 | President | Kerry 74–25% |
| 2008 | President | Obama 84–15% |
| 2012 | President | Obama 88–10% |
| 2016 | President | Clinton 87–10% |
| 2020 | President | Biden 81–17% |
History
2023—:
2013–2023:
1993–2013:
1953–1993:
- Parts of Queens
1913–1953:
- Parts of Brooklyn
Various New York districts have been numbered "7" over the years, including areas in New York City and various parts of upstate New York.

.tif.png.webp)
List of members representing the district
The 7th District originally was the south Queens seat in the 1960s and 1970s (now the 6th District) and then became a central Queens seat (essentially the old 8th district) in the 1980s. Following the 1992 remap, much of the old 9th District was added. The 2002 remap placed much of the district in the Bronx, and it now resembles the 1970s era 10th District.
Election results
Note that in New York State electoral politics there are numerous minor parties at various points on the political spectrum. Certain parties will invariably endorse either the Republican or Democratic candidate for every office, hence the state electoral results contain both the party votes, and the final candidate votes (Listed as "Recap").
| Party | Candidate | Votes | % | ±% | |
|---|---|---|---|---|---|
| Democratic | Smith Ely, Jr. | 12,464 | 74.2 | ||
| Republican | David Hunter McAlpin | 3,403 | 20.3 | ||
| Tammany Republican | Benjamin A. Willis | 929 | 5.5 | ||
| Majority | 9.061 | 53.9 | |||
| Turnout | 16,796 | 100 | |||
| Party | Candidate | Votes | % | ±% | |
|---|---|---|---|---|---|
| Democratic | Gary L. Ackerman (incumbent) | 97,674 | 69.3 | ||
| Republican | Gustave A. Reifenkugel | 43,370 | 30.7 | ||
| Majority | 54,304 | 38.6 | |||
| Turnout | 131,044 | 100 | |||
| Party | Candidate | Votes | % | ±% | |
|---|---|---|---|---|---|
| Democratic | Thomas J. Manton (incumbent) | 78,848 | 71.1 | ||
| Republican | Rose Birtley | 32,092 | 28.9 | ||
| Majority | 46,756 | 42.1 | |||
| Turnout | 110,940 | 100 | |||
| Party | Candidate | Votes | % | ±% | |
|---|---|---|---|---|---|
| Democratic | Joseph Crowley | 50,924 | 69.0 | −2.1 | |
| Republican | James J. Dillon | 18,896 | 25.6 | −3.3 | |
| Conservative | Richard Rethco | 3,960 | 5.4 | +5.4 | |
| Majority | 32,028 | 43.4 | +1.3 | ||
| Turnout | 73,780 | 100 | −33.5 | ||
| Party | Candidate | Votes | % | ±% | |
|---|---|---|---|---|---|
| Democratic | Joseph Crowley (incumbent) | 78,207 | 71.5 | +2.5 | |
| Republican | Rose Robles Birtley | 24,592 | 22.5 | −3.1 | |
| Conservative | Robert E. Hurley | 3,131 | 2.9 | −2.5 | |
| Green | Paul Gilman | 1,999 | 1.8 | +1.8 | |
| Right to Life | Garafalia Christea | 1,172 | 1.1 | +1.1 | |
| Majority | 53,615 | 49.1 | +5.7 | ||
| Turnout | 109,101 | 100 | +47.9 | ||
| Party | Candidate | Votes | % | ±% | |
|---|---|---|---|---|---|
| Democratic | Joseph Crowley (incumbent) | 50,967 | 73.3 | +1.8 | |
| Republican | Kevin Brawley | 18,572 | 26.7 | +4.2 | |
| Majority | 32,395 | 46.6 | 2.5 | ||
| Turnout | 69,539 | 100 | −36.3 | ||
| Party | Candidate | Votes | % | ±% | |
|---|---|---|---|---|---|
| Democratic | Joseph Crowley (incumbent) | 104,275 | 80.9 | +7.6 | |
| Republican | Joseph Cinquemani | 24,548 | 19.1 | −7.6 | |
| Majority | 79,727 | 61.9 | +15.3 | ||
| Turnout | 128,823 | 100 | +85.2 | ||
| Party | Candidate | Votes | % | ±% | |
|---|---|---|---|---|---|
| Democratic | Joe Crowley (incumbent) | 63,997 | 84.0 | +3.1 | |
| Republican | Kevin Brawley | 12,220 | 16.0 | −3.1 | |
| Majority | 51,777 | 67.9 | +6.0 | ||
| Turnout | 76,217 | 100 | −40.8 | ||
| Party | Candidate | Votes | % | ±% | |
|---|---|---|---|---|---|
| Democratic | Joe Crowley (incumbent) | 118,459 | 84.7 | +0.7 | |
| Republican | William E. Britt, Jr. | 21,477 | 15.3 | −0.7 | |
| Majority | 96,982 | 69.3 | +1.4 | ||
| Turnout | 139,936 | 100 | +83.6 | ||
| Party | Candidate | Votes | % | ±% | |
|---|---|---|---|---|---|
| Democratic | Joe Crowley (incumbent) | 71,247 | 80.6 | −4.1 | |
| Republican | Kenneth A. Reynolds | 16,145 | 18.3 | +3.0 | |
| Green | Anthony Gronowicz | 1,038 | 1.1 | +1.1 | |
| Majority | 55,102 | 62.3 | −7.0 | ||
| Turnout | 88,430 | 100 | -36.8 | ||
| Party | Candidate | Votes | % | |
|---|---|---|---|---|
| Democratic | Nydia Velázquez | 134,802 | 88.8 | |
| Working Families | Nydia Velázquez | 9,128 | 6.0 | |
| Total | Nydia Velázquez (incumbent) | 143,930 | 94.8 | |
| Conservative | James Murray | 7,971 | 5.2 | |
| Total votes | 151,901 | 100.0 | ||
| Democratic hold | ||||
| Party | Candidate | Votes | % | |
|---|---|---|---|---|
| Democratic | Nydia Velazquez | 47,142 | 74.0 | |
| Working Families | Nydia Velazquez | 9,451 | 14.8 | |
| Total | Nydia Velazquez (incumbent) | 56,593 | 88.8 | |
| Republican | Jose Luis Fernandez | 5,713 | 9.0 | |
| Conservative | Allan E. Romaguera | 1,398 | 2.2 | |
| Total votes | 63,704 | 100.0 | ||
| Democratic hold | ||||
| Party | Candidate | Votes | % | |
|---|---|---|---|---|
| Democratic | Nydia Velazquez | 165,819 | 87.4 | |
| Women's Equality | Nydia Velazquez | 6,327 | 3.3 | |
| Total | Nydia Velazquez (incumbent) | 172,146 | 90.8 | |
| Republican | Allan E. Romaguera | 14,941 | 7.9 | |
| Conservative | Allan E. Romaguera | 2,537 | 1.3 | |
| Total | Allan E. Romaguera | 17,478 | 9.2 | |
| Total votes | 189,624 | 100.0 | ||
| Democratic hold | ||||
| Party | Candidate | Votes | % | |
|---|---|---|---|---|
| Democratic | Nydia Velázquez | 134,125 | 85.4 | |
| Working Families | Nydia Velázquez | 12,562 | 8.0 | |
| Total | Nydia Velázquez (incumbent) | 146,687 | 93.4 | |
| Conservative | Joseph Lieberman | 8,670 | 5.5 | |
| Reform | Jeffrey Kurzon | 1,740 | 1.1 | |
| Total votes | 157,097 | 100.0 | ||
| Democratic hold | ||||
| Party | Candidate | Votes | % | |
|---|---|---|---|---|
| Democratic | Nydia Velázquez | 156,889 | 69.7 | |
| Working Families | Nydia Velázquez | 34,184 | 15.2 | |
| Total | Nydia Velázquez (incumbent) | 191,073 | 84.9 | |
| Republican | Brian Kelly | 29,404 | 13.1 | |
| Conservative | Brian Kelly | 3,116 | 1.3 | |
| Total | Brian Kelly | 32,520 | 14.4 | |
| Libertarian | Gilbert Midonnet | 1,522 | 0.7 | |
| Total votes | 225,115 | 100.0 | ||
| Democratic hold | ||||
See also
Notes
- "New York congressional districts by urban and rural population and land area". United States Census Bureau. June 8, 2017. Archived from the original on November 21, 2019. Retrieved November 21, 2019.
- "My Congressional District".
- "2022 Cook PVI: District Map and List". Cook Political Report. Retrieved January 10, 2023.
- Special master releases draft congressional district maps; All of Cayuga in one district
- New York Redistricting New York Times, March 20, 2012
- November Election, 1870. Complete Statement of the Official Canvass, in Detail of the Election Held November 8, 1870, Giving the Vote of Each Election District, with Proceedings of County And State... Vol. II. County of New York. 1871. p. 2029. Retrieved March 27, 2009.
{{cite book}}: CS1 maint: others (link)
References
- Martis, Kenneth C. (1989). The Historical Atlas of Political Parties in the United States Congress. New York: Macmillan Publishing Company.
- Martis, Kenneth C. (1982). The Historical Atlas of United States Congressional Districts. New York: Macmillan Publishing Company.
- Congressional Biographical Directory of the United States 1774–present
- 2004 House election data Clerk of the House of Representatives
- 2002 House election data "
- 2000 House election data "
- 1998 House election data "
- 1996 House election data "
.svg.png.webp)
.jpg.webp)







.jpg.webp)





.tif.png.webp)
_(since_2023).svg.png.webp)