Kensington North (UK Parliament constituency)
Kensington North was a parliamentary constituency centred on the Kensington district of west London. It returned one Member of Parliament (MP) to the House of Commons of the Parliament of the United Kingdom.
| Kensington North | |
|---|---|
| Former Borough constituency for the House of Commons | |
| 1885–February 1974 | |
| Seats | One |
| Created from | Chelsea |
| Replaced by | Kensington |
The constituency was created for the 1885 general election, and abolished for the February 1974 general election.
Boundaries

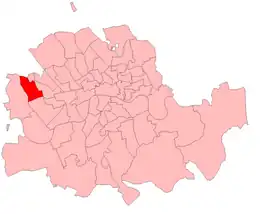
Kensington North in the Metropolitan area from 1885 to 1918

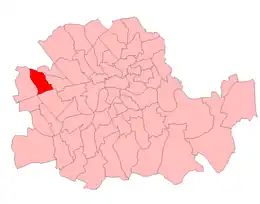
Kensington North in London from 1918 to 1950

Kensington North in London from 1950 to 1974

wards of Kensington Metropolitan Borough in 1916
1918–1974: The Royal Borough of Kensington wards of Golborne, Norland, Pembridge, and St Charles.
Members of Parliament
Election results
Elections in the 1880s
| Party | Candidate | Votes | % | ±% | |
|---|---|---|---|---|---|
| Conservative | Roper Lethbridge | 3,619 | 54.6 | ||
| Liberal | Joseph Bottomley Firth | 3,011 | 45.4 | ||
| Majority | 608 | 9.2 | |||
| Turnout | 6,630 | 79.9 | |||
| Registered electors | 8,297 | ||||
| Conservative win (new seat) | |||||
| Party | Candidate | Votes | % | ±% | |
|---|---|---|---|---|---|
| Conservative | Roper Lethbridge | 3,394 | 58.1 | +3.5 | |
| Liberal | Edmund Routledge | 2,443 | 41.9 | -3.5 | |
| Majority | 951 | 16.2 | +7.0 | ||
| Turnout | 5,837 | 70.4 | −9.5 | ||
| Registered electors | 8,297 | ||||
| Conservative hold | Swing | +3.5 | |||
Elections in the 1890s
| Party | Candidate | Votes | % | ±% | |
|---|---|---|---|---|---|
| Liberal | Frederick Frye | 3,503 | 51.5 | +9.6 | |
| Conservative | William Edward Thompson Sharpe | 3,293 | 48.5 | −9.6 | |
| Majority | 210 | 3.0 | N/A | ||
| Turnout | 6,796 | 75.4 | +5.0 | ||
| Registered electors | 9,017 | ||||
| Liberal gain from Conservative | Swing | +9.6 | |||
| Party | Candidate | Votes | % | ±% | |
|---|---|---|---|---|---|
| Conservative | William Edward Thompson Sharpe | 3,829 | 56.8 | +8.3 | |
| Liberal | Frederick Frye | 2,913 | 43.2 | −8.3 | |
| Majority | 916 | 13.6 | N/A | ||
| Turnout | 6,742 | 71.1 | −4.3 | ||
| Registered electors | 9,482 | ||||
| Conservative gain from Liberal | Swing | +8.3 | |||
Elections in the 1900s
| Party | Candidate | Votes | % | ±% | |
|---|---|---|---|---|---|
| Conservative | William Edward Thompson Sharpe | 3,257 | 56.3 | −0.5 | |
| Liberal | Rufus Isaacs | 2,527 | 43.7 | +0.5 | |
| Majority | 730 | 12.6 | −1.0 | ||
| Turnout | 5,784 | 62.0 | −9.1 | ||
| Registered electors | 9,323 | ||||
| Conservative hold | Swing | −0.5 | |||

Stanger
| Party | Candidate | Votes | % | ±% | |
|---|---|---|---|---|---|
| Liberal | Henry Yorke Stanger | 4,416 | 56.8 | +13.1 | |
| Conservative | Ellis Hume-Williams | 3,358 | 43.2 | −13.1 | |
| Majority | 1,058 | 13.6 | N/A | ||
| Turnout | 7,774 | 75.7 | +13.7 | ||
| Registered electors | 10,270 | ||||
| Liberal gain from Conservative | Swing | +13.1 | |||
Elections in the 1910s
| Party | Candidate | Votes | % | ±% | |
|---|---|---|---|---|---|
| Conservative | Alan Burgoyne | 4,611 | 53.1 | +9.9 | |
| Liberal | Henry Robson | 4079 | 46.9 | -9.9 | |
| Majority | 532 | 6.2 | N/A | ||
| Turnout | 10,100 | 86.0 | +10.3 | ||
| Conservative gain from Liberal | Swing | ||||
| Party | Candidate | Votes | % | ±% | |
|---|---|---|---|---|---|
| Conservative | Alan Burgoyne | 4,223 | 54.7 | 1.6 | |
| Liberal | Frank Murray Carson | 3494 | 45.3 | -1.6 | |
| Majority | 729 | 9.4 | +3.2 | ||
| Turnout | 10,100 | 76.4 | -9.6 | ||
| Conservative hold | Swing | ||||
| Party | Candidate | Votes | % | ±% | |
|---|---|---|---|---|---|
| C | Unionist | Alan Burgoyne | 13,176 | 78.3 | +23.6 |
| Labour | William Joseph Jarrett | 3,653 | 21.7 | New | |
| Majority | 9,523 | 56.6 | +11.2 | ||
| Turnout | 38,045 | 44.2 | -32.2 | ||
| Unionist hold | Swing | ||||
| C indicates candidate endorsed by the coalition government. | |||||
Election in the 1920s
| Party | Candidate | Votes | % | ±% | |
|---|---|---|---|---|---|
| Unionist | Percy George Gates | 12,328 | 53.1 | -25.2 | |
| Labour | William Joseph Jarrett | 6,225 | 26.8 | +5.1 | |
| Liberal | Charles William Hayward | 4,666 | 20.1 | New | |
| Majority | 6,103 | 26.3 | -30.3 | ||
| Turnout | 42,328 | 54.9 | +10.7 | ||
| Unionist hold | Swing | -15.2 | |||
| Party | Candidate | Votes | % | ±% | |
|---|---|---|---|---|---|
| Unionist | Percy George Gates | 9,458 | 39.4 | -13.7 | |
| Labour | William Joseph Jarrett | 8,888 | 37.0 | +10.2 | |
| Liberal | Leonard Stein | 5,672 | 23.6 | +3.5 | |
| Majority | 570 | 2.4 | -23.9 | ||
| Turnout | 43,050 | 55.8 | +0.9 | ||
| Unionist hold | Swing | -12.0 | |||
| Party | Candidate | Votes | % | ±% | |
|---|---|---|---|---|---|
| Conservative | Percy George Gates | 16,255 | 53.0 | +13.6 | |
| Labour | Fielding West | 14,401 | 47.0 | +10.0 | |
| Majority | 1,854 | 6.0 | +3.6 | ||
| Turnout | 44,015 | 69.6 | +13.8 | ||
| Conservative hold | Swing | +3.6 | |||
| Party | Candidate | Votes | % | ±% | |
|---|---|---|---|---|---|
| Labour | Fielding West | 19,701 | 48.4 | +1.4 | |
| Unionist | Percy George Gates | 15,511 | 38.1 | -14.9 | |
| Liberal | Frances Stewart | 5,516 | 13.5 | New | |
| Majority | 4,190 | 10.3 | N/A | ||
| Turnout | 59,500 | 68.5 | -1.1 | ||
| Labour gain from Unionist | Swing | +8.1 | |||
Election in the 1930s
| Party | Candidate | Votes | % | ±% | |
|---|---|---|---|---|---|
| Conservative | James Duncan | 27,860 | 63.7 | +25.6 | |
| Labour | Fielding West | 15,843 | 36.3 | -12.1 | |
| Majority | 12,017 | 27.4 | N/A | ||
| Turnout | 60,821 | 71.9 | +3.4 | ||
| Conservative gain from Labour | Swing | +18.8 | |||
| Party | Candidate | Votes | % | ±% | |
|---|---|---|---|---|---|
| Conservative | James Duncan | 18,907 | 53.2 | -10.5 | |
| Labour | Frank Carter | 15,309 | 43.1 | +6.8 | |
| Liberal | John Seymour Spon | 1,323 | 3.7 | New | |
| Majority | 3,598 | 10.1 | -17.3 | ||
| Turnout | 58,691 | 60.6 | -11.3 | ||
| Conservative hold | Swing | -8.7 | |||
Election in the 1940s
| Party | Candidate | Votes | % | ±% | |
|---|---|---|---|---|---|
| Labour | George Rogers | 16,838 | 56.6 | +13.5 | |
| Conservative | James Duncan | 10,699 | 36.0 | -17.2 | |
| Liberal | John Richard Colclough | 2,212 | 7.4 | +3.7 | |
| Majority | 6,139 | 20.6 | N/A | ||
| Turnout | 42,365 | 70.2 | +9.6 | ||
| Labour gain from Conservative | Swing | +15.4 | |||
Elections in the 1950s
| Party | Candidate | Votes | % | ±% | |
|---|---|---|---|---|---|
| Labour | George Rogers | 21,615 | 50.65 | ||
| Conservative | Leonard Caplan[3] | 17,991 | 42.15 | ||
| Liberal | Robert Rufus Carey Evans | 2,522 | 5.91 | ||
| Communist | M.J. Eyre | 551 | 1.29 | New | |
| Majority | 3,624 | 8.50 | |||
| Turnout | 54,480 | 78.34 | |||
| Labour hold | Swing | ||||
| Party | Candidate | Votes | % | ±% | |
|---|---|---|---|---|---|
| Labour | George Rogers | 22,686 | 52.99 | ||
| Conservative | Leonard Caplan[3] | 18,543 | 43.31 | ||
| Liberal | Anthony Graeme Gamble | 1,583 | 3.70 | ||
| Majority | 4,143 | 9.68 | |||
| Turnout | 54,083 | 79.16 | |||
| Labour hold | Swing | ||||
| Party | Candidate | Votes | % | ±% | |
|---|---|---|---|---|---|
| Labour | George Rogers | 20,226 | 53.92 | ||
| Conservative | Robert Bulbrook | 17,283 | 46.08 | ||
| Majority | 2,943 | 7.84 | |||
| Turnout | 53,789 | 69.73 | |||
| Labour hold | Swing | ||||
| Party | Candidate | Votes | % | ±% | |
|---|---|---|---|---|---|
| Labour | George Rogers | 14,925 | 42.75 | −11.17 | |
| Conservative | Robert Bulbrook | 14,048 | 40.24 | −5.84 | |
| Liberal | Michael Louis Hydleman | 3,118 | 8.93 | New | |
| Union Movement | Oswald Mosley | 2,821 | 8.08 | New | |
| Majority | 877 | 2.51 | −5.33 | ||
| Turnout | 34,912 | 67.83 | −1.90 | ||
| Labour hold | Swing | −2.7 | |||
Elections in the 1960s
| Party | Candidate | Votes | % | ±% | |
|---|---|---|---|---|---|
| Labour | George Rogers | 15,283 | 49.50 | ||
| Conservative | Andrew Bowden | 12,771 | 41.37 | ||
| Liberal | Yvonne C Richardson | 2,819 | 9.13 | ||
| Majority | 2,512 | 8.13 | |||
| Turnout | 30,873 | 61.32 | |||
| Labour hold | Swing | ||||
| Party | Candidate | Votes | % | ±% | |
|---|---|---|---|---|---|
| Labour | George Rogers | 16,012 | 54.79 | ||
| Conservative | Leon Brittan | 10,749 | 36.78 | ||
| Liberal | Anthony Clive S Thomas | 2,462 | 8.42 | ||
| Majority | 5,263 | 18.01 | |||
| Turnout | 29,223 | 62.07 | |||
| Labour hold | Swing | ||||
Election in the 1970s
| Party | Candidate | Votes | % | ±% | |
|---|---|---|---|---|---|
| Labour | Bruce Douglas-Mann | 13,175 | 52.8 | -2.0 | |
| Conservative | Leon Brittan | 9,792 | 39.2 | +2.4 | |
| Liberal | Patrick Spencer | 1,990 | 7.9 | -0.5 | |
| Majority | 3,383 | 13.6 | -4.4 | ||
| Turnout | 24,957 | 57.4 | -4.7 | ||
| Labour hold | Swing | ||||
References
- Craig, FWS, ed. (1974). British Parliamentary Election Results: 1885-1918. London: Macmillan Press. ISBN 9781349022984.
- British parliamentary election results 1918-1949, Craig, F.W.S.
- "Obituary: Leonard Caplan". The Daily Telegraph. 8 February 2001. Retrieved 19 March 2014.
- "UK General Election results, 1959". Archived from the original on 11 August 2011. Retrieved 31 January 2019.
- "General Election Results Suppplement". The Times. 20 June 1970. p. ix.
- Leigh Rayment's Historical List of MPs – Constituencies beginning with "K" (part 1)
- British Parliamentary Election Results 1885-1918, compiled and edited by F.W.S. Craig (Macmillan Press 1974)
- Debrett’s Illustrated Heraldic and Biographical House of Commons and the Judicial Bench 1886
- Debrett’s House of Commons and the Judicial Bench 1901
- Debrett’s House of Commons and the Judicial Bench 1918
This article is issued from Wikipedia. The text is licensed under Creative Commons - Attribution - Sharealike. Additional terms may apply for the media files.