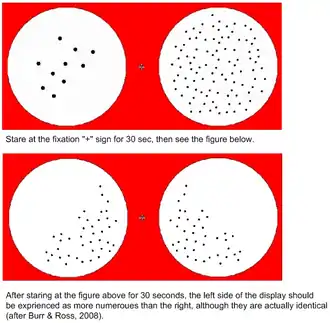
Numerosity adaptation effect
The numerosity adaptation effect is a perceptual phenomenon in numerical cognition which demonstrates non-symbolic numerical intuition and exemplifies how numerical percepts can impose themselves upon the human brain automatically. This effect was first described in 2008.[1][2]
| Cognitive psychology |
|---|
 |
| Perception |
| Attention |
| Memory |
| Metacognition |
| Language |
| Metalanguage |
| Thinking |
| Numerical cognition |

Presently, this effect is described only for controlled experimental conditions. In the illustration, a viewer should have a strong impression that the left display (lower figure) is more numerous than the right, after 30 seconds of viewing the adaptation (upper figure), although both have exactly the same number of dots. The viewer might also underestimate the number of dots presented in the display.[1]
Both effects are resistant to manipulation of the non-numerical parameters of the display. Thus, this effect cannot be simply explained in terms of size, density, or contrast.[3][4]
Perhaps the most astonishing aspect of these effects is that they happen immediately, and without conscious control (i.e., knowing that the numbers are equal would not hamper their happening).[1] This points to the operation of a special and largely automatic processing system. As noted by Burr & Ross (2008):
Just as we have a direct visual sense of the reddishness of half a dozen ripe cherries, so we do of their sixishness.[2]
Possible explanations
Few explanations were suggested to explain these phenomena. It was argued that they are heavily dependent on density and less on numerosity. Also, it was suggested that numerosity may be correlated with kurtosis and that the results may be better explained in terms of texture density such that only dots falling within the spatial region where the test is displayed effectively adapt the region.[5]
However, as the display in the original experiments was of spots uniformly either white or black, the kurtosis account is inapplicable. The texture density explanation doesn't seem to disentangle the complexity of these phenomena as in the display the left field adapts to many dots, the right field to few, and these adapters selectively affect the relevant test stimuli. It is not the number of dots in the entire display that causes the adaptation but only those within a particular area.[4] At present, why adaptation have such profound effect on numerosity estimates remains largely unexplained.[1]
See also
References
- Dehaene, Stanislas (2009). "Origins of Mathematical Intuitions The Case of Arithmetic". Annals of the New York Academy of Sciences. 1156: 232–259. doi:10.1111/j.1749-6632.2009.04469.x. PMID 19338511. S2CID 2382715.
- Burr, David; John Ross (2008). "A Visual Sense of Number". Current Biology. 18 (6): 425–428. doi:10.1016/j.cub.2008.02.052. PMID 18342507.
- Izard, Véronique; Stanislas Dehaene (2008). "Calibrating the mental number line" (PDF). Cognition. 106 (3): 1221–1247. CiteSeerX 10.1.1.148.2960. doi:10.1016/j.cognition.2007.06.004. PMID 17678639. S2CID 9488163. Retrieved 2010-04-01.
- Burr, David; John Ross (September 23, 2008). "Response: Visual number". Current Biology. 18 (18): R857–R858. doi:10.1016/j.cub.2008.07.052.
- Durgin, Frank H (September 23, 2008). "Texture density adaptation and visual number revisited". Current Biology. 18 (18): R855–R856. doi:10.1016/j.cub.2008.07.053. PMID 18812077.