Pleasant Valley, Texas
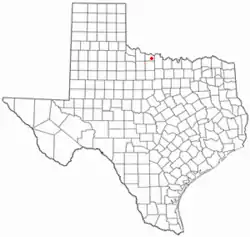
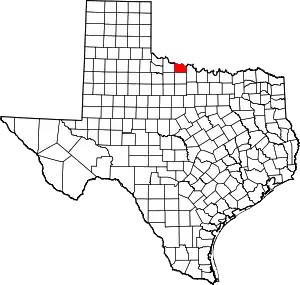
Pleasant Valley is a town in Wichita County, Texas, United States. It is part of the Wichita Falls, Texas metropolitan statistical area. The population was 336 at the 2010 census.[5] Pleasant Valley is also referred to as "The rural country club of Wichita County", in part because of the high demand for land and above-average home prices. This includes Pleasant Valley estates and also Horseshoe Bend estates to the southwest.
Pleasant Valley, Texas | |
|---|---|
 Location of Pleasant Valley, Texas | |
 | |
| Coordinates: 33°56′15″N 98°35′53″W | |
| Country | United States |
| State | Texas |
| County | Wichita |
| Area | |
| • Total | 2.63 sq mi (6.80 km2) |
| • Land | 2.63 sq mi (6.80 km2) |
| • Water | 0.00 sq mi (0.00 km2) |
| Elevation | 974 ft (297 m) |
| Population (2010) | |
| • Total | 336 |
| • Estimate (2019)[3] | 330 |
| • Density | 125.62/sq mi (48.50/km2) |
| Time zone | UTC-6 (Central (CST)) |
| • Summer (DST) | UTC-5 (CDT) |
| Zip Code | 76305, 76367 |
| FIPS code | 48-58400[4] |
| GNIS feature ID | 2412490[2] |
Geography
According to the United States Census Bureau, the town has a total area of 2.6 square miles (6.7 km2), all land.
Demographics
| Census | Pop. | Note | %± |
|---|---|---|---|
| 1970 | 323 | — | |
| 1980 | 335 | 3.7% | |
| 1990 | 378 | 12.8% | |
| 2000 | 408 | 7.9% | |
| 2010 | 336 | −17.6% | |
| 2019 (est.) | 330 | [3] | −1.8% |
| U.S. Decennial Census[6] | |||
2020 census
| Race | Number | Percentage |
|---|---|---|
| White (NH) | 319 | 89.36% |
| Native American or Alaska Native (NH) | 2 | 0.56% |
| Asian (NH) | 3 | 0.84% |
| Pacific Islander (NH) | 1 | 0.28% |
| Some Other Race (NH) | 3 | 0.84% |
| Mixed/Multi-Racial (NH) | 4 | 1.12% |
| Hispanic or Latino | 25 | 7.0% |
| Total | 357 |
As of the 2020 United States census, there were 357 people, 120 households, and 78 families residing in the town.
2000 census
As of the census[4] of 2000, 408 people, 162 households, and 127 families resided in the town. The population density was 157.3 inhabitants per square mile (60.7/km2). The 172 housing units averaged 66.3 per square mile (25.6/km2). The racial makeup of the town was 95.10% White, 0.98% Native American, 2.45% from other races, and 1.47% from two or more races. Hispanics or Latinos of any race were 5.88% of the population.
Of the 162 households, 29.6% had children under the age of 18 living with them, 67.9% were married couples living together, 7.4% had a female householder with no husband present, and 21.6% were not families. About17.3% of all households were made up of individuals, and 8.6% had someone living alone who was 65 years of age or older. The average household size was 2.52 and the average family size was 2.87.
In the town, the population was distributed as 21.3% under the age of 18, 5.9% from 18 to 24, 27.7% from 25 to 44, 24.8% from 45 to 64, and 20.3% who were 65 years of age or older. The median age was 43 years. For every 100 females, there were 108.2 males. For every 100 females age 18 and over, there were 103.2 males.
The median income for a household in the town was $72,500, and for a family was $71,625. Males had a median income of $56,250 versus $37,833 for females. The per capita income for the town was $54,421. About 6.1% of families and 4.9% of the population were below the poverty line, including 23.0% of those under age 18 and 2.4% of those age 65 or over.
Education
Most of the town of Pleasant Valley is served by the Iowa Park Consolidated Independent School District while a small portion is in the City View Independent School District.[10] The districts operate Iowa Park High School and City View Junior/Senior High School, respectively.
References
- "2019 U.S. Gazetteer Files". United States Census Bureau. Retrieved August 7, 2020.
- U.S. Geological Survey Geographic Names Information System: Pleasant Valley, Texas
- "Population and Housing Unit Estimates". United States Census Bureau. May 24, 2020. Retrieved May 27, 2020.
- "U.S. Census website". United States Census Bureau. Retrieved January 31, 2008.
- "Population and Housing Unit Counts, 2010 Census of Population and Housing" (PDF). Texas: 2010. Retrieved January 5, 2017.
- "Census of Population and Housing". Census.gov. Retrieved June 4, 2015.
- "Explore Census Data". data.census.gov. Retrieved May 20, 2022.
- https://www.census.gov/
- "About the Hispanic Population and its Origin". www.census.gov. Retrieved May 18, 2022.
- "2020 CENSUS - SCHOOL DISTRICT REFERENCE MAP: Wichita County, TX" (PDF). U.S. Census Bureau. Retrieved June 28, 2022.
