Demographics of Portugal
Demographic features of the population of Portugal include population density, ethnicity, education level, health of the populace, economic status, religious affiliations and other aspects of the population.
| Demographics of Portugal | |
|---|---|
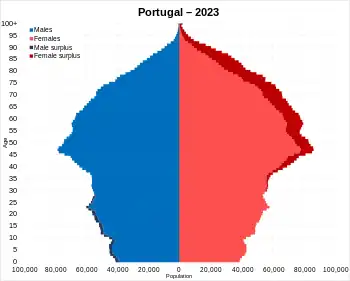 Population pyramid of Portugal as of 2023 | |
| Population | |
| Growth rate | 0.4% (2022) |
| Birth rate | 8.0 births/1,000 population (2022) |
| Death rate | 11.9 deaths/1,000 population (2022) |
| Life expectancy | 81.0 years (2022) |
| • male | 78.1 years (2022) |
| • female | 83.5 years (2022) |
| Fertility rate | |
| Infant mortality rate | 2.6 deaths/1,000 live births (2022) |
| Net migration rate | 8.3 migrant(s)/1,000 population (2022) |
| Age structure | |
| 0–14 years | 12.91% (2022) |
| 15–64 years | 63.13% (2022) |
| 65 and over | 23.96% (2022) |
| Sex ratio | |
| Total | 0.9 male(s)/female (2022) |
| At birth | 1.05 male(s)/female (2022) |
| Nationality | |
| Nationality | Portuguese |
| Major ethnic | Portuguese |
| Language | |
| Official | Portuguese |
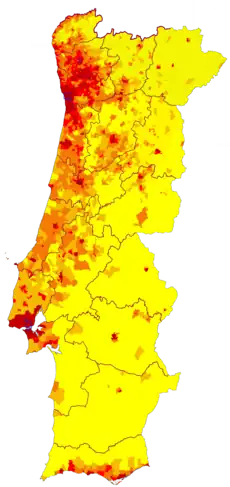
As of 31 December 2022, Portugal had an estimated population of 10,467,366 inhabitants.[1] Its population density, at 113.5 inhabitants per square kilometre (294/sq mi), is slightly higher than that of most EU countries, moderately surpassing the EU average of 108.9 inhabitants per square kilometre (282/sq mi).[2][3] However, the distribution of the population is widely uneven; the most densely populated areas are the Lisbon metropolitan area (which contains well above a quarter of the country's population), the metropolitan areas of Porto and the Atlantic coast, while other vast areas are very sparsely populated, like the plateaus of Alentejo, the Trás-os-Montes and Serra da Estrela highlands, and the lesser islands of the Azores archipelago.
The population of the country almost doubled during the twentieth century (+91%), but the pattern of growth was extremely uneven due to large-scale internal migration from the rural North to the industrial cities of Lisbon and Porto, a phenomenon which happened as a consequence of the robust economic growth and structural modernisation, owing to a liberalisation of the economy of the 1960s.
High fertility and birth rates persisted until the 1980s, after which they started to dramatically decline, leading to rapid population aging. At the end of the first decade of the 21st century, almost one in five Portuguese was over 65 years old.[4] Lately, Portugal has been experiencing a short growth in birth rates. The total fertility rate has climbed from an all-time low of 1.21 children per woman in 2013 to 1.43 in 2022, still well below replacement level.
Due to decrease in emigration and increase in immigration in the late 1990s and early 2000s the total population reached its peak in December 2009, standing at 10,573,479. Since then, due to the 2008 financial crisis, immigration (that was- in some years - surpassed by emigration) could not offset a shrinking population size, mainly due to the low birthrate but, also due to aging, the rising mortality. After having decreased by 2.27% by 2018, the total Population of Portugal started to grow again, mainly sustained by growing immigration and slightly increasing birth rates.[5][6]
Portugal is a fairly linguistically and religiously homogeneous country. Ethnically, the Portuguese people form a big majority of the total population in Portugal. The Portuguese people are mainly a combination of ancient paleolithic populations, and the proto-Celtic, Celtic and Iberian tribes, para-Celtic Lusitanians. Some other groups, like the Romans, Germanic (Visigoths, Suevi, Buri, Alans and Vandals) and later the Moorish (Arabs and Berber), Sephardic Jewish, and the French also passed through the country.
Today, Brazilians, Britons, Indians, Italians, French, Ukrainians, Nepalis and countries members of PALOP (Portuguese-speaking African countries) are the main immigrants and form the major foreign communities in the country.[7][8]
Portuguese is spoken throughout the country, with only some villages near the northern municipality of Miranda do Douro speaking Mirandese, locally recognised as a co-official language.
Total fertility rate from 1850 to 1899

The total fertility rate is the number of children born per woman. It is based on fairly good data for the entire period. Sources: Our World In Data and Gapminder Foundation.[9]
| Years | 1850 | 1851 | 1852 | 1853 | 1854 | 1855 | 1856 | 1857 | 1858 | 1859 | 1860[9] |
|---|---|---|---|---|---|---|---|---|---|---|---|
| Total Fertility Rate in Portugal | 4.5 | 4.47 | 4.44 | 4.41 | 4.38 | 4.35 | 4.33 | 4.3 | 4.27 | 4.24 | 4.21 |
| Years | 1861 | 1862 | 1863 | 1864 | 1865 | 1866 | 1867 | 1868 | 1869 | 1870[9] |
|---|---|---|---|---|---|---|---|---|---|---|
| Total Fertility Rate in Portugal | 4.18 | 4.15 | 4.12 | 4.09 | 4.1 | 4.11 | 4.12 | 4.14 | 4.15 | 4.16 |
| Years | 1871 | 1872 | 1873 | 1874 | 1875 | 1876 | 1877 | 1878 | 1879 | 1880[9] |
|---|---|---|---|---|---|---|---|---|---|---|
| Total Fertility Rate in Portugal | 4.17 | 4.18 | 4.19 | 4.2 | 4.21 | 4.22 | 4.23 | 4.24 | 4.23 | 4.22 |
| Years | 1881 | 1882 | 1883 | 1884 | 1885 | 1886 | 1887 | 1888 | 1889 | 1890[9] |
|---|---|---|---|---|---|---|---|---|---|---|
| Total Fertility Rate in Portugal | 4.91 | 4.19 | 4.18 | 4.17 | 4.16 | 4.15 | 4.38 | 4.3 | 4.38 | 4.24 |
| Years | 1891 | 1892 | 1893 | 1894 | 1895 | 1896 | 1897 | 1898 | 1899[9] |
|---|---|---|---|---|---|---|---|---|---|
| Total Fertility Rate in Portugal | 4.16 | 4.06 | 4.15 | 3.86 | 3.9 | 3.9 | 3.95 | 3.93 | 3.89 |
Vital statistics since 1900
| [11][12] [13][14][15] |
Average population (December 31) | Live births | Deaths | Natural change | Crude birth rate (per 1000) | Crude death rate (per 1000) | Natural change (per 1000) | Crude migration change (per 1000) | Total fertility rates[fn 1][9][16][17][18] |
|---|---|---|---|---|---|---|---|---|---|
| 1900 | 5,410,000 | 165,245 | 110,330 | 54,915 | 30.5 | 20.3 | 10.2 | 3.96 | |
| 1901 | 5,460,000 | 170,773 | 114,130 | 56,643 | 31.3 | 20.9 | 10.4 | -1.2 | 4.07 |
| 1902 | 5,490,000 | 176,029 | 108,378 | 67,651 | 32.0 | 19.7 | 12.4 | -6.9 | 4.16 |
| 1903 | 5,560,000 | 183,138 | 111,685 | 71,453 | 33.0 | 20.1 | 12.9 | -0.1 | 4.29 |
| 1904 | 5,600,000 | 176,726 | 105,572 | 71,154 | 31.6 | 18.9 | 12.7 | -5.5 | 4.11 |
| 1905 | 5,660,000 | 179,746 | 112,756 | 66,990 | 31.8 | 20.0 | 11.8 | -1.1 | 4.13 |
| 1906 | 5,690,000 | 182,920 | 125,243 | 57,677 | 32.1 | 22.0 | 10.1 | -4.8 | 4.17 |
| 1907 | 5,730,000 | 176,417 | 113,254 | 63,163 | 30.7 | 19.7 | 11.0 | -4.0 | 3.99 |
| 1908 | 5,790,000 | 175,268 | 115,876 | 59,392 | 30.3 | 20.0 | 10.2 | 0.3 | 3.94 |
| 1909 | 5,850,000 | 174,753 | 112,421 | 62,332 | 29.9 | 19.2 | 10.8 | -0.3 | 3.89 |
| 1910 | 5,890,000 | 186,953 | 113,161 | 73,792 | 31.7 | 19.2 | 12.5 | -5.7 | 4.12 |
| 1911 | 5,960,000 | 230,033 | 130,900 | 99,133 | 38.6 | 22.0 | 16.6 | -4.7 | 5.02 |
| 1912 | 5,960,000 | 207,870 | 119,578 | 88,292 | 34.9 | 20.1 | 14.8 | -14.8 | 4.54 |
| 1913 | 5,970,000 | 193,906 | 123,054 | 70,852 | 32.5 | 20.6 | 11.9 | -10.2 | 4.22 |
| 1914 | 5,980,000 | 188,479 | 115,526 | 72,953 | 31.5 | 19.3 | 12.0 | -10.3 | 4.09 |
| 1915 | 5,990,000 | 195,225 | 122,513 | 72,712 | 32.6 | 20.5 | 12.0 | -10.3 | 4.24 |
| 1916 | 6,000,000 | 192,780 | 129,389 | 63,391 | 32.1 | 21.6 | 10.7 | -9.0 | 4.17 |
| 1917 | 6,000,000 | 188,391 | 134,082 | 54,309 | 31.4 | 22.3 | 9.1 | -9.1 | 4.08 |
| 1918 | 6,020,000 | 178,687 | 248,978 | -70,291 | 29.7 | 41.4 | -11.6 | 14.9 | 3.86 |
| 1919 | 6,020,000 | 166,162 | 152,856 | 13,306 | 27.6 | 25.4 | 2.2 | -2.2 | 3.59 |
| 1920 | 6,040,000 | 202,908 | 142,862 | 60,046 | 33.6 | 23.7 | 9.9 | -6.6 | 4.37 |
| 1921 | 6,070,000 | 197,022 | 126,316 | 70,706 | 32.4 | 20.8 | 11.7 | -6.7 | 4.21 |
| 1922 | 6,170,000 | 203,727 | 125,747 | 77,980 | 33.1 | 20.4 | 12.6 | 3.9 | 4.3 |
| 1923 | 6,240,000 | 207,172 | 141,775 | 65,397 | 33.2 | 22.7 | 10.5 | 0.8 | 4.32 |
| 1924 | 6,310,000 | 207,440 | 126,052 | 81,388 | 32.8 | 20.0 | 12.8 | -1.6 | 4.26 |
| 1925 | 6,370,000 | 208,434 | 117,413 | 91,021 | 32.6 | 18.4 | 14.3 | -4.8 | 4.24 |
| 1926 | 6,470,000 | 214,633 | 127,959 | 86,674 | 33.5 | 19.8 | 13.4 | 2.3 | 4.36 |
| 1927 | 6,550,000 | 199,399 | 123,382 | 76,017 | 31.0 | 18.8 | 11.6 | 0.8 | 4.03 |
| 1928 | 6,620,000 | 211,314 | 124,088 | 87,226 | 31.9 | 18.7 | 13.2 | -2.5 | 4.15 |
| 1929 | 6,720,000 | 200,874 | 118,824 | 82,050 | 29.9 | 17.7 | 12.2 | 2.9 | 3.89 |
| 1930 | 6,804,000 | 202,529 | 116,352 | 86,177 | 29.7 | 17.1 | 12.7 | -0.2 | 3.86 |
| 1931 | 6,860,000 | 204,120 | 115,225 | 88,895 | 29.7 | 16.8 | 13.0 | -4.8 | 3.86 |
| 1932 | 6,968,000 | 208,062 | 118,895 | 89,167 | 29.9 | 17.1 | 12.8 | 2.9 | 3.89 |
| 1933 | 7,057,000 | 204,315 | 120,996 | 83,319 | 28.9 | 17.2 | 11.8 | 1.0 | 3.88 |
| 1934 | 7,147,000 | 203,158 | 118,539 | 84,619 | 28.4 | 16.6 | 11.8 | 1.0 | 3.74 |
| 1935 | 7,237,000 | 203,943 | 123,051 | 80,892 | 28.2 | 17.0 | 11.2 | 1.4 | 3.59 |
| 1936 | 7,326,000 | 205,615 | 119,003 | 86,612 | 28.1 | 16.2 | 11.8 | 0.5 | 3.45 |
| 1937 | 7,416,000 | 198,217 | 117,291 | 80,926 | 26.7 | 15.8 | 10.9 | 1.4 | 3.39 |
| 1938 | 7,506,000 | 199,467 | 115,331 | 84,136 | 26.6 | 15.4 | 11.2 | 0.9 | 3.34 |
| 1939 | 7,595,000 | 198,888 | 116,075 | 82,813 | 26.2 | 15.3 | 10.9 | 1.0 | 3.28 |
| 1940 | 7,696,000 | 187,892 | 120,486 | 67,406 | 24.4 | 15.7 | 8.8 | 4.5 | 3.22 |
| 1941 | 7,750,000 | 184,336 | 134,937 | 49,399 | 23.8 | 17.4 | 6.4 | 0.6 | 3.12 |
| 1942 | 7,810,000 | 187,503 | 126,531 | 60,972 | 24.0 | 16.1 | 7.8 | -0.1 | 3.14 |
| 1943 | 7,890,000 | 198,101 | 121,887 | 76,214 | 25.1 | 15.3 | 9.7 | 0.5 | 3.27 |
| 1944 | 7,960,000 | 201,373 | 119,275 | 82,098 | 25.3 | 14.8 | 10.3 | -1.4 | 3.28 |
| 1945 | 8,040,000 | 209,131 | 115,596 | 93,535 | 26.0 | 14.2 | 11.6 | -1.5 | 3.39 |
| 1946 | 8,100,000 | 205,825 | 120,800 | 85,025 | 25.4 | 14.9 | 10.5 | -3.0 | 3.29 |
| 1947 | 8,180,000 | 200,488 | 110,437 | 90,051 | 24.5 | 13.5 | 11.0 | -1.1 | 3.14 |
| 1948 | 8,262,000 | 220,981 | 107,576 | 113,405 | 26.7 | 13.0 | 13.7 | -3.7 | 3.42 |
| 1949 | 8,333,000 | 212,260 | 117,499 | 94,761 | 25.5 | 14.1 | 11.4 | -2.8 | 3.23 |
| 1950 | 8,405,000 | 205,163 | 102,798 | 102,365 | 24.4 | 12.2 | 12.2 | -3.6 | 3.1 |
| 1951 | 8,459,000 | 207,870 | 105,473 | 102,397 | 24.6 | 12.5 | 12.1 | -5.7 | 3.1 |
| 1952 | 8,496,000 | 211,213 | 100,486 | 110,727 | 24.9 | 11.8 | 13.0 | -8.6 | 3.1 |
| 1953 | 8,534,000 | 202,135 | 97,460 | 104,675 | 23.7 | 11.4 | 12.3 | -7.8 | 3.1 |
| 1954 | 8,570,000 | 197,536 | 95,088 | 102,448 | 23.0 | 11.1 | 12.0 | -7.8 | 3.1 |
| 1955 | 8,610,000 | 209,790 | 99,472 | 110,318 | 24.4 | 11.6 | 12.8 | -8.1 | 3.1 |
| 1956 | 8,647,000 | 202,667 | 106,919 | 95,748 | 23.4 | 12.4 | 11.1 | -6.8 | 3.11 |
| 1957 | 8,680,000 | 211,494 | 101,784 | 109,710 | 24.4 | 11.7 | 12.6 | -8.8 | 3.12 |
| 1958 | 8,725,000 | 212,467 | 91,891 | 120,576 | 24.4 | 10.5 | 13.8 | -8.6 | 3.13 |
| 1959 | 8,826,000 | 213,062 | 97,754 | 115,308 | 24.3 | 11.1 | 13.1 | -1.5 | 3.15 |
| 1960 | 8,865,000 | 213,895 | 95,009 | 118,886 | 23.9 | 10.6 | 13.3 | 8.9 | 3.16 |
| 1961 | 8,929,000 | 217,516 | 99,590 | 117,926 | 24.3 | 11.1 | 13.2 | -6.0 | 3.18 |
| 1962 | 8,994,000 | 220,200 | 96,864 | 123,336 | 24.4 | 10.7 | 13.7 | -6.4 | 3.18 |
| 1963 | 9,031,000 | 212,152 | 98,011 | 114,141 | 23.4 | 10.8 | 12.6 | -8.5 | 3.19 |
| 1964 | 9,034,000 | 217,136 | 96,878 | 120,258 | 23.8 | 10.6 | 13.2 | -12.9 | 3.19 |
| 1965 | 8,999,000 | 210,299 | 95,187 | 115,112 | 23.0 | 10.4 | 12.6 | -16.5 | 3.18 |
| 1966 | 8,931,000 | 206,940 | 100,088 | 106,852 | 22.7 | 11.0 | 12 | -19.6 | 3.16 |
| 1967 | 8,875,000 | 202,061 | 95,816 | 106,245 | 22.2 | 10.5 | 11.7 | -18.0 | 3.13 |
| 1968 | 8,837,000 | 194,962 | 94,661 | 100,301 | 21.4 | 10.4 | 11.0 | -15.3 | 3.09 |
| 1969 | 8,758,000 | 189,739 | 101,088 | 88,651 | 20.9 | 11.1 | 9.7 | -18.6 | 3.05 |
| 1970 | 8,663,252 | 180,690 | 92,854 | 87,836 | 20.9 | 10.7 | 10.1 | -20.9 | 2.99 |
| 1971 | 8,624,258 | 181,243 | 98,355 | 82,888 | 21.0 | 11.4 | 9.6 | -14.1 | 2.99 |
| 1972 | 8,636,603 | 174,685 | 90,025 | 84,660 | 20.2 | 10.4 | 9.8 | -8.4 | 2.85 |
| 1973 | 8,629,598 | 172,324 | 95,239 | 77,085 | 20.0 | 11.0 | 8.9 | -9.7 | 2.76 |
| 1974 | 8,879,127 | 171,979 | 96,837 | 75,142 | 19.4 | 10.9 | 8.5 | 20.2 | 2.69 |
| 1975 | 9,307,815 | 179,648 | 97,750 | 81,898 | 19.3 | 10.5 | 8.8 | 39.5 | 2.75 |
| 1976 | 9,403,809 | 186,712 | 101,843 | 84,869 | 19.9 | 10.8 | 9.0 | 1.3 | 2.81 |
| 1977 | 9,507,536 | 181,064 | 95,917 | 85,147 | 19.0 | 10.1 | 9.0 | 2.0 | 2.68 |
| 1978 | 9,608,959 | 167,467 | 96,042 | 71,425 | 17.4 | 10.0 | 7.4 | 3.3 | 2.45 |
| 1979 | 9,713,570 | 160,311 | 92,566 | 67,745 | 16.5 | 9.5 | 7.0 | 3.9 | 2.31 |
| 1980 | 9,818,980 | 158,309 | 94,794 | 63,515 | 16.1 | 9.7 | 6.5 | 4.4 | 2.25 |
| 1981 | 9,883,670 | 152,071 | 95,728 | 56,343 | 15.4 | 9.7 | 5.7 | 0.9 | 2.13 |
| 1982 | 9,939,871 | 151,002 | 92,379 | 58,623 | 15.2 | 9.3 | 5.9 | -0.2 | 2.08 |
| 1983 | 9,975,859 | 144,296 | 96,179 | 48,117 | 14.5 | 9.6 | 4.8 | -1.2 | 1.96 |
| 1984 | 10,016,605 | 142,783 | 96,975 | 45,808 | 14.3 | 9.7 | 4.6 | -0.5 | 1.91 |
| 1985 | 10,030,621 | 130,450 | 97,085 | 33,365 | 13.0 | 9.7 | 3.3 | -1.9 | 1.73 |
| 1986 | 10,034,846 | 126,715 | 95,521 | 31,194 | 12.6 | 9.5 | 3.1 | -2.7 | 1.67 |
| 1987 | 10,025,215 | 123,179 | 95,102 | 28,077 | 12.3 | 9.5 | 2.8 | -3.8 | 1.63 |
| 1988 | 10,014,005 | 122,093 | 97,844 | 24,249 | 12.2 | 9.8 | 2.4 | -3.5 | 1.62 |
| 1989 | 9,995,995 | 118,483 | 95,743 | 22,740 | 11.9 | 9.6 | 2.3 | -4.1 | 1.58 |
| 1990 | 9,970,441 | 116,321 | 102,768 | 13,553 | 11.7 | 10.3 | 1.4 | -4.0 | 1.57 |
| 1991 | 9,950,029 | 116,299 | 103,882 | 12,417 | 11.7 | 10.4 | 1.2 | -3.2 | 1.56 |
| 1992 | 9,954,958 | 114,924 | 100,638 | 14,286 | 11.5 | 10.1 | 1.4 | -0.9 | 1.54 |
| 1993 | 9,974,391 | 113,960 | 105,950 | 8,010 | 11.4 | 10.6 | 0.8 | 1.2 | 1.52 |
| 1994 | 10,008,659 | 109,227 | 99,232 | 9,995 | 10.9 | 9.9 | 1.0 | 2.4 | 1.45 |
| 1995 | 10,043,693 | 107,097 | 103,475 | 3,622 | 10.7 | 10.3 | 0.4 | 3.1 | 1.41 |
| 1996 | 10,084,196 | 110,261 | 106,881 | 3,380 | 10.9 | 10.6 | 0.3 | 3.7 | 1.45 |
| 1997 | 10,133,758 | 112,933 | 104,778 | 8,155 | 11.1 | 10.3 | 0.8 | 4.1 | 1.47 |
| 1998 | 10,186,634 | 113,384 | 106,198 | 7,186 | 11.1 | 10.4 | 0.7 | 4.5 | 1.48 |
| 1999 | 10,249,022 | 116,002 | 107,871 | 8,131 | 11.3 | 10.5 | 0.8 | 5.3 | 1.51 |
| 2000 | 10,330,774 | 120,008 | 105,364 | 14,644 | 11.6 | 10.2 | 1.4 | 6.6 | 1.55 |
| 2001 | 10,394,669 | 112,774 | 105,092 | 7,682 | 10.8 | 10.1 | 0.7 | 5.5 | 1.45 |
| 2002 | 10,444,592 | 114,383 | 106,258 | 8,125 | 11.0 | 10.2 | 0.8 | 4.0 | 1.47 |
| 2003 | 10,473,050 | 112,515 | 108,795 | 3,720 | 10.7 | 10.4 | 0.4 | 2.3 | 1.44 |
| 2004 | 10,494,672 | 109,298 | 102,012 | 7,286 | 10.4 | 9.7 | 0.7 | 1.4 | 1.41 |
| 2005 | 10,511,988 | 109,399 | 107,464 | 1,935 | 10.4 | 10.2 | 0.2 | 1.4 | 1.42 |
| 2006 | 10,532,588 | 105,449 | 101,990 | 3,459 | 10.0 | 9.7 | 0.3 | 1.7 | 1.38 |
| 2007 | 10,553,339 | 102,492 | 103,512 | -1,020 | 9.7 | 9.8 | -0.1 | 2.1 | 1.35 |
| 2008 | 10,563,014 | 104,594 | 104,280 | 314 | 9.9 | 9.9 | 0.0 | 0.8 | 1.40 |
| 2009 | 10,573,479 | 99,491 | 104,434 | -4,943 | 9.4 | 9.9 | -0.5 | 1.5 | 1.35 |
| 2010 | 10,572,721 | 101,381 | 105,954 | -4,573 | 9.6 | 10.0 | -0.4 | 0.3 | 1.39 |
| 2011 | 10,558,950 | 96,856 | 102,848 | -5,992 | 9.2 | 9.8 | -0.6 | -0.7 | 1.35 |
| 2012 | 10,503,889 | 89,841 | 107,612 | -17,771 | 8.6 | 10.3 | -1.7 | -3.5 | 1.28 |
| 2013 | 10,444,092 | 82,787 | 106,554 | -23,767 | 7.9 | 10.2 | -2.3 | -3.4 | 1.21 |
| 2014 | 10,395,121 | 82,367 | 104,843 | -22,476 | 7.9 | 10.1 | -2.2 | -2.5 | 1.23 |
| 2015 | 10,368,554 | 85,500 | 108,539 | -23,039 | 8.3 | 10.5 | -2.2 | -0.4 | 1.30 |
| 2016 | 10,344,478 | 87,126 | 110,573 | -23,447 | 8.5 | 10.7 | -2.3 | 0 | 1.36 |
| 2017 | 10,335,770 | 86,154 | 109,758 | -23,604 | 8.4 | 10.7 | -2.3 | 1.5 | 1.37 |
| 2018 | 10,333,496 | 87,020 | 113,051 | -26,031 | 8.5 | 11.0 | -2.5 | 2.3 | 1.41 |
| 2019 | 10,375,395 | 86,579 | 111,843 | -25,264 | 8.4 | 10.9 | -2.4 | 6.5 | 1.42 |
| 2020 | 10,394,297 | 84,530 | 123,396 | -38,866 | 8.2 | 12.0 | -3.8 | 5.6 | 1.40 |
| 2021 | 10,421,117 | 79,582 | 124,802 | -45,220 | 7.7 | 12.1 | -4.4 | 7.0 | 1.34 |
| 2022 | 10,467,366 | 83,671 | 124,311 | -40,640 | 8.0 | 11.9 | -3.9 | 8.3 | 1.43 |
Current vital statistics
| Period | Live births | Deaths | Natural increase |
|---|---|---|---|
| January - August 2022 | 54,303 | 84,081 | -29,588 |
| January - August 2023 | 55,969 | 78,955 | -22,786 |
| Difference |
Structure of the population
| Age Group | Male | Female | Total | % |
|---|---|---|---|---|
| Total | 4 920 220 | 5 422 846 | 10 343 066 | 100.00 |
| 0–4 | 208 689 | 198 905 | 407 594 | 3.94 |
| 5–9 | 221 992 | 210 702 | 432 694 | 4.18 |
| 10–14 | 251 563 | 239 337 | 490 900 | 4.75 |
| 15–19 | 270 711 | 257 479 | 528 190 | 5.11 |
| 20–24 | 285 462 | 274 435 | 559 897 | 5.41 |
| 25–29 | 273 438 | 268 423 | 541 861 | 5.24 |
| 30–34 | 278 300 | 282 785 | 561 085 | 5.42 |
| 35–39 | 313 475 | 331 757 | 645 232 | 6.24 |
| 40–44 | 364 509 | 393 113 | 757 622 | 7.32 |
| 45–49 | 382 137 | 415 656 | 797 793 | 7.71 |
| 50–54 | 356 341 | 392 588 | 748 929 | 7.24 |
| 55–59 | 348 875 | 394 413 | 743 288 | 7.19 |
| 60–64 | 327 940 | 376 402 | 704 342 | 6.81 |
| 65–69 | 302 342 | 351 752 | 654 094 | 6.32 |
| 70–74 | 267 952 | 321 980 | 589 932 | 5.70 |
| 75–79 | 202 153 | 264 483 | 466 636 | 4.51 |
| 80–84 | 146 239 | 213 752 | 359 991 | 3.48 |
| 85+ | 118 102 | 234 884 | 352 986 | 3.41 |
| Age group | Male | Female | Total | Percent |
| 0–14 | 682 244 | 648 944 | 1 331 188 | 12.87 |
| 15–64 | 3 201 188 | 3 387 051 | 6 588 239 | 63.70 |
| 65+ | 1 036 788 | 1 386 851 | 2 423 639 | 23.43 |
Maps
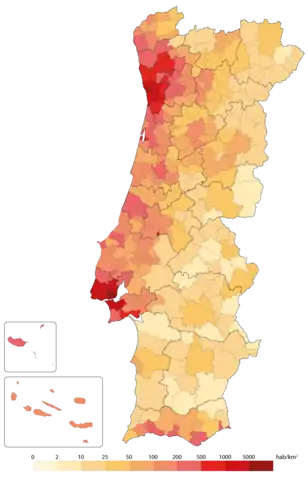 Population density by municipality in Portugal (2020).
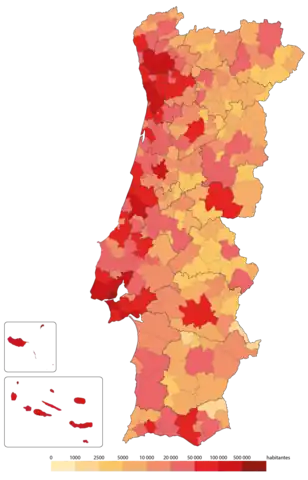 Population by municipality in Portugal (2020).
 Population change by municipality in Portugal between 2001 and 2011.
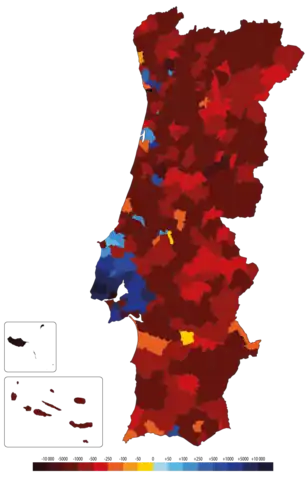 Population change by municipality in Portugal between 2011 and 2020.
Other demographic statistics
| Year | Pop. | ±% p.a. |
|---|---|---|
| 1422 | 1,043,274 | — |
| 1527 | 1,262,376 | +0.18% |
| 1636 | 1,100,000 | −0.13% |
| 1736 | 2,143,368 | +0.67% |
| 1770 | 2,850,444 | +0.84% |
| 1776 | 3,352,310 | +2.74% |
| 1801 | 2,931,930 | −0.53% |
| 1811 | 2,876,602 | −0.19% |
| 1838 | 3,200,000 | +0.40% |
| 1849 | 3,411,454 | +0.58% |
| 1864 | 4,188,419 | +1.38% |
| 1878 | 4,550,699 | +0.59% |
| 1890 | 5,049,729 | +0.87% |
| 1900 | 5,423,132 | +0.72% |
| 1911 | 5,969,056 | +0.88% |
| 1920 | 6,032,991 | +0.12% |
| 1930 | 6,825,883 | +1.24% |
| 1940 | 7,722,152 | +1.24% |
| 1950 | 8,510,240 | +0.98% |
| 1960 | 8,851,240 | +0.39% |
| 1970 | 8,648,369 | −0.23% |
| 1981 | 9,833,041 | +1.17% |
| 1991 | 9,862,540 | +0.03% |
| 2001 | 10,356,117 | +0.49% |
| 2011 | 10,562,178 | +0.20% |
| 2021 | 10,343,066 | −0.21% |
| Source: INE 2021[24][25][26] 1422, 1527 and 1636 only adult male population. | ||
The following demographic statistics are from the World Population Review.[27]
- One birth every 7 minutes
- One death every 5 minutes
- One net migrant every 53 minutes
- Net loss of one person every 22 minutes
The following demographic statistics are from the CIA World Factbook, unless otherwise indicated.[18]
- Age structure of the resident population
- 2022 official INE estimate:[29]
- 0-14 years: 12.91% (male 692,144 /female 658,867)
- 15-64 years: 63.13% (male 3,229,174 /female 3,379,259)
- 65 years and over: 23.96% (male 1,080,493 /female 1,427,429)
- Median age
- total: 46.8 years (2022 official Eurostat data)[30][31]
- male: 45.1 years
- female: 48.3 years
- Life expectancy at birth
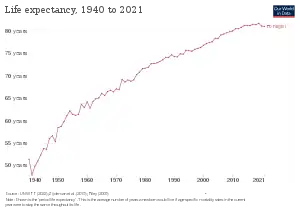

| Period | Life expectancy in Years |
Period | Life expectancy in Years |
|---|---|---|---|
| 1950–1955 | 60.3 | 1985–1990 | 74.0 |
| 1955–1960 | 62.4 | 1990–1995 | 74.9 |
| 1960–1965 | 64.5 | 1995–2000 | 76.0 |
| 1965–1970 | 66.4 | 2000–2005 | 77.6 |
| 1970–1975 | 68.3 | 2005–2010 | 79.3 |
| 1975–1980 | 70.4 | 2010–2015 | 80.5 |
| 1980–1985 | 72.5 | 2015-2019 | 82.0 |
Source: UN World Population Prospects[37]
- Infant mortality rate
- total: 2.59 deaths/1,000 live births. Country comparison to the world: 216th
- male: 2.75 deaths/1,000 live births
- female: 2.43 deaths/1,000 live births (2022 official INE estimate)[38]
- Infant mortality rate
| Years[39] | 2000 | 2001 | 2002 | 2003 | 2004 | 2005 | 2005 | 2007 | 2008 | 2009 |
|---|---|---|---|---|---|---|---|---|---|---|
| Deaths/1,000 live births | 5.5 | 5.0 | 5.0 | 4.1 | 3.8 | 3.5 | 3.3 | 3.4 | 3.3 | 3.6 |
| Years | 2010 | 2011 | 2012 | 2013 | 2014 | 2015 | 2016 | 2017 | 2018 | 2019 |
| Deaths/1,000 live births | 2.5 | 3.1 | 3.4 | 2.9 | 2.9 | 2.9 | 3.2 | 2.7 | 3.3 | 2.9 |
| Years | 2020 | 2021 | 2022 | |||||||
| Deaths/1,000 live births | 2.4 | 2.4 | 2.6 |
- Dependency ratios
- total dependency ratio: 55.8
- youth dependency ratio: 20.3
- elderly dependency ratio: 35.5
- potential support ratio: 2.8 (2020 est.)
- Urbanization
- urban population: 67.9% of total population (2023)
- rate of urbanization: 0.44% annual rate of change (2020-25 est.)
Employment and income
- Unemployment, youth ages 15–24
- total: 23.1%. Country comparison to the world: 66th
- male: 20.6%
- female: 26.2% (2021 est.)
Urban organization
Metropolitan areas and agglomerations
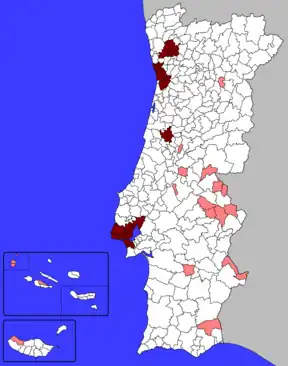
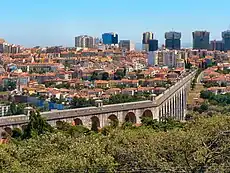
As of 2001 Census, Portugal had two significant agglomerations: Lisbon Metropolitan Region (3.34 million inhabitants) and Northern Littoral Urban-Metropolitan Region (or Porto Metropolitan Agglomeration) with 2.99 million people, the later with a polycentric nature.[43] These broader agglomerations are distinct from the political metropolitan areas of Lisbon and Porto – Grande Área Metropolitana de Lisboa (2,9 million) and Grande Área Metropolitana do Porto (1,7 million). Together they hold 45% of the total population.
| Image | City | Metropolitan area | Subregion | Core municipality |
|---|---|---|---|---|
 |
Lisbon | 2,870,208 [44] | 1,975,791[44] | 545,796[44] |
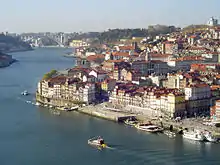 |
Porto | 1,736,228[44] | 1,278,210[44] | 231,800[44] |
Largest urban areas
When considering the number of inhabitants in consistent single urban areas, de facto cities in mainland Portugal, per the new with increased density of human-created structures, and excluding suburban and rural areas, Portugal has two cities with about one million inhabitants each (Lisbon and Porto), ten others with more than 50,000 inhabitants and 14 cities with populations between 20,000 and 40,000 inhabitants.[43]
Largest cities
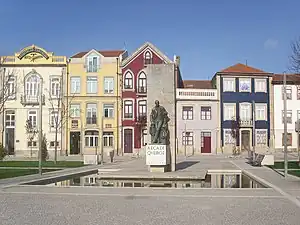
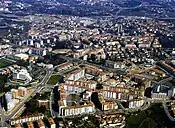
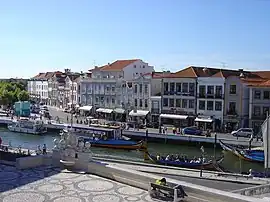
Portugal has 151 localities with national city status (cidade). Every city is included into a municipality (município). This is a list of population by city, which means that it refers to the number of inhabitants in the city proper, excluding inhabitants from the same municipality but living outside the urban area of the city in other civil parishes (freguesias) of the municipality. In some cases, the entire municipality and the city proper cover the same territory.[45][46]
_18.jpg.webp)
.jpg.webp)

Largest municipalities by population
The following table lists the largest Portuguese municipalities by population as of 2022. The land area is expressed in km2 and only municipalities with populations of over 100,000 inhabitants are listed.[2]
The 25 listed municipalities account for 45.05% of the country's population and for only 5.06% of its total land area.[47]

People
Nationality
- noun: Portuguese (singular and plural)
- adjective: Portuguese
Immigration

In 1992, 1.3% of the population was foreign, by 2022 the number had grown to almost 7,47% or 781,915 people.[48]
Since the independence of the former African colonies, Portugal saw a steady immigration from Africa, most notably Cape Verde, Angola and Guinea-Bissau, but also São Tomé and Príncipe, Mozambique and former Portuguese India in Asia.
Portugal saw migration waves due to labor shortages since 1999, first from Eastern Europe (1999–2002), in two distinctive groups, a Slav (Ukraine, Russia and Bulgaria) and an East Latin (Romania and Moldova), that stopped and started declining as the labour market became saturated.
Since 2003, most of the immigrants came from Brazil, China and the Indian subcontinent. Family reunification was seen as important for a successful integration in the country, thus the government eased it, and in 2006, more than 6 in 10 new immigrants were family members of legal foreign residents in the country.[49]
There is also a significant number of elderly Western European residents in search of quality of life, namely from the United Kingdom, France, Germany, the Netherlands and Belgium.
More recently, there is significant migration from the former Portuguese colony of Brazil, as since 2017 more than 30,000 Brazilians immigrate to Portugal annually.
Below is a summary table of the main foreign nationalities present in Portugal according to the latest SEFSTAT data.[48] As of December 31, 2022, there were 781,247 legally resident people in Portugal with foreign citizenship (about 7.47% of the population). These include both citizens born in Portugal with foreign citizenship and foreign immigrants. Descendants of immigrants are excluded (Portugal, like many European countries, does not collect data on ethnicity) and those who, regardless of place of birth or citizenship at birth, were Portuguese citizens (see also Portuguese nationality law). Among the latter are also naturalized citizens whose data are reported in the next table.
| Nationality | Population[48] |
|---|---|
| 239,744 | |
| 45,218 | |
| 36,748 | |
| 35,416 | |
| 34,039 | |
| 31,761 | |
| 27,512 | |
| 25,445 | |
| 23,839 | |
| 23,737 | |
| 23,393 | |
| 22,000 | |
| 20,500 | |
| 19,508 | |
| 16,468 | |
| 13,077 | |
| 12,066 | |
| 10,828 | |
| 9,794 | |
| 8,936 | |
| 6,088 | |
| 6,075 | |
| 5,653 | |
| 5,243 | |
| 5,139 | |
| 4,785 | |
| 4,326 | |
| 4,159 | |
| 3,501 | |
| 2,575 | |
| 2,162 | |
| 2,135 | |
| 2,014 | |
| 1,977 | |
| 1,643 | |
| 1,624 | |
| 1,583 | |
| 1,483 | |
| 1,431 | |
| 1,367 | |
| 1,297 | |
| 1,230 | |
| 1,210 | |
| 1,208 | |
| 1,193 | |
| 1,182 | |
| 1,086 | |
| 1,079 | |
| 1,050 | |
| 1,015 | |
| 1,006 | |
| Other countries (below 1,000) | 24,001 |
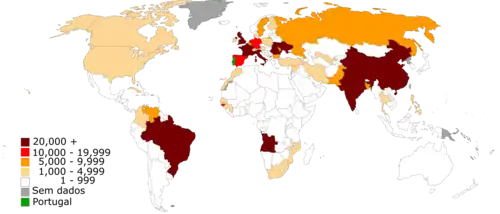
Below is a summary table of Portuguese citizenship acquisitions recorded between 2008 and 2022 for countries having recorded at least 1,000 naturalizations during the given timespan. During this period, 342,458 people (3.27% of the current Portuguese population) obtained Portuguese citizenship according to the latest Eurostat data. These people are not counted among foreigners (see above table) as they are Portuguese citizens in all respects.[50]
| Nationality | Acquisitions of Citizenship |
|---|---|
| 89,713 | |
| 55,109 | |
| 32,722 | |
| 27,043 | |
| 25,805 | |
| 19,212 | |
| 14,990 | |
| 12,202 | |
| 6,922 | |
| 6,473 | |
| 5,540 | |
| 5,288 | |
| 4,951 | |
| 3,682 | |
| 2,974 | |
| 2,579 | |
| 2,494 | |
| 2,332 | |
| 2,275 | |
| 1,885 | |
| 1,117 | |
| 1,069 | |
| 1,055 | |
| Other countries (below 1,000) | 15,026 |
Ethnic minorities and persons with disabilities
Portugal does not collect ethnicity or racial data of its population.[53]
Anti-racism laws prohibit and penalize racial discrimination in housing, business, and health services.
Discrimination against persons with disabilities in employment, education, access to health care, or the provision of other state services is illegal. The law mandates access to public buildings and to newly built private buildings for such persons.
Languages

The main language spoken as first language by the overwhelming majority of the population is Portuguese.[54] Other autochthonous languages spoken include:
- Caló (see also Caló language), the language of the Portuguese-Romani community. There are about 52,000 Romani people in Portugal.[55]
- Mirandês (see also Mirandese language), officially recognised as an official language.[56] It enjoys special protection in the area of Miranda do Douro. As of today, there are about 15,000 people who speak the language (0.14%).[57][58][59]
- Barranquenhu (see also Barranquenho), spoken in the town of Barrancos (in the border between Extremadura, Andalusia and Portugal). As of today, there are about 3,000 speakers of the language (0.03%).[60]
- Minderico – a sociolect or argot spoken in Minde, practically extinct. There are about 150 speakers left[61][62]
- Portuguese Sign Language, the official language for the deaf community in Portugal. There are about 30,000 deaf people (0.29%) in Portugal who use the language.[63] Interestingly, the first teacher of deaf-mutes in France was Portuguese-Jew Jacob Rodrigues Pereira.
Religion

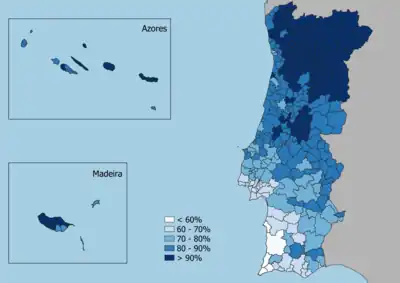
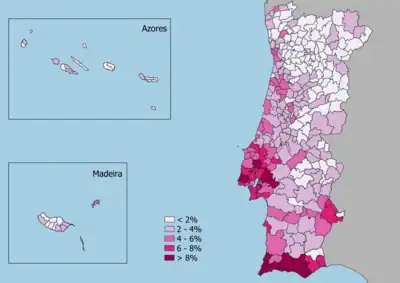
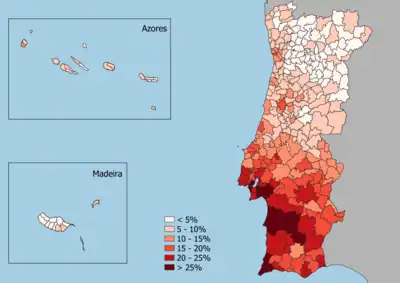
The great majority of the Portuguese population belongs to the Roman Catholic Church. Religious observance remains strong in northern areas, while the population of Lisbon and southern areas generally less devout.
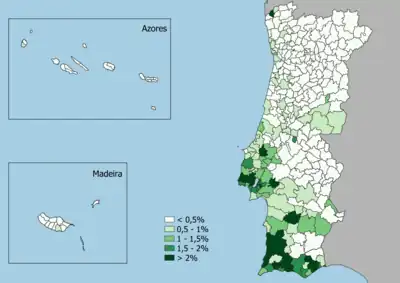
Religious minorities include a little over 400,000 Protestants and Mormons[65][66][67] (3.84% of the total population).
There are also about 100,000 Muslims[68] (1%) and 45,000 Hindus[69][70][71] (0.43%), most of whom came from Goa, a former Portuguese colony on the west coast of India (Some Muslims also came from former two Portuguese African colonies with important Muslim minorities: Guinea-Bissau and Mozambique).
There are also about 1,500 Jews,[72] 2,000 Baha'i[73] and 35,000 Sikh[69] (0.34%)
Portugal is also home to about 17,000 Buddhists,[74] mostly Chinese from Macau and a few Indians from Goa.
Portugal is still one of the most religious countries in Europe, most Portuguese believe with certainty in the Existence of God and religion plays an important role in the life of most Portuguese.[75][76] According to the Pew Research Center, 40% of Portuguese Catholics pray daily.[77]
Religious map of Portuguese municipalities
Religion by municipality according with the 2021 Census.
Education
.jpg.webp)
Literacy
definition: age 15 and over can read and write (2021 est.)[18]
- total population: 95.9%
- male: 97.8%
- female: 95.9% (2021 est.)
- School life expectancy (primary to tertiary education)
- total: 17 years
- male: 17 years
- female: 17 years (2020)
See also
- Portugal census
- Portugal
Notes
- In fertility rates, 2.1 and above is a stable population and has been marked blue, 2 and below leads to an aging population and the result is that the population decreases.
References
- "População residente aumenta mais de 46 mil pessoas - 2022". ine.pt. INE. Retrieved 15 June 2023.
- "Portugal population density".
- "Population density across the EU".
- "População residente: total e por grupo etário".
- "População residente: total e por sexo". www.pordata.pt. Retrieved 13 October 2023.
- "Statistics Portugal - Web Portal". www.ine.pt. Retrieved 13 October 2023.
- "Quase 800 mil estrangeiros vivem em Portugal e 30% são brasileiros". www.dn.pt (in European Portuguese). 23 June 2023. Retrieved 5 July 2023.
- "Statistics Portugal - Web Portal". www.ine.pt. Retrieved 5 July 2023.
- Max Roser (2014), "Total Fertility Rate around the world over the last centuries", Our World In Data, Gapminder Foundation
- Note: Crude migration change (per 1000) is a trend analysis, an extrapolation based average population change (current year minus previous) minus natural change of the current year (see table vital statistics). As average population is an estimate of the population in the middle of the year and not end of the year.
- B.R. Mitchell. European historical statistics, 1750–1975.
- "United Nations. Demographic Yearbook 1948" (PDF). Unstats.un.org. Retrieved 3 October 2017.
- "Statistics Portugal". Ine.pt. Retrieved 3 October 2017.
- "PORDATA – População residente: total e por sexo". Pordata.pt. Retrieved 3 October 2017.
- "População residente (N.º) por Local de residência (NUTS - 2013), Sexo e Grupo etário (Por ciclos de vida); Anual". ine.pt. INE. Retrieved 15 June 2023.
- "2011 WORLD POPULATION DATA SHEET" (PDF). Prb.org. Retrieved 3 October 2017.
- "2012 – Negative birth rate decreases further – Portugal – Portuguese American Journal". Portuguese-american-journal.com. 2 January 2013. Retrieved 3 October 2017.
- "World Factbook EUROPE : PORTUGAL", The World Factbook, 12 July 2018
- "Vital statistics".
- "Óbitos de residentes em Portugal: total e por mês de morte".
- "Óbitos (N.º) por Local de residência (NUTS - 2013) e Sexo; Mensal (2)".
- "Nados-vivos (N.º) por Local de residência da mãe (NUTS - 2013) e Sexo; Mensal (2)".
- "População residente (N.º) por Local de residência (à data dos Censos 2021), Sexo, Grupo etário e Naturalidade; Decenal - INE, Recenseamento da população e habitação - Censos 2021". www.ine.pt (in European Portuguese). Retrieved 22 May 2023.
- Nuno Valério (coord.), Estatísticas Históricas Portuguesas, Vol. I, pp. 33, 37 e 51. INE, 2001. (PDF: 4,18 MB)
- INE, CENSOS 2021 Censos 2021 - Divulgação dos Resultados Preliminares - 2021, 28 July 2021.
- INE, Estimativas de População Residente, Portugal, NUTS II, NUTS III e Municípios – 2006, Informação à Comunicação Social, 3 August 2007.
- World Population Review: Portugal Population 2018, 14 June 2018
- "Statistics Portugal - Web Portal". www.ine.pt. Retrieved 25 August 2023.
- "Statistics Portugal - Web Portal". www.ine.pt. Retrieved 25 August 2023.
- "Idade média: 46,8 anos. População portuguesa é a que mais está a envelhecer na UE". TSF Rádio Notícias (in European Portuguese). 22 February 2023. Retrieved 25 August 2023.
- "Population structure indicators at national level: Median age". ec.europa.eu. Retrieved 25 August 2023.
- "Taxa bruta de natalidade". www.pordata.pt. Retrieved 25 August 2023.
- "Taxa bruta de mortalidade". www.pordata.pt. Retrieved 25 August 2023.
- "Indicadores de fecundidade: Índice sintético de fecundidade e taxa bruta de reprodução". www.pordata.pt. Retrieved 25 August 2023.
- "População residente: total e por grupo etário". www.pordata.pt. Retrieved 25 August 2023.
- "Saldos populacionais anuais: saldo total, saldo natural e saldo migratório". www.pordata.pt. Retrieved 25 August 2023.
- "World Population Prospects – Population Division – United Nations". Retrieved 15 July 2017.
- "Taxa de mortalidade infantil (‰) por Sexo; Anual".
- "Taxa bruta de mortalidade e taxa de mortalidade infantil".
- "Nados-vivos de mães residentes em Portugal: total e por sexo".
- "População residente (N.º) por Local de residência (NUTS - 2013), Sexo e Grupo etário; Anual".
- "Relação de masculinidade".
- Fernando Nunes da Silva (2005), Alta Velocidade em Portugal, Desenvolvimento Regional, CENSUR, IST Archived 24 June 2009 at the Wayback Machine
- "Definitive Results of the 2021 Census". ine.pt. INE. Retrieved 26 November 2022.
- UMA POPULAÇÃO QUE SE URBANIZA, Uma avaliação recente – Cidades, 2004 Archived 6 October 2014 at the Wayback Machine Nuno Pires Soares, Instituto Geográfico Português (Geographic Institute of Portugal)
- "Portugal: Regions and Cities". CITY POPULATION - statistics, maps & charts. Retrieved 4 July 2023.
- "População residente (N.º) por Local de residência (NUTS - 2013), Sexo e Grupo etário (Por ciclos de vida); Anual".
- Imigração: Novos imigrantes legais em Portugal aumentaram 50% em 2006 – OCDE Archived 10 February 2012 at the Wayback Machine – RTP.pt
- "Eurostat".
- "Eurostat".
- "Portal do INE". www.ine.pt. Retrieved 30 September 2023.
- Shendruk, Amanda (8 July 2021). "Are you even trying to stop racism if you don't collect data on race?". Quartz. Retrieved 4 July 2022.
- Union, Publications Office of the European (20 June 2013). "Europeans and their languages : special Eurobarometer. 386, June 2012". op.europa.eu. Retrieved 11 May 2023.
- Portugal, Rádio e Televisão de. "Mais de 95% da etnia cigana em Portugal vive abaixo do limiar da pobreza". Mais de 95% da etnia cigana em Portugal vive abaixo do limiar da pobreza (in Portuguese). Retrieved 11 May 2023.
- Portuguesa, Observatório da Língua (31 July 2021). "A língua mirandesa é língua oficial em Portugal desde 1999". Observatório da Língua Portuguesa (in European Portuguese). Retrieved 11 May 2023.
- "Língua Mirandesa". Casa de Trás-os-Montes e Alto Douro de Lisboa (in European Portuguese). 31 May 2015. Retrieved 11 May 2023.
- SAPO. "Têm menos de 20 anos e sentem-se mais livres por falar mirandês". SAPO 24 (in Portuguese). Retrieved 11 May 2023.
- Assim se fala o mirandês (in Portuguese), retrieved 11 May 2023
- Rodrigues, Elisabete (7 February 2020). "O Barranquenho quer ser a 3ª língua oficial de Portugal". Sul Informação (in European Portuguese). Retrieved 11 May 2023.
- "A luta de Vera Ferreira para salvar o minderico". O MIRANTE | A luta de Vera Ferreira para salvar o minderico. (in European Portuguese). Retrieved 11 May 2023.
- Vicente, Manuel Fernandes (17 August 2009). "Minderico renasce com apoio da Volkswagen a línguas ameaçadas". PÚBLICO (in Portuguese). Retrieved 11 May 2023.
- "Língua Gestual Portuguesa (LGP)". Associação Portuguesa de Surdos (in European Portuguese). Retrieved 11 May 2023.
- "Censos 2021. Católicos diminuem, mas ainda são mais de 80% dos portugueses". RTP. 23 November 2022. Retrieved 23 November 2022.
- Henriques, Joana Gorjão (29 January 2017). "O crescimento discreto dos mórmones em Portugal". PÚBLICO (in Portuguese). Retrieved 11 May 2023.
- Lusa, Agência. "Aliança Evangélica comemora cem anos e diz haver 400 mil protestantes em Portugal". Observador (in European Portuguese). Retrieved 11 May 2023.
- "2022 bate recorde de novas igrejas, em especial evangélicas e graças aos cidadãos brasileiros". www.dn.pt (in European Portuguese). 8 April 2023. Retrieved 11 May 2023.
- ""A comunidade muçulmana em Portugal dá-nos uma grande tranquilidade na prevenção do terrorismo"". www.dn.pt (in European Portuguese). 20 September 2022. Retrieved 11 May 2023.
- "Uma comunidade indiana em Portugal diversa e dialogante na fé". SIC Notícias (in Portuguese). 5 May 2021. Retrieved 11 May 2023.
- ""Os meus filhos são hindus, portugueses e até rezam a ave-maria"". www.dn.pt (in European Portuguese). 17 October 2020. Retrieved 11 May 2023.
- "Cerca de 50.000 nepaleses entraram em Portugal nos últimos anos". www.dn.pt (in European Portuguese). 16 March 2022. Retrieved 11 May 2023.
- "Por que judeus estão voltando a Portugal séculos após antepassados serem expulsos e massacrados". BBC News Brasil (in Brazilian Portuguese). Retrieved 11 May 2023.
- "Portugal - Bahaipedia, an encyclopedia about the Bahá'í Faith". bahaipedia.org. Retrieved 11 May 2023.
- "Budismo em Portugal | União Budista". uniaobudista.pt. Retrieved 11 May 2023.
- Portugueses são mais cristãos e vão mais à igreja do que o resto da Europa ocidental
- Portugal é dos países onde mais pessoas garantem que Deus existe
- Five Centuries After Reformation, Catholic-Protestant Divide in Western Europe Has Faded Pew Research Center.


