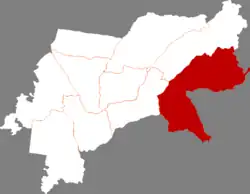
Qing'an County
Qing'an County (simplified Chinese: 庆安县; traditional Chinese: 慶安縣; pinyin: Qìng'ān Xiàn) is a county of west-central Heilongjiang province, People's Republic of China. It is under the jurisdiction of the prefecture-level city of Suihua.
Qing'an County
庆安县 | |
|---|---|
 Qing'an in Suihua | |
.png.webp) Suihua in Heilongjiang | |
| Coordinates: 46°52′48″N 127°30′29″E | |
| Country | People's Republic of China |
| Province | Heilongjiang |
| Prefecture-level city | Suihua |
| Area | |
| • Land | 5,468.7 km2 (2,111.5 sq mi) |
| Population (2010) | |
| • Total | 386,162 |
| Time zone | UTC+8 (China Standard) |
Administrative divisions
Qing'an County is divided into 4 subdistricts, 8 towns and 6 townships.[1]
- 3 subdistricts
- Jikang (吉康街道), Qingrui (庆瑞街道), Pingshun (平顺街道), Antai (安泰街道)
- 8 towns
- Qing'an (庆安镇), Minyue (民乐镇), Daluo (大罗镇), Ping'an (平安镇), Qinlao (勤劳镇), Jiusheng (久胜镇), Tongle (同乐镇), Liuhe (柳河镇)
- 6 townships
- Jianmin (建民乡), Jubaoshan (巨宝山乡), Fengshou (丰收乡), Fazhan (发展乡), Zhifu (致富乡), Huansheng (欢胜乡)
Demographics

Stone ornaments, neolithic age, unearthed from Lotus Pool No.2 Archaeological Site in Qing'an County
The population of the district was 366,985 in 1999.[2]
Climate
| Climate data for Qing'an (1991–2020 normals, extremes 1981–2010) | |||||||||||||
|---|---|---|---|---|---|---|---|---|---|---|---|---|---|
| Month | Jan | Feb | Mar | Apr | May | Jun | Jul | Aug | Sep | Oct | Nov | Dec | Year |
| Record high °C (°F) | 0.0 (32.0) |
8.5 (47.3) |
18.9 (66.0) |
28.5 (83.3) |
33.5 (92.3) |
37.5 (99.5) |
36.7 (98.1) |
35.8 (96.4) |
31.3 (88.3) |
25.8 (78.4) |
14.7 (58.5) |
3.9 (39.0) |
37.5 (99.5) |
| Average high °C (°F) | −14.8 (5.4) |
−8.6 (16.5) |
1.2 (34.2) |
12.5 (54.5) |
20.6 (69.1) |
25.6 (78.1) |
27.5 (81.5) |
25.8 (78.4) |
20.7 (69.3) |
11.1 (52.0) |
−2.0 (28.4) |
−12.6 (9.3) |
8.9 (48.1) |
| Daily mean °C (°F) | −20.8 (−5.4) |
−15.4 (4.3) |
−4.8 (23.4) |
6.4 (43.5) |
14.4 (57.9) |
20.2 (68.4) |
22.8 (73.0) |
20.7 (69.3) |
14.4 (57.9) |
5.4 (41.7) |
−7.0 (19.4) |
−17.9 (−0.2) |
3.2 (37.8) |
| Average low °C (°F) | −26.4 (−15.5) |
−21.9 (−7.4) |
−10.6 (12.9) |
0.4 (32.7) |
8.4 (47.1) |
15.2 (59.4) |
18.4 (65.1) |
16.2 (61.2) |
8.8 (47.8) |
0.3 (32.5) |
−11.5 (11.3) |
−22.8 (−9.0) |
−2.1 (28.2) |
| Record low °C (°F) | −41.2 (−42.2) |
−38.3 (−36.9) |
−33.9 (−29.0) |
−13.0 (8.6) |
−5.4 (22.3) |
3.6 (38.5) |
9.0 (48.2) |
6.0 (42.8) |
−5.4 (22.3) |
−16.3 (2.7) |
−31.1 (−24.0) |
−39.0 (−38.2) |
−41.2 (−42.2) |
| Average precipitation mm (inches) | 4.3 (0.17) |
4.1 (0.16) |
12.7 (0.50) |
22.7 (0.89) |
52.7 (2.07) |
100.7 (3.96) |
150.1 (5.91) |
124.0 (4.88) |
61.4 (2.42) |
28.6 (1.13) |
12.2 (0.48) |
8.0 (0.31) |
581.5 (22.88) |
| Average precipitation days (≥ 0.1 mm) | 5.7 | 4.0 | 5.5 | 7.5 | 11.7 | 14.1 | 14.6 | 14.2 | 9.6 | 7.5 | 6.2 | 7.2 | 107.8 |
| Average snowy days | 8.9 | 6.7 | 7.8 | 3.4 | 0.1 | 0 | 0 | 0 | 0 | 2.6 | 8.3 | 11.0 | 48.8 |
| Average relative humidity (%) | 75 | 71 | 63 | 56 | 58 | 69 | 79 | 81 | 73 | 66 | 70 | 76 | 70 |
| Mean monthly sunshine hours | 174.1 | 207.7 | 255.9 | 240.4 | 257.8 | 238.5 | 230.5 | 222.5 | 225.6 | 195.4 | 170.6 | 152.0 | 2,571 |
| Percent possible sunshine | 62 | 71 | 69 | 59 | 55 | 50 | 49 | 51 | 61 | 59 | 61 | 58 | 59 |
| Source: China Meteorological Administration[3][4] | |||||||||||||
Notes and references
- "国家统计局" (in Chinese). National Bureau of Statistics of the People's Republic of China. Retrieved 2021-12-07.
- (in English) National Population Statistics Materials by County and City - 1999 Period, in China County & City Population 1999, Harvard China Historical GIS
- 中国气象数据网 – WeatherBk Data (in Simplified Chinese). China Meteorological Administration. Retrieved 5 July 2023.
- 中国气象数据网 (in Simplified Chinese). China Meteorological Administration. Retrieved 5 July 2023.
This article is issued from Wikipedia. The text is licensed under Creative Commons - Attribution - Sharealike. Additional terms may apply for the media files.