Pottinger (District Electoral Area)
Pottinger was one of the nine district electoral areas (DEA) in Belfast, Northern Ireland from 1985 to 2014. Located in the east of the city, the district elected six members to Belfast City Council and contained the wards of Ballymacarrett, Bloomfield, Orangefield, Ravenhill, The Mount, and Woodstock.
| Pottinger District Electoral Area | |
|---|---|
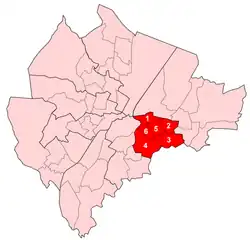 Map showing Pottinger wards within Belfast | |
| Area | 6.17 km2 (2.38 sq mi) |
| Population | 31,272 (2008 Estimate) |
| • Density | 5,068/km2 (13,130/sq mi) |
| District | |
| County | |
| Country | Northern Ireland |
| Sovereign state | United Kingdom |
| UK Parliament | |
| NI Assembly | |
The wards of Ravenhill and Woodstock were part of the Belfast South constituencies for the Northern Ireland Assembly and UK Parliament, while the other four were part of the Belfast East Assembly and Parliamentary constituencies.
The district was bounded to the west by the River Lagan and the Ormeau Road, to the north by the Newtownards Road, to the east by Greenville Park and North Road and the Borough of Castlereagh to the south.
At the 2001 census the district had a Protestant majority, however there was also a large Catholic minority, particularly in areas such as the Short Strand, which is separated from the mainly unionist Cluan Place by one of the many peace lines in the district.
History
The DEA was created for the 1985 local elections, when it largely replaced the former electoral Area A. Five of the six wards came from Area A with the Bloomfield ward added from Area B. It was abolished for the 2014 local elections, when all of its wards except Orangefield formed part of a new Titanic district electoral area. The Orangefield ward became part of a new Lisnasharragh district electoral area.
Amenities
Amenities in the Pottinger district electoral area include:
- Ormeau Golf Club
- Ormeau Park
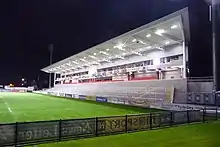
- Ravenhill Stadium, home of the Ulster Rugby team
Wards
| Map | Ward | Population (2011 Census) | Catholic | Protestant | Other | No Religion | Area | Density | NI Assembly | UK Parliament | Ref |
|---|---|---|---|---|---|---|---|---|---|---|---|
| 1 | Ballymacarrett | 4,908 | 51.4% | 41.2% | 1.4% | 6.2% | 0.78 km2 | 6,292 /km2 | Belfast East | Belfast East | [1] |
| 2 | Bloomfield | 5,453 | 16.1% | 69.7% | 1.7% | 12.5% | 0.74 km2 | 7,369 /km2 | Belfast East | Belfast East | [2] |
| 3 | Orangefield | 5,619 | 11% | 77% | 1.4% | 10.6% | 1.46 km2 | 3,849 /km2 | Belfast East | Belfast East | [3] |
| 4 | Ravenhill | 6,041 | 39.7% | 46.9% | 2% | 11.5% | 1.88 km2 | 3,213 /km2 | Belfast South | Belfast South | [4] |
| 5 | The Mount | 5,591 | 16.1% | 68.3% | 1.3% | 14.3% | 0.75 km2 | 7,455 /km2 | Belfast East | Belfast East | [5] |
| 6 | Woodstock | 5,445 | 19.4% | 63.3% | 2.8% | 14.5% | 0.56 km2 | 9,723 /km2 | Belfast South | Belfast South | [6] |
| Pottinger | 33,057 | 25.3% | 61.2% | 1.8% | 11.7% | 6.17 km2 | 5,358 /km2 | ||||
Councillors

| Election | Councillor (Party) |
Councillor (Party) |
Councillor (Party) |
Councillor (Party) |
Councillor (Party) |
Councillor (Party) | ||||||
|---|---|---|---|---|---|---|---|---|---|---|---|---|
| 2011 | Máire Hendron (Alliance) |
Niall Ó Donnghaile (Sinn Féin) |
Adam Newton (DUP) |
May Campbell (DUP) |
Gavin Robinson (DUP) |
John Kyle (PUP) | ||||||
| 2005 | Reg Empey (UUP) |
Margaret McKenzie (DUP) |
Sammy Wilson (DUP) |
David Ervine (PUP) | ||||||||
| 2001 | Joseph O'Donnell (Sinn Féin) |
Margaret Clarke (UUP) |
Harry Toan (DUP) | |||||||||
| 1997 | Mervyn Jones (Alliance) |
Robert Cleland (DUP) | ||||||||||
| 1993 | Sandy Blair (UUP) |
Jim Walker (DUP) | ||||||||||
| 1989 | Margaret Clarke (UUP) |
Dorothy Dunlop (Independent Unionist) | ||||||||||
| 1985 | Frank Leslie (DUP) | |||||||||||
2011 Election
2005: 3 x DUP, 1 x UUP, 1 x PUP, 1 x Alliance
2011: 3 x DUP, 1 x Alliance, 1 x Sinn Féin, 1 x PUP
2005-2011 Change: Sinn Féin gain from UUP
| Party | Candidate | FPv% | Count | |||||||||
|---|---|---|---|---|---|---|---|---|---|---|---|---|
| 1 | 2 | 3 | 4 | 5 | 6 | 7 | 8 | 9 | ||||
| Alliance | Máire Hendron* | 19.89% | 1,895 | |||||||||
| DUP | Gavin Robinson | 15.99% | 1,523 | |||||||||
| Sinn Féin | Niall Ó Donnghaile | 11.31% | 1,077 | 1,085.96 | 1,086.91 | 1,086.91 | 1,091.15 | 1,117.43 | 1,128.07 | 1,155.55 | 1,373.55 | |
| PUP | John Kyle | 10.73% | 1,022 | 1,084.72 | 1,091.76 | 1,101.04 | 1,109.04 | 1,112.36 | 1,176.89 | 1,210.81 | 1,257.85 | |
| DUP | May Campbell* | 11.03% | 1,051 | 1,085.24 | 1,110.76 | 1,117.19 | 1,120.05 | 1,121.05 | 1,167.41 | 1,196.81 | 1,206.01 | |
| DUP | Adam Newton | 9.83% | 936 | 971.84 | 1,082.61 | 1,083.72 | 1,086.79 | 1,086.79 | 1,109.97 | 1,129.71 | 1,138.63 | |
| Ulster Unionist | Philip Robinson | 8.25% | 786 | 871.76 | 884.74 | 890.13 | 894.09 | 896.41 | 964.04 | 1,007.9 | 1,048.01 | |
| SDLP | Séamas De Faoite | 4.79% | 456 | 553.92 | 554.03 | 555.35 | 561.59 | 588.19 | 615.15 | 705.91 | ||
| Green (NI) | David Newman | 2.34% | 223 | 353.88 | 355.31 | 360.23 | 394.11 | 413.99 | 480.99 | |||
| TUV | John Hiddleston | 2.01% | 191 | 199.64 | 200.52 | 206.84 | 209.16 | 210.48 | ||||
| Socialist Party | Tommy Black | 1.57% | 150 | 163.12 | 163.67 | 165.07 | 177.67 | 190.27 | ||||
| Workers' Party | Kevin McNally | 1.09% | 104 | 111.68 | 111.79 | 115.43 | 125.31 | |||||
| People Before Profit | Donna Marie McCusker | 0.73% | 70 | 92.4 | 92.73 | 95.01 | ||||||
| Independent | Karl Hedley | 0.35% | 33 | 42.28 | 42.83 | |||||||
| Independent | Samuel Smyth | 0.09% | 9 | 10.6 | 10.93 | |||||||
| Electorate: 19,929 Valid: 9,526 (47.80%) Spoilt: 190 Quota: 1,361 Turnout: 9,716 (48.75%) | ||||||||||||
2005 Election
2001: 3 x DUP, 1 x UUP, 1 x PUP, 1 x Alliance
2005: 2 x DUP, 2 x UUP, 1 x PUP, 1 x Sinn Féin
2001-2005 Change: DUP and Alliance gain from UUP and Sinn Féin
| Party | Candidate | FPv% | Count | ||||||
|---|---|---|---|---|---|---|---|---|---|
| 1 | 2 | 3 | 4 | 5 | 6 | ||||
| DUP | Sammy Wilson* | 22.60% | 2,385 | ||||||
| Ulster Unionist | Reg Empey* | 18.65% | 1,968 | ||||||
| DUP | May Campbell | 12.34% | 1,302 | 1,530.29 | |||||
| PUP | David Ervine* | 10.95% | 1,156 | 1,248.87 | 1,324.71 | 1,394.99 | 1,556.39 | ||
| DUP | Margaret McKenzie | 6.79% | 717 | 1,216.13 | 1,239.89 | 1,281.08 | 1,451.42 | 1,461.25 | |
| Alliance | Máire Hendron | 7.53% | 795 | 800.92 | 830.92 | 895.09 | 1,008.55 | 1,428.28 | |
| Sinn Féin | Deborah Devenny | 8.94% | 944 | 944 | 947.84 | 967.84 | 969.84 | 1,126.08 | |
| SDLP | Mary Muldoon | 6.35% | 670 | 672.22 | 677.26 | 743.18 | 766.22 | ||
| Ulster Unionist | Sonia Copeland | 2.62% | 277 | 303.64 | 524.92 | 644.92 | |||
| Socialist Party | Tommy Black | 1.57% | 163 | 165.96 | 168.36 | ||||
| Workers' Party | Joseph Bell | 0.99% | 105 | 105.74 | 106.74 | ||||
| Ulster Unionist | Henry Wallace | 0.68% | 72 | 85.69 | 180.25 | ||||
| Electorate: 19,621 Valid: 10,554 (53.79%) Spoilt: 381 Quota: 1,508 Turnout: 10,935 (55.73%) | |||||||||
2001 Election
1997: 2 x DUP, 2 x UUP, 1 x PUP, 1 x Sinn Féin
2001: 2 x DUP, 2 x UUP, 1 x PUP, 1 x Alliance
1997-2001 Change: Sinn Féin gain from Alliance
| Party | Candidate | FPv% | Count | ||||||||||
|---|---|---|---|---|---|---|---|---|---|---|---|---|---|
| 1 | 2 | 3 | 4 | 5 | 6 | 7 | 8 | 9 | 10 | ||||
| DUP | Sammy Wilson* | 30.21% | 3,918 | ||||||||||
| Ulster Unionist | Reg Empey* | 23.88% | 3,097 | ||||||||||
| PUP | David Ervine* | 12.20% | 1,582 | 1,748.42 | 2,005.46 | ||||||||
| Ulster Unionist | Margaret Clarke* | 4.31% | 559 | 621.01 | 1,279.99 | 1,338.86 | 1,366.14 | 1,398.3 | 1,406.09 | 1,508.73 | 1,524.67 | 1,892.91 | |
| Sinn Féin | Joseph O'Donnell | 9.75% | 1,264 | 1,264 | 1,265.68 | 1,266.26 | 1,267.26 | 1,268.26 | 1,285.26 | 1,287.26 | 1,451.29 | 1,567.85 | |
| DUP | Harry Toan | 1.58% | 205 | 1,377.89 | 1,430.39 | 1,440.54 | 1,445.54 | 1,475.47 | 1,477.47 | 1,529.03 | 1,532.03 | 1,552.64 | |
| DUP | Mary Campbell | 4.45% | 577 | 1,146.22 | 1,196.62 | 1,204.16 | 1,209.37 | 1,232.61 | 1,236.56 | 1,297.52 | 1,302.59 | 1,328.67 | |
| Alliance | Mervyn Jones* | 5.34% | 693 | 702.01 | 801.13 | 825.2 | 842.04 | 845.14 | 881.27 | 929.43 | 1,189.34 | ||
| SDLP | Leo Van Es | 3.54% | 459 | 463.24 | 514.06 | 518.41 | 518.41 | 518.41 | 554.41 | 561.83 | |||
| Independent | John Bushell | 1.68% | 218 | 236.55 | 254.19 | 259.7 | 262.12 | 268.5 | 283.98 | ||||
| PUP | Robin Stewart | 0.97% | 127 | 132.3 | 141.12 | 163.16 | 168.29 | 175.43 | 177.43 | ||||
| Workers' Party | Joseph Bell | 0.99% | 129 | 131.65 | 134.59 | 136.04 | 138.33 | 140.33 | |||||
| UK Unionist | David Fairfield | 0.57% | 74 | 94.14 | 118.5 | 127.49 | 135.57 | ||||||
| NI Conservatives | Jason Docherty | 0.51% | 66 | 70.24 | 89.56 | 93.91 | |||||||
| Electorate: 21,854 Valid: 12,968 (59.34%) Spoilt: 458 Quota: 1,853 Turnout: 13,426 (61.43%) | |||||||||||||
1997 Election
1993: 3 x DUP, 2 x UUP, 1 x Alliance
1997: 2 x DUP, 2 x UUP, 1 x PUP, 1 x Alliance
1993-1997 Change: PUP gain from DUP
| Party | Candidate | FPv% | Count | ||||||||||||
|---|---|---|---|---|---|---|---|---|---|---|---|---|---|---|---|
| 1 | 2 | 3 | 4 | 5 | 6 | 7 | 8 | 9 | 10 | 11 | 12 | ||||
| Ulster Unionist | Reg Empey* | 20.32% | 2,309 | ||||||||||||
| DUP | Sammy Wilson* | 19.94% | 2,265 | ||||||||||||
| PUP | David Ervine | 18.57% | 2,110 | ||||||||||||
| Ulster Unionist | Margaret Clarke | 6.76% | 768 | 1,265.55 | 1,309.63 | 1,340.83 | 1,345 | 1,347.62 | 1,358.2 | 1,385.31 | 1,387.1 | 1,625.38 | |||
| DUP | Robert Cleland* | 5.33% | 605 | 636.62 | 822.22 | 847.18 | 852.58 | 852.58 | 856.87 | 889.14 | 889.43 | 928.08 | 1,324.88 | 1,536.14 | |
| Alliance | Mervyn Jones* | 7.66% | 870 | 886.74 | 892.83 | 906.51 | 913.8 | 937.04 | 1,004.94 | 1,013.63 | 1,218.16 | 1,237.87 | 1,241.33 | 1,306.26 | |
| Sinn Féin | Dominic Corr | 8.61% | 978 | 978 | 978 | 978 | 978 | 992 | 996 | 996 | 1,100.29 | 1,100.29 | 1,100.29 | 1,102.25 | |
| PUP | Alexander Gordon | 2.31% | 262 | 281.84 | 298.37 | 615.65 | 622.49 | 625.97 | 641.61 | 692.25 | 699.49 | 723.33 | 763.61 | ||
| DUP | Frank Leslie | 1.25% | 142 | 160.91 | 487.45 | 504.49 | 506.78 | 506.78 | 510.91 | 545.02 | 546.02 | 567.76 | |||
| Ulster Unionist | Alexander Blair* | 2.21% | 251 | 320.75 | 338.73 | 356.49 | 360.07 | 372.31 | 377.1 | 395.04 | 398.35 | ||||
| SDLP | Marga Foley | 2.72% | 309 | 310.55 | 311.42 | 312.14 | 315.14 | 349.14 | 384.38 | 384.38 | |||||
| Ulster Democratic | Robert Girvan | 1.49% | 169 | 188.53 | 210.57 | 255.69 | 263.55 | 267.03 | 271.03 | ||||||
| NI Women's Coalition | Pearl Sagar | 1.31% | 149 | 151.48 | 153.22 | 160.66 | 173.95 | 182.43 | |||||||
| Workers' Party | Joseph Bell | 1.01% | 115 | 115.62 | 115.91 | 118.79 | 124.34 | ||||||||
| Ulster Independence | Josephine Challis | 0.18% | 21 | 23.48 | 24.93 | 26.13 | |||||||||
| Labour Coalition | Sean McGouran | 0.17% | 19 | 19 | 20.45 | 20.69 | |||||||||
| Natural Law | David Collins | 0.17% | 19 | 19.31 | 19.6 | 19.84 | |||||||||
| Electorate: 21,854 Valid: 12,968 (59.34%) Spoilt: 458 Quota: 1,853 Turnout: 13,426 (61.43%) | |||||||||||||||
1993 Election
1989: 2 x DUP, 2 x UUP, 1 x Alliance, 1 Independent Unionist
1993: 3 x DUP, 2 x UUP, 1 x Alliance
1989-1993 Change: DUP gain from Independent Unionist
| Party | Candidate | FPv% | Count | ||||||||
|---|---|---|---|---|---|---|---|---|---|---|---|
| 1 | 2 | 3 | 4 | 5 | 6 | 7 | 8 | ||||
| DUP | Sammy Wilson* | 25.52% | 2,784 | ||||||||
| Alliance | Mervyn Jones* | 12.99% | 1,417 | 1,427.35 | 1,461.35 | 1,476.15 | 1,700.15 | ||||
| DUP | Jim Walker* | 7.27% | 793 | 1,476.55 | 1,478.55 | 1,549.15 | 1,566.15 | ||||
| Ulster Unionist | Reg Empey* | 11.87% | 1,295 | 1,380.95 | 1,381.95 | 1,408.8 | 1,418.8 | 1,428.8 | 1,612.8 | ||
| DUP | Robert Cleland | 9.00% | 982 | 1,252.45 | 1,254.45 | 1,307.9 | 1,324.8 | 1,326.8 | 1,379.45 | 1,388.45 | |
| Ulster Unionist | Alexander Blair | 8.22% | 897 | 919.05 | 921.05 | 931.95 | 960.3 | 979.3 | 1,070.15 | 1,080.15 | |
| Ulster Unionist | Margaret Clarke* | 6.91% | 754 | 778.75 | 782.2 | 790.1 | 802.55 | 807.55 | 926.65 | 939.65 | |
| Sinn Féin | Joseph O'Donnell | 6.50% | 709 | 709 | 713 | 714 | 754 | 769 | 771 | ||
| NI Conservatives | Dorothy Dunlop* | 4.93% | 538 | 574 | 580 | 595.15 | 624.15 | 644.15 | |||
| Independent Labour | Colin Ballentine | 2.48% | 271 | 273.25 | 297.25 | 305.25 | |||||
| Workers' Party | Joseph Bell | 2.08% | 227 | 228.35 | 240.35 | 243.8 | |||||
| Ind. Unionist | Samuel Walker | 1.22% | 133 | 214.9 | 216.9 | ||||||
| Green (NI) | Thaddeus Bradley | 0.98% | 107 | 108.35 | |||||||
| Electorate: 24,293 Valid: 10,907 (44.90%) Spoilt: 482 Quota: 1,559 Turnout: 11,389 (46.89%) | |||||||||||
1989 Election
1985: 3 x DUP, 2 x UUP, 1 x Alliance
1989: 2 x DUP, 2 x UUP, 1 x Alliance, 1 Independent Unionist
1985-1989 Change: Independent Unionist gain from DUP
| Party | Candidate | FPv% | Count | ||||||
|---|---|---|---|---|---|---|---|---|---|
| 1 | 2 | 3 | 4 | 5 | 6 | ||||
| DUP | Sammy Wilson* | 25.88% | 2,780 | ||||||
| Ulster Unionist | Margaret Clarke* | 13.78% | 1,480 | 1,524.55 | 1,537.55 | ||||
| Alliance | Mervyn Jones* | 12.07% | 1,296 | 1,309.05 | 1,314.3 | 1,326.75 | 1,599.75 | ||
| DUP | Jim Walker* | 4.59% | 493 | 1,268.35 | 1,479.35 | 1,531.7 | 1,546.7 | ||
| Ind. Unionist | Dorothy Dunlop | 10.98% | 1,179 | 1,225.8 | 1,245.75 | 1,313.9 | 1,344.35 | 1,357.35 | |
| Ulster Unionist | Reg Empey* | 8.04% | 864 | 921.15 | 942.1 | 1,210.2 | 1,220.2 | 1,226.2 | |
| DUP | Frank Leslie* | 7.15% | 768 | 900.3 | 1,015 | 1,044.05 | 1,056.5 | 1,064.4 | |
| Sinn Féin | Joseph O'Donnell | 5.86% | 629 | 629.45 | 631.9 | 631.9 | 677.9 | ||
| Workers' Party | Sean Flanagan | 5.04% | 541 | 543.7 | 546.7 | 548.7 | |||
| Ulster Unionist | David McNutt | 3.91% | 420 | 447 | 457.15 | ||||
| DUP | John Norris | 2.45% | 263 | 381.8 | |||||
| National Front | Stuart McCullough | 0.25% | 27 | 29.7 | |||||
| Electorate: 24,265 Valid: 10,740 (44.26%) Spoilt: 508 Quota: 1,535 Turnout: 11,248 (46.35%) | |||||||||
1985 Election
1985: 3 x DUP, 2 x UUP, 1 x Alliance
| Party | Candidate | FPv% | Count | ||||||||
|---|---|---|---|---|---|---|---|---|---|---|---|
| 1 | 2 | 3 | 4 | 5 | 6 | 7 | 8 | ||||
| DUP | Sammy Wilson* | 19.99% | 2,454 | ||||||||
| DUP | Frank Leslie | 18.11% | 2,224 | ||||||||
| Ulster Unionist | Margaret Clarke | 16.28% | 1,999 | ||||||||
| DUP | Jim Walker | 9.39% | 1,153 | 1,763.12 | |||||||
| Ulster Unionist | Reg Empey | 9.10% | 1,117 | 1,143.6 | 1,442.8 | 1,630.12 | 1,659.16 | 1,660.5 | 1,756.5 | ||
| Alliance | Mervyn Jones | 8.30% | 1,019 | 1,026.56 | 1,039.48 | 1,044.64 | 1,127.4 | 1,272.74 | 1,309.88 | 1,547.28 | |
| Ulster Unionist | Harry Fletcher | 3.51% | 431 | 449.2 | 546.1 | 569.38 | 594.16 | 595.16 | 706.38 | 727.66 | |
| Sinn Féin | Joseph O'Donnell | 4.61% | 566 | 566 | 566 | 566 | 572.28 | 634.6 | 635.6 | 713.42 | |
| Workers' Party | Francis Cullen | 2.47% | 303 | 304.12 | 306.5 | 312.02 | 398.48 | 496.48 | 514.94 | ||
| PUP | David Ervine | 3.21% | 394 | 402.12 | 442.58 | 448.1 | 459.68 | 460.68 | |||
| SDLP | Carmel Maginness | 2.77% | 340 | 340.28 | 342.32 | 342.32 | 353.66 | ||||
| Labour and Trade Union | Stan Dempsey | 1.78% | 218 | 219.68 | 227.16 | 232.44 | |||||
| Communist | James Stewart | 0.25% | 61 | 64.08 | 66.8 | 67.16 | |||||
| Electorate: 24,757 Valid: 12,279 (49.60%) Spoilt: 506 Quota: 1,755 Turnout: 12,785 (51.64%) | |||||||||||
See also
- Belfast City Council
- Electoral wards of Belfast
- Local government in Northern Ireland
- Members of Belfast City Council
- Belfast Pottinger (UK Parliament constituency)
- Belfast Pottinger (Northern Ireland Parliament constituency)
- Belfast Willowfield (Northern Ireland Parliament constituency)
- 2011 Northern Ireland local elections#Belfast
- 2005 Northern Ireland local elections#Belfast
- 2001 Northern Ireland local elections#Belfast
- 1997 Northern Ireland local elections#Belfast
- 1993 Northern Ireland local elections#Belfast
- 1989 Northern Ireland local elections#Belfast
- 1985 Northern Ireland local elections#Belfast
References
- "Ward Information for Ballymacarrett ward 95GG04". NISRA. Retrieved 22 December 2013.
- "Ward Information for Bloomfield (Belfast) ward 95GG11". NISRA. Retrieved 22 December 2013.
- "Ward Information for Orangefield ward 95GG36". NISRA. Retrieved 22 December 2013.
- "Ward Information for Ravenhill ward 95GG37". NISRA. Retrieved 22 December 2013.
- "Ward Information for The Mount ward 95GG44". NISRA. Retrieved 22 December 2013.
- "Ward Information for Woodstock ward 95GG50". NISRA. Retrieved 22 December 2013.
- "Pottinger Result Sheet" (PDF). EONI. Retrieved 8 July 2021.
- "Local Government Results 2005". EONI. Retrieved 8 July 2021.
- "Local Government Results 2001". EONI. Retrieved 8 July 2021.
- "Local Government Results 1997". EONI. Retrieved 8 July 2021.
- "Local Government Results 1993". EONI. Retrieved 8 July 2021.
- "Local Government Results 1989". EONI. Retrieved 8 July 2021.
- "Local Government Results 1985". EONI. Retrieved 8 July 2021.
Places adjacent to Pottinger (District Electoral Area) | |
|---|---|