Red Lake Falls, Minnesota
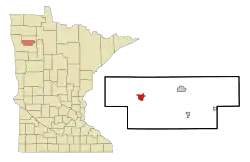
Red Lake Falls is a city and the county seat of Red Lake County, Minnesota, United States. The population was 1,339 at the 2020 census.[2] It is the county seat of Red Lake County.[6] The city lies in the middle of Red Lake Falls Township, from which it was separated when incorporated as a village in 1881. Its status was raised to that of a city in 1898.
Red Lake Falls | |
|---|---|
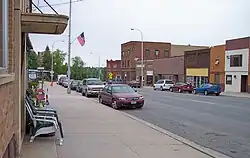
 Main Avenue in downtown Red Lake Falls in 2007 | |
| Nickname(s): Eagles and Rebels | |
 | |
| Coordinates: 47°52′58″N 96°16′23″W | |
| Country | United States |
| State | Minnesota |
| County | Red Lake |
| Government | |
| • Mayor | Kevin Harmoning |
| Area | |
| • Total | 2.10 sq mi (5.44 km2) |
| • Land | 2.10 sq mi (5.44 km2) |
| • Water | 0.00 sq mi (0.00 km2) |
| Elevation | 1,037 ft (316 m) |
| Population | |
| • Total | 1,339 |
| • Estimate (2022)[3] | 1,327 |
| • Density | 637.62/sq mi (246.19/km2) |
| Time zone | UTC-6 (Central) |
| • Summer (DST) | UTC-5 (CDT) |
| ZIP code | 56750 |
| Area code | 218 |
| FIPS code | 27-53476[4] |
| GNIS feature ID | 0649866[5] |
| Website | redlakefalls.com |
History

Red Lake Falls was the site of a North West Company fur post as early as 1796 or 1797, making it one of the oldest sites of European occupation in the State of Minnesota. A French Canadian fur trader, Jean Baptiste Cadotte, partner of the noted British-Canadian fur trader, Alexander Henry the elder, established the post as part of a strategy to ward off Hudson's Bay Company intrusion into the Red River Valley. The famous Canadian explorer David Thompson took shelter from a storm in Cadotte's cabin here in March 1798.[7] The post was abandoned early in the 1800s, as British fur traders withdrew from United States territory.
The surrounding territory was homesteaded by French-American settlers led by Pierre Bottineau, who were relocating via ox cart from their temporary stopping points in Ramsey and Hennepin Counties, Minnesota, in 1876. These pioneers were augmented in 1878 by a number of French Canadian settlers from Upper Canada. The area developed as a grain farming region. In 1878, Earnest Buse and his partner, Otto Kankel, established a flour mill at the confluence of the two rivers.
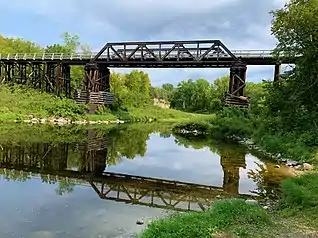
The town of Red Lake Falls soon after was platted by Mr. Buse, who then moved on to other environs. The Kankel family continued as a prominent presence in the town through the 1950s. The town prospered for a time, as both the Northern Pacific Railway and the Great Northern Railway ran their lines through the town in the 1880s and early 1890s (both lines are now abandoned), and when Red Lake County split off from Polk County, in 1896, Red Lake Falls became the county seat of the newly formed county, a reason for existence that persists to the present day. The population peaked shortly afterward, in 1900, and has been in decline ever since.
The last significant historic event in Red Lake Falls occurred on August 27, 1927, when the famous aviator Charles Lindbergh and his wife landed at the nearby airport during a barnstorming trip through the Upper Midwest and were taken on automobile rides to Huot and Crookston.
Geography
Red Lake Falls is located on a tributary of the Red River of the North, the Red Lake River, at its confluence with the Clearwater River. According to the United States Census Bureau, the city has a total area of 2.03 square miles (5.26 km2), all land.[8]
Minnesota Highway 32 serves as a main route in the city. Minnesota Highway 92 is nearby.
Climate
| Climate data for Red Lake Falls, Minnesota (1991–2020 normals, extremes 1913–present) | |||||||||||||
|---|---|---|---|---|---|---|---|---|---|---|---|---|---|
| Month | Jan | Feb | Mar | Apr | May | Jun | Jul | Aug | Sep | Oct | Nov | Dec | Year |
| Record high °F (°C) | 53 (12) |
62 (17) |
77 (25) |
97 (36) |
102 (39) |
103 (39) |
110 (43) |
102 (39) |
96 (36) |
91 (33) |
73 (23) |
57 (14) |
110 (43) |
| Average high °F (°C) | 15.0 (−9.4) |
19.8 (−6.8) |
33.7 (0.9) |
51.2 (10.7) |
65.6 (18.7) |
74.6 (23.7) |
78.9 (26.1) |
78.2 (25.7) |
68.9 (20.5) |
53.2 (11.8) |
35.0 (1.7) |
21.3 (−5.9) |
49.6 (9.8) |
| Daily mean °F (°C) | 6.0 (−14.4) |
10.0 (−12.2) |
24.4 (−4.2) |
40.6 (4.8) |
54.3 (12.4) |
64.6 (18.1) |
68.7 (20.4) |
67.0 (19.4) |
57.9 (14.4) |
43.5 (6.4) |
27.2 (−2.7) |
13.5 (−10.3) |
39.8 (4.3) |
| Average low °F (°C) | −2.9 (−19.4) |
0.2 (−17.7) |
15.0 (−9.4) |
30.1 (−1.1) |
43.1 (6.2) |
54.6 (12.6) |
58.4 (14.7) |
55.8 (13.2) |
46.9 (8.3) |
33.8 (1.0) |
19.3 (−7.1) |
5.6 (−14.7) |
30.0 (−1.1) |
| Record low °F (°C) | −50 (−46) |
−47 (−44) |
−39 (−39) |
−11 (−24) |
15 (−9) |
25 (−4) |
35 (2) |
28 (−2) |
15 (−9) |
−4 (−20) |
−29 (−34) |
−43 (−42) |
−50 (−46) |
| Average precipitation inches (mm) | 0.60 (15) |
0.57 (14) |
0.89 (23) |
1.32 (34) |
2.85 (72) |
4.49 (114) |
3.58 (91) |
3.50 (89) |
2.81 (71) |
2.09 (53) |
0.85 (22) |
0.78 (20) |
24.33 (618) |
| Average snowfall inches (cm) | 10.1 (26) |
8.6 (22) |
7.8 (20) |
3.8 (9.7) |
0.1 (0.25) |
0.0 (0.0) |
0.0 (0.0) |
0.0 (0.0) |
0.0 (0.0) |
1.5 (3.8) |
5.6 (14) |
12.4 (31) |
49.9 (127) |
| Average precipitation days (≥ 0.01 in) | 7.6 | 6.2 | 6.7 | 7.5 | 10.7 | 12.5 | 11.2 | 9.2 | 9.7 | 8.7 | 6.6 | 8.4 | 105.0 |
| Average snowy days (≥ 0.1 in) | 7.8 | 6.3 | 4.8 | 2.2 | 0.2 | 0.0 | 0.0 | 0.0 | 0.0 | 1.1 | 4.5 | 9.1 | 36.0 |
| Source: NOAA[9][10] | |||||||||||||
Demographics
| Census | Pop. | Note | %± |
|---|---|---|---|
| 1880 | 32 | — | |
| 1890 | 774 | 2,318.8% | |
| 1900 | 1,885 | 143.5% | |
| 1910 | 1,757 | −6.8% | |
| 1920 | 1,549 | −11.8% | |
| 1930 | 1,386 | −10.5% | |
| 1940 | 1,530 | 10.4% | |
| 1950 | 1,733 | 13.3% | |
| 1960 | 1,520 | −12.3% | |
| 1970 | 1,740 | 14.5% | |
| 1980 | 1,732 | −0.5% | |
| 1990 | 1,481 | −14.5% | |
| 2000 | 1,590 | 7.4% | |
| 2010 | 1,427 | −10.3% | |
| 2020 | 1,339 | −6.2% | |
| 2022 (est.) | 1,327 | [3] | −0.9% |
| U.S. Decennial Census[11] 2020 Census[2] | |||
2010 census
As of the census of 2010, there were 1,427 people, 615 households, and 366 families residing in the city. The population density was 703.0 inhabitants per square mile (271.4/km2). There were 670 housing units at an average density of 330.0 per square mile (127.4/km2). The racial makeup of the city was 96.1% White, 0.4% African American, 0.5% Native American, 0.3% Pacific Islander, 0.8% from other races, and 2.0% from two or more races. Hispanic or Latino of any race were 4.1% of the population.
There were 615 households, of which 29.6% had children under the age of 18 living with them, 47.0% were married couples living together, 9.3% had a female householder with no husband present, 3.3% had a male householder with no wife present, and 40.5% were non-families. 33.7% of all households were made up of individuals, and 14.4% had someone living alone who was 65 years of age or older. The average household size was 2.27 and the average family size was 2.90.
The median age in the city was 41.2 years. 24.7% of residents were under the age of 18; 7.2% were between the ages of 18 and 24; 22.6% were from 25 to 44; 27.8% were from 45 to 64; and 17.7% were 65 years of age or older. The gender makeup of the city was 49.5% male and 50.5% female.
2000 census
As of the census of 2000, there were 1,590 people, 608 households, and 380 families residing in the city. The population density was 749.7 inhabitants per square mile (289.5/km2). There were 652 housing units at an average density of 307.4 per square mile (118.7/km2). The racial makeup of the city was 94.53% White, 4.53% Native American, 0.13% Asian, 0.31% from other races, and 0.50% from two or more races. Hispanic or Latino of any race were 0.44% of the population.
There were 608 households, out of which 33.1% had children under the age of 18 living with them, 49.2% were married couples living together, 9.5% had a female householder with no husband present, and 37.5% were non-families. 32.7% of all households were made up of individuals, and 16.6% had someone living alone who was 65 years of age or older. The average household size was 2.35 and the average family size was 3.00.
In the city, the population was spread out, with 25.4% under the age of 18, 8.2% from 18 to 24, 24.5% from 25 to 44, 20.4% from 45 to 64, and 21.5% who were 65 years of age or older. The median age was 39 years. For every 100 females, there were 92.0 males. For every 100 females age 18 and over, there were 87.7 males.
The median income for a household in the city was $30,536, and the median income for a family was $41,413. Males had a median income of $29,792 versus $20,185 for females. The per capita income for the city was $15,177. About 8.3% of families and 11.4% of the population were below the poverty line, including 11.3% of those under age 18 and 16.9% of those age 65 or over.
Politics
| Year | Republican | Democratic | Third parties |
|---|---|---|---|
| 2020 | 63.6% 437 | 34.6% 238 | 1.8% 12 |
| 2016 | 58.6% 371 | 30.2% 191 | 11.2% 71 |
| 2012 | 46.2% 308 | 50.8% 339 | 3.0% 20 |
| 2008 | 43.2% 315 | 53.5% 390 | 3.3% 24 |
| 2004 | 50.1% 354 | 48.1% 340 | 1.8% 13 |
| 2000 | 46.0% 329 | 43.8% 313 | 10.2% 73 |
| 1996 | 26.4% 183 | 57.1% 396 | 16.5% 115 |
| 1992 | 31.2% 215 | 49.2% 339 | 19.6% 135 |
| 1988 | 40.3% 261 | 59.7% 387 | 0.0% 0 |
| 1984 | 46.7% 347 | 53.3% 396 | 0.0% 0 |
| 1980 | 44.8% 375 | 49.2% 412 | 6.0% 50 |
| 1976 | 33.1% 284 | 63.5% 545 | 3.4% 29 |
| 1968 | 32.4% 229 | 63.4% 448 | 4.2% 30 |
| 1964 | 26.6% 191 | 72.1% 517 | 1.3% 9 |
| 1960 | 31.1% 210 | 68.9% 446 | 0.0% 0 |
Notable people
- Adrian Baril, NFL player
- Roxy Beaudro, ice hockey player
References
- "2020 U.S. Gazetteer Files". United States Census Bureau. Retrieved July 24, 2022.
- "Explore Census Data". United States Census Bureau. Retrieved May 19, 2022.
- "City and Town Population Totals: 2020-2022". United States Census Bureau. June 25, 2023. Retrieved June 25, 2023.
- "U.S. Census website". United States Census Bureau. Retrieved January 31, 2008.
- "US Board on Geographic Names". United States Geological Survey. October 25, 2007. Retrieved January 31, 2008.
- "Find a County". National Association of Counties. Retrieved June 7, 2011.
- See D'Arcy Jenish, Epic Wanderer: David Thompson & The Mapping of the Canadian West (2003), at pages 103-04
- "US Gazetteer files 2010". United States Census Bureau. Archived from the original on January 25, 2012. Retrieved November 13, 2012.
- "NowData - NOAA Online Weather Data". National Oceanic and Atmospheric Administration. Retrieved September 24, 2021.
- "Station: Red Lake Falls, MN". U.S. Climate Normals 2020: U.S. Monthly Climate Normals (1991-2020). National Oceanic and Atmospheric Administration. Retrieved September 24, 2021.
- "Census of Population and Housing". Census.gov. Retrieved June 4, 2015.
- "Minnesota Secretary of State - 2020 Precinct Results Spreadsheet".
- "Minnesota Secretary of State - 2016 Precinct Results Spreadsheet".
- "Minnesota Secretary of State - 2012 Precinct Results Spreadsheet".
- "Minnesota Secretary of State - 2008 Precinct Results Spreadsheet".
- "Minnesota Secretary of State - 2004 Precinct Results Spreadsheet".
- "Minnesota Secretary of State - 2000 Precinct Results Spreadsheet".
- "Precinct Results" (PDF). 1996. Archived (PDF) from the original on April 10, 2021. Retrieved August 20, 2023.
- "Precinct Results" (PDF). 1992. Archived (PDF) from the original on April 10, 2021. Retrieved August 20, 2023.
- "Precinct Results" (PDF). 1988. Archived (PDF) from the original on April 10, 2021. Retrieved August 20, 2023.
- "Precinct Results" (PDF). 1984. Archived (PDF) from the original on April 10, 2021. Retrieved August 20, 2023.
- "Precinct Results" (PDF). 1980. Archived (PDF) from the original on April 10, 2021. Retrieved August 20, 2023.
- "Precinct Results" (PDF). 1976. Archived (PDF) from the original on April 10, 2021. Retrieved August 20, 2023.
- "Precinct Results" (PDF). 1968. Archived (PDF) from the original on April 10, 2021. Retrieved August 20, 2023.
- "Precinct Results" (PDF). 1964. Archived (PDF) from the original on April 10, 2021. Retrieved August 20, 2023.
- "Precinct Results" (PDF). 1960. Archived (PDF) from the original on April 10, 2021. Retrieved August 20, 2023.
Further reading
- Red Lake County Historical Society, Inc., A History of Red Lake County (1976), pp. 108–138.
