Demographics of Alberta
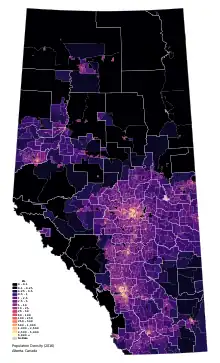
Alberta has experienced a relatively high rate of growth in recent years, due in large part to its economy. Between 2003 and 2004, the province saw high birthrates (on par with some larger provinces such as British Columbia), relatively high immigration, and a high rate of interprovincial migration when compared to other provinces.[1] Approximately 81% of the population live in urban areas and only about 19% live in rural areas. The Calgary–Edmonton Corridor is the most urbanized area in Alberta and is one of Canada's four most urban regions.[2] Many of Alberta's cities and towns have also experienced high rates of growth in recent history. From a population of 73,022 in 1901, Alberta has grown to 3,645,257 in 2011 and in the process has gone from less than 1.5% of Canada's population to 10.9%.[3] As of July 1, 2018, Alberta's population represented 11.6% of Canada's total population of 37,058,856 making it the fourth most populated province in Canada.[4][lower-alpha 1] According to the 2018 third quarter report, Alberta's population increased by 23,096 to 4,330,206, the largest increase since the 2014 economic downturn.[5][6]
Population history
| Year | Population [7] | Five Year % change |
Ten Year % change |
Percentage of Canadian Pop. |
Rank Among Provinces |
|---|---|---|---|---|---|
| 1901 | 73,022† | n/a | n/a | 1.4 | 9 |
| 1911 | 374,295 | n/a | 412.6 | 5.2 | 7 |
| 1921 | 588,454 | n/a | 57.2 | 6.7 | 5 |
| 1931 | 731,605 | n/a | 24.3 | 7.0 | 4 |
| 1941 | 796,169 | n/a | 8.8 | 6.9 | 5 |
| 1951 | 939,501 | n/a | 18.0 | 6.7 | 4 |
| 1956 | 1,123,116 | 19.5 | n/a | n/a | 4 |
| 1961 | 1,331,944 | 18.6 | 41.8 | 7.3 | 4 |
| 1969 | 1,463,203 | 9.9 | 30.3 | n/a | 4 |
| 1971 | 1,627,875 | 11.3 | 22.2 | 7.5 | 4 |
| 1976 | 1,838,035 | 12.9 | 25.6 | n/a | 4 |
| 1981 | 2,237,724 | 21.7 | 37.5 | 9.2 | 4 |
| 1986 | 2,365,830 | 5.7 | 28.7 | 9.3 | 4 |
| 1991 | 2,545,553 | 7.6 | 13.8 | 9.3 | 4 |
| 1996 | 2,696,826 | 5.9 | 14.0 | 9.3 | 4 |
| 2001 | 2,974,807 | 10.3 | 16.9 | 9.9 | 4 |
| 2006 | 3,290,350 | 10.6 | 22.0 | 10.4 | 4 |
| 2011 | 3,645,257 | 10.8 | 22.5 | 10.9 | 4 |
| 2016 | 4,067,175 | 11.6 | 23.6 | 11.6 | 4 |
| 2021 | 4,262,635 | 4.8 | 16.9 | 11.5 | 4 |
† 1901 population for District of Alberta, part of the then-named North-West Territories.
Population geography
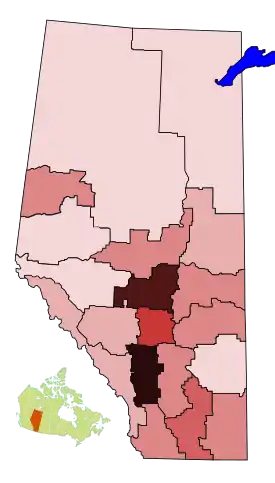
Census divisions
Census metropolitan areas
As of the 2011 census, Alberta had two census metropolitan areas (CMAs) recognized by Statistics Canada. A third one was added in the 2016 census.
The following is a list of the recent population history of the Calgary and Edmonton CMAs.
| CMA name [8] | 2021 [9] | 2016 [10] | 2011 [8] | 2006 [11] | 2001 [12] | 1996 [13] | Census division |
|---|---|---|---|---|---|---|---|
| Calgary | 1,481,806 | 1,374,655 | 1,214,839 | 1,079,310 | 951,395 [CMA 1] | 821,628 | Division No. 6 |
| Edmonton | 1,418,118 | 1,297,280 | 1,159,869 | 1,034,945 | 937,845 | 862,597 | Division No. 11 |
The third CMA added in 2016 is Lethbridge, and its population history is as follows:
| CMA name [8] | 2021 [9] | 2016 [10] | Census division |
|---|---|---|---|
| Lethbridge | 123,847 | 113,920 | Division No. 2 |
The fourth CMA added in 2021 is Red Deer, and its population history is as follows:
| CMA name | 2021 [9] | Census division |
|---|---|---|
| Red Deer | 100,844 | Division No. 8 |
CMA notes:
- In the 2006 census, the 2001 population of the Calgary was adjusted to 951,494 due to a boundary expansion.
Census agglomerations
Census subdivisions

As of the 2006 census, Alberta had 453 census subdivisions (municipalities and municipal equivalents) recognized by Statistics Canada. The following is a list of those census subdivisions with a population of 10,000 or greater.
| Name [14] | Municipal status [15] |
2011 [16] | 2006 [14] | 2001 [17] | 1996 [18] | Notes |
|---|---|---|---|---|---|---|
| Calgary | City | 1,096,833 | 988,193 | 878,866 | 768,082 | |
| Edmonton | City | 812,201 | 730,372 | 666,104 | 616,306 | |
| Strathcona County | Specialized municipality | 92,490 | 82,511 | 71,986 | 64,176 | Located within the Edmonton CMA |
| Red Deer | City | 90,564 | 82,772 | 67,707 | 60,075 | |
| Lethbridge | City | 83,517 | 74,637 | 67,374 | 63,053 | |
| Wood Buffalo | Specialized municipality | 65,565 | 51,496 | 41,466 | 35,213 | |
| St. Albert | City | 61,466 | 57,719 | 53,081 | 46,888 | Located within the Edmonton CMA |
| Medicine Hat | City | 60,005 | 56,997 | 51,249 | 46,783 | |
| Grande Prairie | City | 55,032 | 47,076 | 36,983 | 31,140 | |
| Airdrie | City | 42,564 | 28,927 | 20,382 | 15,946 | Located within the Calgary CMA |
| Rocky View County | Municipal district | 36,461 | 34,171 | 30,688 | 23,326 | Located within the Calgary CMA |
| Parkland County | Municipal district | 30,568 | 29,265 | 27,252 | 24,769 | Located within the Edmonton CMA |
| Spruce Grove | City | 26,171 | 19,496 | 15,983 | 14,271 | Located within the Edmonton CMA |
| Okotoks | Town | 24,511 | 17,145 | 11,664 | 8,510 | |
| Leduc | City | 24,279 | 16,967 | 15,032 | 14,305 | Located within the Edmonton CMA |
| Foothills No. 31 | Municipal district | 21,258 | 19,736 | 16,764 | 13,714 | |
| County of Grande Prairie No. 1 | Municipal district | 20,347 | 17,970 | 15,638 | 13,750 | |
| Sturgeon County | Municipal district | 19,578 | 18,621 | 18,067 | 15,945 | Located within the Edmonton CMA |
| Fort Saskatchewan | City | 19,051 | 14,957 | 13,121 | 12,408 | Located within the Edmonton CMA |
| Red Deer County | Municipal district | 18,351 | 19,108 | 18,639 | 17,126 | |
| Lloydminster | City | 18,032 | 15,910 | 13,148 | 11,317 | Population totals do not include the part of the city located within Saskatchewan |
| Cochrane | Town | 17,580 | 13,780 | 11,798 | 7,424 | Located within Calgary CMA |
| Camrose | City | 17,286 | 15,620 | 14,854 | 13,728 | |
| Stony Plain | Town | 15,051 | 12,363 | 9,589 | 8,274 | Located within the Edmonton CMA |
| Chestermere | Town | 14,824 | 9,564 | 3,414 | 1,911 | |
| Beaumont | Town | 13,284 | 8,961 | 7,006 | 5,810 | Located within the Edmonton CMA |
| Cold Lake | City | 13,839 | 11,991 | 11,520 | 4,089 | |
| Brooks | City | 13,676 | 12,498 | 11,604 | 10,093 | |
| Leduc County | Municipal district | 13,541 | 12,730 | 12,528 | 12,361 | Located within the Edmonton CMA |
| High River | Town | 12,920 | 10,716 | 9,345 | 7,359 | |
| Wetaskiwin | City | 12,525 | 11,673 | 11,154 | 10,959 | |
| Mountain View County | Municipal district | 12,359 | 12,391 | 12,134 | 11,277 | |
| Sylvan Lake | Town | 12,327 | 10,208 | 7,493 | 5,178 | |
| Strathmore | Town | 12,305 | 10,225 | 7,621 | 5,282 | |
| Canmore | Town | 12,288 | 12,039 | 10,792 | 8,354 | |
| Clearwater County | Municipal district | 12,278 | 11,826 | 11,505 | 10,915 | |
| Lacombe | City | 11,707 | 10,742 | 9,384 | 8,018 | |
| Yellowhead County | Municipal district | 11,469 | 10,045 | 9,881 | 9,352 | |
| Bonnyville No. 87 | Municipal district | 11,191 | 10,194 | 9,473 | 17,352 | |
| Mackenzie County | Specialized municipality | 10,927 | 10,002 | 8,829 | 7,980 | |
| County of Wetaskiwin No. 10 | Municipal district | 10,866 | 10,535 | 10,695 | 10,467 | |
| Lacombe County | Municipal district | 10,312 | 10,451 | 10,159 | 10,081 | |
| Lethbridge County | Municipal district | 10,061 | 10,302 | 9,930 | 9,290 |
Population centres
Designated places
Ethnic origins
The ethnicities most commonly reported in the 2021 Census are shown in the table below. The percentages add up to more than 100% because of dual responses (e.g. "Irish-Canadian" generates an entry in both the category "Irish" and the category "Canadian").[19]
| Ethnic Group | Total | Percentage |
|---|---|---|
| English | 766,070 | 18.3% |
| German | 641,025 | 15.3% |
| Scottish | 631,015 | 15.1% |
| Irish | 561,915 | 13.5% |
| Canadian | 484,655 | 11.6% |
| Ukrainian | 343,640 | 8.2% |
| French | 340,900 | 8.2% |
| Filipino | 203,955 | 4.9% |
| Chinese | 177,990 | 4.3% |
| Dutch (Netherlands) | 174,625 | 4.2% |
| Polish | 169,925 | 4.1% |
| Indian (South Asian) | 155,700 | 3.7% |
| Norwegian | 154,535 | 3.7% |
| British n.i.e. | 124,835 | 3.0% |
| Métis | 115,455 | 2.8% |
| Italian | 98,730 | 2.4% |
| Russian | 97,890 | 2.3% |
| Swedish | 92,975 | 2.2% |
| Welsh | 76,810 | 1.8% |
| Caucasian n.o.s. | 73,475 | 1.8% |
Other ethnic groups
In addition to the groups listed above, the next most commonly reported (counting both single and multiple responses) were:
- 73,355 First Nations n.o.s. (1.8%);
- 70,790 European n.o.s. (1.7%);
- 66,100 American (1.6%);
- 62,465 Cree (1.5%);
- 56,190 Danish (1.3%);
- 51,360 Hungarian (1.2%);
- 40,165 Spanish (1.0%);
- 39,535 Pakistani (0.9%);
- 39,395 Vietnamese (0.9%);
- 37,585 Punjabi (0.9%);
- 36,220 Austrian (0.9%);
- 34,225 African n.o.s. (0.8%)
- 32,365 French (0.8%);
- 31,565 Mennonite (0.8%);
- 31,530 Korean (0.8%);
- 31,255 Asian n.o.s. (0.7%);
- 28,860 Sikhs (0.7%);
- 28,480 Lebanese (0.7%);
- 26,600 Albertan (0.6%);
- 26,435 North American Indigenous n.o.s. (0.6%);
- 25,800 Northern Europe n.o.s. (0.6%);
- 25,450 Mexican (0.6%);
- 24,170 Korean (0.6%);
- 23,860 Arab n.o.s. (0.6%);
- 22,450 Swiss (0.5%);
- 21,985 Belgian (0.5%);
- 21,415 Portuguese (0.5%)
Future projections
| Group | 2016[20] | 2036[21][22] | ||
|---|---|---|---|---|
| Number | % of 2016 population (4,067,175) | Number | % of 2036 estimated population (6,201,000) | |
| European origins | 2,786,340 | 70.0% | 3,505,000 | 56.5% |
| East and Southeast Asian origins | 401,820 | 10.1% | 953,000 | 15.4% |
| South Asian and Middle Eastern origins | 308,610 | 7.8% | 784,000 | 12.6% |
| Aboriginal origins | 258,640 | 6.5% | 447,000 | 7.2% |
| African origins | 129,390 | 3.3% | 320,000 | 5.2% |
| Latin, Central and South American origins | 55,090 | 1.4% | 118,000 | 1.9% |
| Other | 38,260 | 0.9% | 92,000 | 1.5% |
| *Percentages total over 100% due to multiple responses, e.g. German-Indian, Norwegian-Irish. | ||||
Visible minorities and Indigenous peoples
| Visible minority and Indigenous population (Canada 2021 Census)[25] | |||
|---|---|---|---|
| Population group | Population | % | |
| European[lower-alpha 2] | 2,731,825 | 65.4% | |
| Visible minority group | South Asian | 297,650 | 7.1% |
| Chinese | 164,235 | 3.9% | |
| Black | 177,940 | 4.3% | |
| Filipino | 216,710 | 5.2% | |
| Arab | 69,505 | 1.7% | |
| Latin American | 66,520 | 1.6% | |
| Southeast Asian | 54,005 | 1.3% | |
| West Asian | 25,075 | 0.6% | |
| Korean | 24,365 | 0.6% | |
| Japanese | 13,560 | 0.3% | |
| Visible minority, n.i.e. | 12,100 | 0.3% | |
| Multiple visible minorities | 39,745 | 1.0% | |
| Total visible minority population | 1,161,420 | 27.8% | |
| Indigenous group | First Nations (North American Indian) | 145,640 | 3.5% |
| Métis | 127,470 | 3.1% | |
| Inuk (Inuit) | 2,945 | 0.1% | |
| Multiple Indigenous responses | 4,785 | 0.1% | |
| Indigenous responses n.i.e. | 3,620 | 0.1% | |
| Total Indigenous population | 284,470 | 6.8% | |
| Total population | 4,177,715 | 100.0% | |
Languages
Knowledge of languages
The question on knowledge of languages allows for multiple responses. The following figures are from the 2021 Canadian Census and the 2016 Canadian Census, and lists languages that were selected by at least one per cent of respondents.
| Language | 2021[26] | 2016 | ||
|---|---|---|---|---|
| Pop. | % | Pop. | % | |
| English | 4,109,720 | 98.37% | 3,916,805 | 98.46% |
| French | 260,415 | 6.23% | 264,720 | 6.65% |
| Tagalog | 172,625 | 4.13% | 138,440 | 3.48% |
| Punjabi | 126,385 | 3.03% | 90,485 | 2.27% |
| Spanish | 116,070 | 2.78% | 104,445 | 2.63% |
| Hindi | 94,015 | 2.25% | 61,290 | 1.54% |
| Mandarin | 82,095 | 1.97% | 70,510 | 1.77% |
| Arabic | 76,760 | 1.84% | 62,730 | 1.58% |
| Cantonese | 74,960 | 1.79% | 74,770 | 1.88% |
| German | 65,370[lower-alpha 3] | 1.56%[lower-alpha 3] | 83,010 | 2.09% |
| Urdu | 51,545 | 1.23% | 41,235 | 1.04% |
Mother tongue
Languages of Alberta (2016):[27]
Of the 3,978,145 singular responses to the 2016 census question concerning mother tongue, the languages most commonly reported were:[28]
| 2016 | % | 2011 | % | 2006 | % | 2001 | % | ||
|---|---|---|---|---|---|---|---|---|---|
| 1. | English | 2,972,670 | 74.71% | 2,780,200 | 78.37% | 2,576,670 | 79.99% | 2,379,515 | 81.84% |
| 2. | Chinese | 119,710 | 3.01% | 105,470 | 2.97% | 97,275 | 3.02% | 78,205 | 2.69% |
| Cantonese | 59,580 | 1.50% | 34,985 | 0.99% | 32,485 | 1.01% | 26,255 | 0.90% | |
| Mandarin | 49,990 | 1.26% | 19,325 | 0.54% | 12,135 | 0.38% | 5,580 | 0.19% | |
| Min Nan languages (Teochow, Fukien, Taiwanese) | 3,075 | 0.08% | 785 | 0.02% | 400 | 0.01% | N | N | |
| Hakka | 940 | 0.02% | 325 | 0.01% | 425 | 0.01% | 570 | 0.02% | |
| 3. | Tagalog (Filipino/Pilipino) | 98,360 | 2.47% | 60,085 | 1.69% | 29,740 | 0.92% | 11,705 | 0.40% |
| 4. | French | 70,440 | 1.77% | 68,545 | 1.93% | 61,225 | 1.90% | 58,645 | 2.02% |
| 5. | Panjabi (Punjabi) | 68,315 | 1.72% | 49,940 | 1.41% | 36,320 | 1.13% | 22,535 | 0.78% |
| 6. | German | 63,570 | 1.60% | 80,905 | 2.28% | 84,505 | 2.62% | 78,040 | 2.68% |
| 7. | Spanish | 54,685 | 1.37% | 44,020 | 1.24% | 29,125 | 0.90% | 19,820 | 0.68% |
| 8. | Arabic | 40,695 | 1.02% | 28,000 | 0.79% | 20,495 | 0.64% | 15,390 | 0.53% |
| 9. | Urdu | 26,860 | 0.68% | 19,900 | 0.56% | 11,275 | 0.35% | 4,910 | 0.17% |
| 10. | Vietnamese | 23,015 | 0.58% | 21,195 | 0.60% | 19,350 | 0.60% | 16,680 | 0.57% |
| 11. | Selected Aboriginal languages | 22,970 | 0.58% | 22,005 | 0.62% | 20,890 | 0.65% | 18,470 | 0.64% |
| Cree | 17,125 | 0.43% | 16,745 | 0.47% | 17,215 | 0.53% | 15,105 | 0.52% | |
| Blackfoot | 3,385 | 0.09% | 3,035 | 0.09% | 3,015 | 0.09% | 2,630 | 0.09% | |
| Dene | 1,570 | 0.04% | 1,680 | 0.05% | 1,585 | 0.05% | 1,495 | 0.05% | |
| Ojibway | 630 | 0.02% | 455 | 0.01% | 615 | 0.02% | 645 | 0.02% | |
| 12. | Ukrainian | 21,215 | 0.53% | 24,575 | 0.69% | 29,455 | 0.91% | 33,970 | 1.17% |
| 13. | Polish | 19,780 | 0.50% | 19,890 | 0.56% | 21,990 | 0.68% | 20,635 | 0.71% |
| 14. | Russian | 17,465 | 0.44% | 13,840 | 0.38% | 10,145 | 0.31% | 6,980 | 0.29% |
| 15. | Korean | 17,400 | 0.44% | 13,885 | 0.39% | 10,845 | 0.33% | 6,330 | 0.22% |
| 16. | Hindi | 16,495 | 0.41% | 12,290 | 0.35% | 8,985 | 0.28% | 6,315 | 0.22% |
| 17. | Dutch | 16,005 | 0.40% | 17,950 | 0.51% | 19,980 | 0.62% | 19,575 | 0.67% |
| 18. | Niger-Congo languages | 15,515 | 0.30% | N | N | N | N | N | N |
| Swahili | 2,390 | 0.06% | 1,455 | 0.04% | 850 | 0.03% | 380 | 0.01% | |
| Akan (Twi) | 1,765 | 0.04% | 1,100 | 0.04% | 345 | 0.01% | N | N | |
| Kinyarwanda (Rwanda) | 770 | 0.02% | 440 | 0.01% | 60 | 0.01% | N | N | |
| Rundi (Kirundi) | 570 | 0.01% | 290 | 0.01% | 50 | 0.01% | N | N | |
| 19. | Persian | 14,835 | 0.37% | 10,655 | 0.30% | 7,700 | 0.24% | 3,700 | 0.13% |
| 20. | Gujarati | 12,775 | 0.32% | 8,675 | 0.24% | 6,280 | 0.19% | 4,910 | 0.17% |
| 21. | Italian | 11,475 | 0.29% | 11,960 | 0.34% | 13,095 | 0.41% | 13,935 | 0.48% |
| 22. | Somali | 9,425 | 0.24% | 5,515 | 0.16% | 3,130 | 0.10% | 810 | 0.03% |
| 23. | Portuguese | 8,565 | 0.22% | 7,380 | 0.21% | 7,205 | 0.22% | 6,110 | 0.21% |
| 24. | Romanian | 8,255 | 0.21% | 6,550 | 0.18% | 4,370 | 0.14% | 2,890 | 0.10% |
| 25. | Amharic | 7,015 | 0.18% | 5,110 | 0.14% | 2,785 | 0.09% | 1,100 | 0.04% |
| 26. | Bengali | 6,940 | 0.17% | 5.030 | 0.14% | 2,710 | 0.08% | 1,190 | 0.04% |
| 27. | Hungarian | 6,505 | 0.16% | 6,700 | 0.19% | 6,770 | 0.21% | 6,985 | 0.24% |
| 28. | Malayalam | 6,230 | 0.16% | 2,760 | 0.08% | 1,550 | 0.05% | 1,055 | 0.04% |
| 29. | Ilocano | 5,750 | 0.14% | 3,010 | 0.08% | 1,885 | 0.06% | N | N |
| 30. | Cebuano and other Bisayan languages | 5,025 | 0.13% | 3,255 | 0.09% | 1,370 | 0.04% | N | N |
| 31. | Nepali | 4,995 | 0.13% | 1,605 | 0.05% | N | N | N | N |
| 32. | Tamil | 4,650 | 0.11% | 2,645 | 0.07% | 1,385 | 0.04% | 1,110 | 0.04% |
| 33. | Japanese | 4,575 | 0.11% | 4,560 | 0.13% | 4,555 | 0.14% | 3,625 | 0.12% |
| 34. | Croatian | 4,425 | 0.11% | 3,960 | 0.11% | 4,150 | 0.13% | 4,195 | 0.14% |
| 35. | Serbian | 4,115 | 0.10% | 3,560 | 0.10% | 3,090 | 0.10% | 2,125 | 0.07% |
| 36. | Scandinavian languages | 3,750 | 0.09% | 4,935 | 0.14% | 6,045 | 0.19% | 6,795 | 0.23% |
| Danish | 2,225 | 0.06% | 2,805 | 0.08% | 3,510 | 0.11% | 3,615 | 0.12% | |
| Swedish | 785 | 0.02% | 950 | 0.03% | 1,145 | 0.04% | 1,345 | 0.05% | |
| Norwegian | 740 | 0.02% | 1,180 | 0.03% | 1,245 | 0.04% | 1,670 | 0.06% | |
| 37. | Greek | 3,285 | 0.08% | 2,965 | 0.08% | 3,305 | 0.10% | 2,765 | 0.10% |
| 38. | Afrikaans | 3,050 | 0.08% | 2,420 | 0.07% | N | N | N | N |
| 39. | Sinhalese | 2,935 | 0.07% | 1,940 | 0.05% | 835 | 0.03% | N | N |
| 40. | Sindhi | 2,835 | 0.07% | 2,560 | 0.07% | 2,000 | 0.06% | 1,990 | 0.07% |
| 41 | Turkish | 2,760 | 0.07% | 2,460 | 0.07% | 1,605 | 0.05% | 810 | 0.03% |
| 42 | Czech | 2,715 | 0.07% | 2,880 | 0.08% | 3,100 | 0.08% | 3,520 | 0.12% |
| 43. | Oromo language | 2,615 | 0.07% | 1,405 | 0.04% | N | N | N | N |
| 44. | Albanian | 2,435 | 0.06% | 1,685 | 0.05% | N | N | N | N |
| 45. | Pashto | 2,340 | 0.06% | 1,850 | 0.05% | 1,175 | 0.04% | 275 | 0.01% |
| 46. | Nilo-Saharan languages | 2,310 | 0.06% | N | N | N | N | N | N |
| 47. | Slovak | 2,275 | 0.06% | 2,145 | 0.06% | 2,430 | 0.08% | 1,605 | 0.06% |
| 48. | Creole | 2,120 | 0.05% | 1,560 | 0.05% | 415 | 0.01% | 250 | 0.01% |
| 49. | Khmer (Cambodian) | 2,075 | 0.05% | 1,745 | 0.05% | 1,740 | 0.05% | 1,450 | 0.05% |
| 50. | Bosnian | 2,020 | 0.05% | 1,745 | 0.05% | 1,745 | 0.05% | N | N |
In addition to the table above, other mother tongues in Alberta include (including languages with more than 407 people, or 0.01 per cent of respondents):
- 2,010 Telugu;
- 1,655 Marathi;
- 1,595 Hiligaynon;
- 1,505 Bulgarian;
- 1,470 Thai;
- 1,470 Kurdish;
- 1,350 Indo-Iranian languages, not included elsewhere;
- 1,310 Malay;
- 1,100 Serbo-Croatian;
- 1,075 Lao;
- 1,050 Hebrew;
- 975 Pampangan;
- 870 Sign languages;
- 835 Finnish;
- 780 Karenic languages;
- 755 Mongolian;
- 710 Tibetan;
- 655 Lithuanian;
- 640 Slovenian;
- 495 Latvian;
- 445 Armenian;
- 430 Macedonian;
In addition to the single-language responses detailed above, about 88,765 people reported having more than one mother tongue. There were 74,515 responses of both English and a non-official language; 2,785 of both French and a non-official language; 10,005 of both English and French; and 1,455 of English, French and a non-official language.
Religion
Religious affiliation (2021):[29]
Christian sub-affiliation (2021):[29]
Just under 50 percent of Albertans identify as Christian, while over 40 percent of residents identify with no religion. The largest denominations are the Roman Catholic, United, Anglican, Lutheran, and Eastern Orthodox and Oriental Orthodox Churches.
Just over 1 percent of Albertans are members of the Church of Jesus Christ of Latter-day Saints, descended from pioneers who emigrated from Utah around the turn of the 20th century; there are three temples in the province. Alberta also has large numbers of Pentecostal, Presbyterians, and evangelical Christians.
There are significant numbers of Mennonites and Hutterites, which are communal Anabaptist sects. There are also many Jehovah's Witnesses and Reformed Christians, as well a significant population of Seventh-day Adventists in and around Lacombe where the Canadian University College is located.
Alberta is also home to several Eastern Rite Churches as part of the legacy of Eastern European immigrants, including the Ukrainian Catholic Eparchy of Edmonton, and the Ukrainian Orthodox Diocese of Edmonton and Western Canada. There are 500 Doukhobors living in their few communities across Southern Alberta.
Many people of the Hindu, Sikh, and Muslim faiths also make Alberta their home; one of the largest Sikh temples in Canada is located just outside Edmonton. Most of Alberta's Jewish population of 11,390 lives in Calgary and Edmonton.
| Religion (2021) 1 | Denomination | Congregation | Proportion |
|---|---|---|---|
| Christian | 2,009,820 | 48.1% | |
| Anglican Church | 95,560 | 2.3% | |
| Baptist | 44,605 | 1.1% | |
| Catholic | 833,025 | 19.9% | |
| Eastern Orthodox and Oriental Orthodox | 63,775 | 1.5% | |
| Jehovah's Witnesses | 18,185 | 0.4% | |
| Latter Day Saints | 47,125 | 1.1% | |
| Lutheran | 78,925 | 1.9% | |
| Methodist | 9,640 | 0.2% | |
| Pentecostal | 53,900 | 1.3% | |
| Presbyterian | 22,850 | 0.5% | |
| Reformed | 14,735 | 0.4% | |
| United Church | 153,820 | 3.7% | |
| Other Christian | 541,520 | 15.2% | |
| Muslim | 202,535 | 4.8% | |
| Sikh | 103,600 | 2.5% | |
| Hindu | 78,520 | 1.9% | |
| Buddhist | 42,830 | 1.0% | |
| Jewish | 11,390 | 0.3% | |
| Other Religions | 33,220 | 0.8% | |
| Aboriginal spirituality | 19,755 | 0.5% | |
| No religious affiliation | 1,676,045 | 40.1% |
- ^1 Statistics Canada. 2022. Alberta (table). National Household Survey (NHS) Profile. 2021 National Household Survey. Released October 26, 2022.[29]
| Religious group | 2021[30] | 2011[31] | 2001[32] | 1991[33] | 1981[34] | |||||
|---|---|---|---|---|---|---|---|---|---|---|
| Pop. | % | Pop. | % | Pop. | % | Pop. | % | Pop. | % | |
| Christianity |
2,009,820 | 48.11% | 2,152,200 | 60.32% | 2,099,435 | 71.38% | 1,928,745 | 76.56% | 1,903,205 | 85.98% |
| Irreligion | 1,676,045 | 40.12% | 1,126,130 | 31.56% | 694,840 | 23.62% | 496,150 | 19.69% | 260,015 | 11.75% |
| Islam |
202,535 | 4.85% | 113,445 | 3.18% | 49,045 | 1.67% | 31,000 | 1.23% | 16,865 | 0.76% |
| Sikhism |
103,600 | 2.48% | 52,335 | 1.47% | 23,470 | 0.8% | 13,550 | 0.54% | 5,985 | 0.27% |
| Hinduism |
78,520 | 1.88% | 36,845 | 1.03% | 15,965 | 0.54% | 10,770 | 0.43% | 7,360 | 0.33% |
| Buddhism |
42,830 | 1.03% | 44,410 | 1.24% | 33,410 | 1.14% | 20,745 | 0.82% | 6,200 | 0.28% |
| Indigenous spirituality | 19,755 | 0.47% | 15,100 | 0.42% | — | — | — | — | — | — |
| Judaism |
11,390 | 0.27% | 10,900 | 0.31% | 11,085 | 0.38% | 9,950 | 0.39% | 10,655 | 0.48% |
| Other | 33,220 | 0.8% | 16,605 | 0.47% | 13,900 | 0.47% | 8,270 | 0.33% | 2,355 | 0.11% |
| Total responses | 4,177,715 | 98.01% | 3,567,975 | 97.88% | 2,941,150 | 98.87% | 2,519,180 | 98.96% | 2,213,650 | 98.92% |
| Total population | 4,262,635 | 100% | 3,645,257 | 100% | 2,974,807 | 100% | 2,545,553 | 100% | 2,237,724 | 100% |
Migration
Immigration
| Year | Immigrant percentage | Immigrant population | Total population |
|---|---|---|---|
| 1901 | 42.8% | 31,240 | 73,022 |
| 1911 | 56.8% | 212,426 | 374,295 |
| 1921 | 46.5% | 273,364 | 588,454 |
| 1931 | 41.8% | 305,738 | 731,605 |
| 1941 | 32.5% | 258,387 | 796,169 |
| 1951 | 25.5% | 240,016 | 939,501 |
| 1961 | 21.7% | 288,749 | 1,331,944 |
| 1971 | 17.3% | 282,260 | 1,627,870 |
The 2021 census reported that immigrants (individuals born outside Canada) comprise 970,975 persons or 23.2 percent of the total population of Alberta.[37]
| Country of Birth | 2021[38][37] | 2016[39] | 2011[40][41] | 2006[42][43] | 2001[44][45] | |||||
|---|---|---|---|---|---|---|---|---|---|---|
| Pop. | % | Pop. | % | Pop. | % | Pop. | % | Pop. | % | |
| 167,735 | 17.3% | 123,830 | 14.7% | 69,575 | 10.8% | 36,630 | 7% | 24,800 | 5.7% | |
| 122,145 | 12.6% | 91,660 | 10.8% | 59,020 | 9.2% | 38,610 | 7.3% | 24,670 | 5.6% | |
| 61,390 | 6.3% | 57,695 | 6.8% | 49,595 | 7.7% | 41,495 | 7.9% | 27,630 | 6.3% | |
| 56,675 | 5.8% | 59,215 | 7% | 58,245 | 9% | 60,210 | 11.4% | 59,510 | 13.6% | |
| 30,815 | 3.2% | 28,080 | 3.3% | 19,110 | 3% | 12,095 | 2.3% | 5,415 | 1.2% | |
| 30,540 | 3.1% | 30,460 | 3.6% | 31,050 | 4.8% | 28,325 | 5.4% | 27,510 | 6.3% | |
| 27,875 | 2.9% | 27,080 | 3.2% | 26,020 | 4% | 24,270 | 4.6% | 22,005 | 5% | |
| 21,065 | 2.2% | 12,405 | 1.5% | 5,575 | 0.9% | 1,740 | 0.3% | 985 | 0.2% | |
| 18,725 | 1.9% | 19,115 | 2.3% | 17,300 | 2.7% | 17,455 | 3.3% | 18,600 | 4.2% | |
| 17,985 | 1.9% | 15,665 | 1.9% | 10,755 | 1.7% | 5,970 | 1.1% | 3,880 | 0.9% | |
| 16,635 | 1.7% | 19,200 | 2.3% | 20,085 | 3.1% | 21,570 | 4.1% | 21,845 | 5% | |
| 16,180 | 1.7% | 13,850 | 1.6% | 9,575 | 1.5% | 8,120 | 1.5% | 5,290 | 1.2% | |
| 15,595 | 1.6% | 16,930 | 2% | 16,335 | 2.5% | 19,165 | 3.6% | 19,680 | 4.5% | |
| 14,420 | 1.5% | 10,565 | 1.2% | 6,375 | 1% | 3,655 | 0.7% | 1,370 | 0.3% | |
| 12,730 | 1.3% | 14,035 | 1.7% | 15,290 | 2.4% | 16,715 | 3.2% | 17,385 | 4% | |
| 10,385 | 1.1% | 9,535 | 1.1% | 6,860 | 1.1% | 3,155 | 0.6% | 945 | 0.2% | |
| 9,975 | 1% | 4,800 | 0.6% | 1,185 | 0.2% | 975 | 0.2% | 610 | 0.1% | |
| 9,960 | 1% | 10,390 | 1.2% | 8,390 | 1.3% | 7,530 | 1.4% | 6,870 | 1.6% | |
| 9,720 | 1% | 4,815 | 0.6% | 2,805 | 0.4% | 965 | 0.2% | 845 | 0.2% | |
| 8,960 | 0.9% | 7,355 | 0.9% | 6,010 | 0.9% | 4,950 | 0.9% | 4,025 | 0.9% | |
| 8,915 | 0.9% | 8,150 | 1% | 6,430 | 1% | 5,435 | 1% | 5,170 | 1.2% | |
| 8,865 | 0.9% | 8,910 | 1.1% | 5,595 | 0.9% | 3,995 | 0.8% | 2,400 | 0.5% | |
| 8,695 | 0.9% | 6,845 | 0.8% | 4,340 | 0.7% | 3,755 | 0.7% | 3,705 | 0.8% | |
| 8,545 | 0.9% | 7,060 | 0.8% | 3,395 | 0.5% | 2,120 | 0.4% | 795 | 0.2% | |
| 7,470 | 0.8% | 7,260 | 0.9% | 5,900 | 0.9% | 4,850 | 0.9% | 3,635 | 0.8% | |
| 7,190 | 0.7% | 7,725 | 0.9% | 6,235 | 1% | 5,165 | 1% | 3,920 | 0.9% | |
| 6,990 | 0.7% | 8,115 | 1% | 8,050 | 1.2% | 8,705 | 1.7% | 9,830 | 2.2% | |
| 6,940 | 0.7% | 7,255 | 0.9% | 5,535 | 0.9% | 5,475 | 1% | 4,695 | 1.1% | |
| 6,760 | 0.7% | 5,320 | 0.6% | 3,120 | 0.5% | 2,140 | 0.4% | 1,490 | 0.3% | |
| 6,585 | 0.7% | 5,190 | 0.6% | 4,345 | 0.7% | 3,305 | 0.6% | 1,695 | 0.4% | |
| 6,215 | 0.6% | 5,935 | 0.7% | 3,825 | 0.6% | 2,300 | 0.4% | 1,490 | 0.3% | |
| 6,070 | 0.6% | 5,120 | 0.6% | 4,005 | 0.6% | 3,425 | 0.6% | 2,875 | 0.7% | |
| 6,035 | 0.6% | 5,085 | 0.6% | 3,680 | 0.6% | 1,835 | 0.3% | 690 | 0.2% | |
| 4,970 | 0.5% | 3,915 | 0.5% | 1,260 | 0.2% | 490 | 0.1% | 115 | 0% | |
| 4,930 | 0.5% | 4,835 | 0.6% | 3,295 | 0.5% | 1,600 | 0.3% | 1,330 | 0.3% | |
| 4,800 | 0.5% | 4,335 | 0.5% | 1,930 | 0.3% | 1,350 | 0.3% | 500 | 0.1% | |
| 4,690 | 0.5% | 4,625 | 0.5% | 4,140 | 0.6% | 3,975 | 0.8% | 3,395 | 0.8% | |
| 4,660 | 0.5% | 4,510 | 0.5% | — | — | 4,035 | 0.8% | 4,435 | 1% | |
| 4,335 | 0.4% | 4,555 | 0.5% | 3,720 | 0.6% | 3,505 | 0.7% | 3,065 | 0.7% | |
| 4,225 | 0.4% | 3,940 | 0.5% | 2,795 | 0.4% | 2,475 | 0.5% | 2,840 | 0.6% | |
| 4,215 | 0.4% | 4,255 | 0.5% | 4,305 | 0.7% | 4,345 | 0.8% | 3,775 | 0.9% | |
| 4,145 | 0.4% | 2,580 | 0.3% | — | — | 3,400 | 0.6% | 1,055 | 0.2% | |
| 3,990 | 0.4% | 4,260 | 0.5% | — | — | 3,215 | 0.6% | 2,855 | 0.7% | |
| 3,690 | 0.4% | 3,360 | 0% | — | — | 2,480 | 0.5% | 2,370 | 0.5% | |
| 3,800 | 0.4% | 2,545 | 0.3% | 1,740 | 0.3% | 1,130 | 0.2% | 750 | 0.2% | |
| 3,380 | 0.3% | 3,060 | 0.4% | 2,935 | 0.5% | 2,265 | 0.4% | 1,730 | 0.4% | |
| Total | 970,975 | 100% | 845,215 | 100% | 644,115 | 100% | 527,030 | 100% | 438,335 | 100% |
Recent immigration
The 2021 Canadian census counted a total of 193,170 people who immigrated to Alberta between 2016 and 2021.
| Recent immigrants to Alberta by place of birth (2016 to 2021)[46] | |||
|---|---|---|---|
| Rank | Country | Population | % of recent immigrants |
| 1 | Philippines | 47,605 | 24.6% |
| 2 | India | 31,815 | 16.5% |
| 3 | Nigeria | 9,840 | 5.1% |
| 4 | China | 9,495 | 4.9% |
| 5 | Syria | 7,295 | 3.8% |
| 6 | United States | 5,175 | 2.7% |
| 7 | Eritrea | 5,120 | 2.7% |
| 8 | Mexico | 4,165 | 2.2% |
| 9 | Pakistan | 4,080 | 2.1% |
| 10 | Ethiopia | 3,960 | 2.1% |
| 11 | United Kingdom | 3,800 | 2% |
| 12 | South Korea | 3,430 | 1.8% |
| 13 | Iran | 3,260 | 1.7% |
| 14 | Nepal | 2,620 | 1.4% |
| 15 | Jamaica | 2,130 | 1.1% |
Interprovincial migration

Over the past five decades, Alberta has had the highest net increase from interprovincial migration of any province. However, it typically experiences population decline during economic downturns, as it did during the 1980s. Oil is the main industry driving interprovincial migration to Alberta, as many Canadians move to Alberta to work on the oil fields. Interprovincial migration to Alberta rises and drops dependent of the price of oil. There was a dramatic reduction after the 2014 drop in oil prices.[47]
| In-migrants | Out-migrants | Net migration | |
|---|---|---|---|
| 2009–10 | |||
| 2010–11 | |||
| 2011–12 | |||
| 2012–13 | |||
| 2013–14 | |||
| 2014–15 | |||
| 2015–16 | |||
| 2016–17 | |||
| 2017–18 | |||
| 2018–19 | |||
| 2019–20 |
Source: Statistics Canada[48]
See also
Notes
- The three most populated provinces, as of July 1, 2018 were Ontario with 14,322,757 inhabitants representing 38.6% of the Canadian population; Quebec with 22.6% or 8,390,499 people and British Columbia 13.5% and British Columbia with 4,991,687 people or 13.5%.
- Statistic includes all persons that did not make up part of a visible minority or an Indigenous identity.
- Now excluding Plautdietsch.
References
- StatCan - Alberta population
- "2001 Census Analysis Series - A profile of the Canadian population : where we live" (PDF). Statistics Canada. p. 6. Archived from the original (PDF) on 2011-08-06. Retrieved 2011-08-17.
- http://www12.statcan.ca/census-recensement/index-eng.cfm# Archived 2020-11-05 at the Wayback Machine - Statistics Canada
- Canada's population estimates: Total population, July 1, 2018 (Report). The Daily. Government of Canada. Statistics Canada. September 27, 2018. Retrieved January 16, 2019.
- Quarterly Population Report Third Quarter 2018 (PDF) (Report). December 20, 2018. p. 4. Retrieved January 16, 2019.
- "Population statistics". Alberta Government. December 20, 2018. Retrieved January 16, 2019.
- "Census of Population". February 7, 2017. Retrieved April 30, 2017.
- "Population and dwelling counts, for Canada, provinces and territories, census metropolitan areas and census agglomerations, 2011 and 2006 censuses - 100% data (Alberta)". Statistics Canada. 2011-02-06. Retrieved 2011-02-13.
- "Population change by rank, 2016 to 2021 for CMAs or CAs in Alberta". Statistics Canada. 2022-02-25. Retrieved 2022-02-25.
- "Immigrant status and period of immigration, 2016 counts, both sexes, age (total), Canada and census metropolitan areas and census agglomerations, 2016 Census". Statistics Canada. 2019-02-20. Retrieved 2019-04-02.
- "Population and dwelling counts, for Canada, provinces and territories, census metropolitan areas and census agglomerations, 2006 and 2001 censuses - 100% data (Alberta)". Statistics Canada. 2010-01-06. Retrieved 2012-03-02.
- "Population and Dwelling Counts, for Canada, Provinces and Territories, Census Metropolitan Areas and Census Agglomerations, 2001 and 1996 Censuses - 100% Data (Alberta)". Statistics Canada. Retrieved 2011-04-10.
- A National Overview: Population and Dwelling Counts (1996 Census ed.). Ottawa: Statistics Canada. April 1997. ISBN 0-660-59283-5.
- "Population and dwelling counts, for Canada, provinces and territories, and census subdivisions (municipalities), 2006 and 2001 censuses - 100% data (Alberta)". Statistics Canada. 2010-01-06. Retrieved 2011-04-10.
- "2022 Municipal Codes" (PDF). Alberta Municipal Affairs. January 5, 2022. Retrieved January 21, 2022.
- "Population and dwelling counts, for Canada, provinces and territories, and census subdivisions (municipalities), 2011 and 2006 censuses (Alberta)". Statistics Canada. Retrieved April 3, 2012.
- "Population and Dwelling Counts, for Canada, Provinces and Territories, and Census Subdivisions (Municipalities), 2001 and 1996 Censuses - 100% Data (Alberta)". Statistics Canada. Retrieved 2011-04-10.
- "1996 Community Profiles". Statistics Canada. Retrieved 2011-04-26.
- Profile table, Census Profile 2021, Ethnic or cultural origin.
- "Census Profile, 2016 Census Alberta [Province] and Canada [Country]". 8 February 2017. Retrieved 19 April 2020.
- "Population by visible minority group, place of residence and projection scenario, Canada, 2011 and 2036". 25 January 2017. Retrieved 19 April 2020.
- "Projections of the Aboriginal Population and Households in Canada 2011 to 2036" (PDF). Retrieved 19 April 2020.
- https://www12.statcan.gc.ca/census-recensement/2021/dp-pd/prof/details/page.cfm?Lang=E&SearchText=Alberta&DGUIDlist=2021A000248&GENDERlist=1,2,3&STATISTIClist=1&HEADERlist=0, Indigenous Population, Profile table, Census Profile, 2021 Census of Population, Statistics Canada - Province/Territory
- https://www150.statcan.gc.ca/t1/tbl1/en/tv.action?pid=9810030801&pickMembers%5B0%5D=1.121&pickMembers%5B1%5D=2.1&pickMembers%5B2%5D=3.1&pickMembers%5B3%5D=4.1, Visible minority by immigrant status and period of immigration, Statistics Canada - Province/Territory
- Government of Canada, Statistics Canada (2022-10-26). "Census Profile, 2021 Census of Population". www12.statcan.gc.ca. Retrieved 2023-07-04.
- Government of Canada, Statistics Canada (2022-08-17). "Census Profile, 2021 Census of Population Profile table Alberta [Province]". www12.statcan.gc.ca. Retrieved 2022-08-17.
- "Language Highlight Tables". 2016 Census. Statistics Canada. 2019. Retrieved July 16, 2019.
- "File not found | Fichier non trouvé".
- "Profile table, Census Profile, 2021 Census of Population". 2021 National Household Survey. Statistics Canada. 2022. Retrieved October 26, 2022.
- Government of Canada, Statistics Canada (2022-10-26). "Census Profile, 2021 Census of Population". www12.statcan.gc.ca. Retrieved 2023-04-14.
- Government of Canada, Statistics Canada (2015-11-27). "NHS Profile". www12.statcan.gc.ca. Retrieved 2023-04-14.
- Government of Canada, Statistics Canada (2019-07-02). "2001 Community Profiles". www12.statcan.gc.ca. Retrieved 2023-04-14.
- Government of Canada, Statistics Canada (2019-03-29). "Data tables, 1991 Census R9101 - Population by Religion (29), Showing Age Groups (13) Education (20% Data) - Canada, provinces and territories, census divisions and census subdivisions". www12.statcan.gc.ca. Retrieved 2023-04-14.
- Government of Canada, Statistics Canada (2013-04-03). "1981 Census of Canada 20 per cent data base : highlight information on ethnicity, place of birth, citizenship, income, language, immigration, religion, shelter costs". www12.statcan.gc.ca. Retrieved 2023-04-14.
- Government of Canada, Statistics Canada (2013-04-03). "Sixth census of Canada,1921 . Vol. II: Ages, conjugal condition, birthplace, birthplace of parents, year of immigration and naturalization, language spoken, literacy, school attendance, blindness and deaf-mutism". www12.statcan.gc.ca. Retrieved 2023-01-10.
- Government of Canada, Statistics Canada (4 September 2022). "1971 Census of Canada : population : vol. I – part 3 = Recensement du Canada 1971 : population : vol. I – partie 3. Birthplace. TABLE 42. Population Bom Outside Canada, Showing Numerical and Percentage Distribution, for Canada and Provinces, 1921-1971". www12.statcan.gc.ca. Retrieved 2023-01-10.
- Government of Canada, Statistics Canada (2022-10-26). "Census Profile, 2021 Census of Population". www12.statcan.gc.ca. Retrieved 2023-01-10.
- Government of Canada, Statistics Canada (2023-06-21). "Place of birth and period of immigration by gender and age: Province or territory". www12.statcan.gc.ca. Retrieved 2023-10-15.
- Government of Canada, Statistics Canada (2019-06-17). "Data tables, 2016 Census Immigrant Status and Period of Immigration (11), Place of Birth (272), Age (7A) and Sex (3) for the Population in Private Households of Canada, Provinces and Territories, Census Divisions and Census Subdivisions, 2016 Census - 25% Sample Data". www12.statcan.gc.ca. Retrieved 2023-03-04.
- Government of Canada, Statistics Canada (2019-01-23). "2011 National Household Survey: Data tables Profile - Immigration and Ethnocultural Diversity, and Aboriginal Peoples for Canada, Provinces, Territories, Census Divisions and Census Subdivisions, National Household Survey, 2011". www12.statcan.gc.ca. Retrieved 2023-03-04.
- Government of Canada, Statistics Canada (2015-11-27). "NHS Profile, 2011". www12.statcan.gc.ca. Retrieved 2023-03-04.
- Government of Canada, Statistics Canada (2009-03-23). "Place of birth for the immigrant population by period of immigration, 2006 counts and percentage distribution, for Canada, provinces and territories - 20% sample data". www12.statcan.gc.ca. Retrieved 2023-03-04.
- Government of Canada, Statistics Canada (2020-05-01). "2006 Census Topic-based tabulations Immigrant Status and Period of Immigration (8) and Place of Birth (261) for the Immigrants and Non-permanent Residents of Canada, Provinces, Territories, Census Metropolitan Areas and Census Agglomerations, 2006 Census - 20% Sample Data". www12.statcan.gc.ca. Retrieved 2023-03-04.
- Government of Canada, Statistics Canada (2013-12-23). "2001 Census Topic-based tabulations Immigrant Status and Period of Immigration (10A) and Place of Birth of Respondent (260) for Immigrants and Non-permanent Residents, for Canada, Provinces, Territories, Census Metropolitan Areas and Census Agglomerations, 2001 Census - 20% Sample Data". www12.statcan.gc.ca. Retrieved 2023-03-04.
- Government of Canada, Statistics Canada (2013-12-23). "2001 Census Topic-based tabulations Selected Places of Birth (85) for the Immigrant Population, for Canada, Provinces, Territories, Census Metropolitan Areas and Census Agglomerations, 1996 and 2001 Censuses - 20% Sample Data". www12.statcan.gc.ca. Retrieved 2023-03-04.
- "Immigrant status and period of immigration by place of birth and citizenship". 26 October 2022.
- "The death of the Alberta dream - Macleans.ca". www.macleans.ca. Retrieved 2018-12-28.
- Statistics Canada, table 051-0012: Interprovincial migrants, by age group and sex, Canada, provinces and territories, annual.
| History | ||
|---|---|---|
| Politics | ||
| Geography | ||
| Communities | ||
| Economy | ||
| Culture | ||
| ||