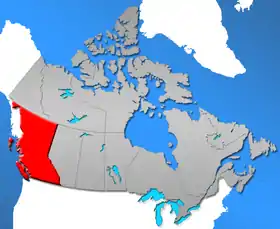
Demographics of British Columbia
British Columbia is a Canadian province with a population of about 5.5 million people. The province represents about 13.2% of the population of the Canadian population. Most of the population is between the ages of 15 and 49. About 64% of British Columbians have European descent with significant Asian and Aboriginal minorities and just under 30% of British Columbians are immigrants. Over half of the population is irreligious, with Christianity and Sikhism being the most followed religions.

Vital statistics
2020[1]
Birth rate: 8.3 births per 1,000 (2021) (Canadian average = 9.9)[2]
Death rate: 8.3 deaths per 1,000 (2021)[2] (Canadian average = 8.3)
Infant mortality rate: 4.0 deaths per 1,000 live births[3]
Life expectancy at birth: 82.4 years
Total fertility rate: 1.17 children born per woman (Canadian average = 1.40)
Age structure
| Males | Females | |||
|---|---|---|---|---|
| Age Group |
Number | Percent | Number | Percent |
| 0-4 | 105,809 | 2.4% | 100,116 | 2.2% |
| 5-9 | 117,908 | 2.8% | 111,383 | 2.6% |
| 10-14 | 133,809 | 3.1% | 126,388 | 3.0% |
| 15-19 | 143,449 | 3.4% | 136,227 | 3.2% |
| 20-24 | 155,369 | 3.7% | 147,770 | 3.5% |
| 25-29 | 139,521 | 3.3% | 138,299 | 3.3% |
| 30-34 | 144,788 | 3.4% | 145,869 | 3.4% |
| 35-39 | 155,429 | 3.7% | 158,364 | 3.7% |
| 40-44 | 177,381 | 4.2% | 179,216 | 4.2% |
| 45-49 | 172,786 | 4.1% | 177,082 | 4.2% |
| 50-54 | 157,596 | 3.7% | 159,965 | 3.8% |
| 55-59 | 138,096 | 3.2% | 139,772 | 3.3% |
| 60-64 | 101,610 | 2.4% | 103,764 | 2.4% |
| 65-69 | 80,051 | 1.9% | 82,363 | 1.9% |
| 70-74 | 70,060 | 1.6% | 72,493 | 1.7% |
| 75-79 | 54,572 | 1.3% | 64,344 | 1.5% |
| 80-84 | 36,304 | 0.8% | 53,047 | 1.2% |
| 85+ | 24,544 | 0.6% | 48,978 | 1.1% |
| Totals | 2,109,082 | 49.6% | 2,145,440 | 50.4% |
- Source: BCStats[4]
Population history
| Year | Population | Five year % change |
Ten year % change |
Rank among provinces |
|---|---|---|---|---|
| 1851 | 55,000 | n/a | n/a | n/a |
| 1861 | 51,524 | n/a | -6.3 | n/a |
| 1871 | 36,247 | n/a | -29.7 | 7 |
| 1881 | 49,459 | n/a | 36.4 | 8 |
| 1891 | 98,173 | n/a | 98.5 | 8 |
| 1901 | 178,657 | n/a | 82.0 | 6 |
| 1911 | 392,480 | n/a | 119.7 | 6 |
| 1921 | 524,582 | n/a | 33.7 | 6 |
| 1931 | 694,263 | n/a | 32.3 | 6 |
| 1941 | 817,861 | n/a | 17.8 | 4 |
| 1951 | 1,165,210 | n/a | 42.5 | 3 |
| 1956 | 1,398,464 | 20.0 | n/a | 3 |
| 1961 | 1,629,082 | 16.5 | 39.8 | 3 |
| 1966 | 1,873,674 | 15.0 | 34.0 | 3 |
| 1971 | 2,184,620 | 16.6 | 34.1 | 3 |
| 1976 | 2,466,610 | 12.9 | 31.6 | 3 |
| 1981 | 2,744,467 | 11.3 | 25.6 | 3 |
| 1986 | 2,883,370 | 5.1 | 16.9 | 3 |
| 1991 | 3,282,061 | 13.8 | 19.6 | 3 |
| 1996 | 3,724,500 | 13.5 | 29.2 | 3 |
| 2001 | 3,907,738 | 4.9 | 19.1 | 3 |
| 2006 | 4,113,487 | 5.4 | 10.4 | 3 |
| 2011 | 4,400,057 | 7.0 | 12.6 | 3 |
| 2016 | 4,648,055 | 5.6 | 13.0 | 3 |
| 2021 | 5,000,879 | 7.6 | 13.7 | 3 |
- Source: Statistics Canada[5]
Ethnic Origins
| Part of a series on |
| Ethnicity in British Columbia |
|---|
|
|
|
|
First-generation immigrants from the British Isles remain a strong component of local society despite limitations on immigration from Britain since the ending of special status for British subjects in the 1960s. Also present in large numbers relative to other cities in Canada (except Toronto), and also present in BC ever since the province was first settled (unlike Toronto), are many European ethnicities of the first and second generation, notably Germans, Ukrainians, Scandinavians, Yugoslavs and Italians; third-generation Europeans are generally of mixed lineage, and traditionally intermarried with other ethnic groups more than in any other Canadian province.
In recent decades, the proportion of those of Chinese and Indian ethnicity has risen sharply, though still outnumbered by the historically strong population of those of German ancestry. Visible minorities have become an important factor in ethnic-based politics, though most visible minorities are less numerous than the long-standing non-British European ethnicities making up BC's "invisible minorities".
Note: The following statistics represent both single (e.g., "German") and multiple (e.g., "part Chinese, part English") responses to the 2006 and 2016 Census, and thus add up to more than 100%.
| Ethnic Origin | Population (2016)[6] | Percent (2016) | Population (2006)[7] | Percent (2006) |
|---|---|---|---|---|
| English | 1,203,540 | 26.39% | 1,207,245 | 29.63% |
| Canadian | 866,530 | 19% | 720,200 | 17.67% |
| Scottish | 860,775 | 18.88% | 828,145 | 20.32% |
| Irish | 675,135 | 14.80% | 618,120 | 15.17% |
| German | 603,265 | 13.23% | 561,570 | 13.78% |
| Chinese | 540,155 | 11.84% | 432,435 | 10.60% |
| French | 388,815 | 8.53% | 361,215 | 8.86% |
| Indian | 309,315 | 6.78% | 232,370 | 5.70% |
| Ukrainian | 229,205 | 5.03% | 197,265 | 4.84% |
| Indigenous peoples of North America | 220,245 | 4.83% | 193,060 | 4.74% |
| Dutch (Netherlands) | 213,670 | 4.69% | 196,420 | 4.82% |
| Italian | 166,095 | 3.64% | 143,155 | 3.51% |
| Polish | 149,635 | 3.28% | 128,360 | 3.15% |
| Norwegian | 138,430 | 3.04% | 129,420 | 3.18% |
| Russian | 131,060 | 2.87% | 114,105 | 2.80% |
| Welsh | 113,905 | 2.5% | 104,275 | 2.56% |
| Swedish | 110,030 | 2.41% | 104,025 | 2.55% |
| Filipino | 158,215 | 3.47% | 94,255 | 2.3% |
| Métis | 90,515 | 1.98% | 62,570 | 1.5% |
| American (USA) | 78,170 | 1.71% | 66,765 | 1.6% |
| Spanish | 64,470 | 1.41% | 52,640 | 1.3% |
| Korean | 63,300 | 1.39% | 51,860 | 1.3% |
| Danish | 58,205 | 1.28% | 56,125 | 1.4% |
| Hungarian (Magyar) | 56,535 | 1.24% | 49,870 | 1.2% |
| Japanese | 51,150 | 1.12% | 41,585 | 1.0% |
| Austrian | 48,510 | 1.06% | 46,620 | 1.1% |
| Iranian | 47,985 | 1.05% | 29,265 | 0.7% |
| Portuguese | 41,770 | 0.92% | 34,660 | 0.9% |
| Vietnamese | 41,435 | 0.91% | 30,835 | 0.8% |
| Punjabi | 38,725 | 0.85% | 18,525 | 0.5% |
| Finnish | 34,150 | 0.75% | 29,875 | 0.7% |
| Swiss | 31,390 | 0.69% | 28,240 | 0.7% |
| Romanian | 31,250 | 0.69% | 25,670 | 0.6% |
| Icelandic | 26,410 | 0.58% | 22,110 | 0.5% |
| Greek | 24,460 | 0.54% | 21,770 | 0.5% |
| Croatian | 23,845 | 0.52% | 18,815 | 0.5% |
| Czech | 23,375 | 0.51% | 21,150 | 0.5% |
| Belgian | 19,980 | 0.44% | 17,510 | 0.4% |
| Jewish | 17,580 | 0.39% | 30,830 | 0.8% |
Projections
| 2031[8][9] | 2036[8][9] | 2041[8][9] | ||||
|---|---|---|---|---|---|---|
| Population | % | Population | % | Population | % | |
| 3,145,000 | 51.46% | 3,112,000 | 48.23% | 3,060,000 | 45.37% | |
| 977,000 | 15.99% | 1,072,000 | 16.61% | 1,160,000 | 17.2% | |
| 789,000 | 12.91% | 861,000 | 13.34% | 927,000 | 13.75% | |
| 125,000 | 2.05% | 143,000 | 2.22% | 161,000 | 2.39% | |
| 63,000 | 1.03% | 68,000 | 1.05% | 72,000 | 1.07% | |
| 748,000 | 12.24% | 860,000 | 13.33% | 958,000 | 14.21% | |
| 399,000 | 6.53% | 429,000 | 6.65% | 456,000 | 6.76% | |
| 246,000 | 4.03% | 262,000 | 4.06% | 278,000 | 4.12% | |
| 142,000 | 2.32% | 155,000 | 2.4% | 166,000 | 2.46% | |
| 2,000 | 0.03% | 2,000 | 0.03% | 3,000 | 0.04% | |
|
9,000 | 0.15% | 10,000 | 0.15% | 10,000 | 0.15% |
| 366,000 | 5.99% | 421,000 | 6.52% | 475,000 | 7.04% | |
| 277,000 | 4.53% | 323,000 | 5.01% | 369,000 | 5.47% | |
|
89,000 | 1.46% | 98,000 | 1.52% | 106,000 | 1.57% |
| 169,000 | 2.77% | 199,000 | 3.08% | 227,000 | 3.37% | |
| 55,000 | 0.9% | 65,000 | 1.01% | 74,000 | 1.1% | |
| 114,000 | 1.87% | 134,000 | 2.08% | 153,000 | 2.27% | |
| 108,000 | 1.77% | 124,000 | 1.92% | 139,000 | 2.06% | |
| 101,000 | 1.65% | 118,000 | 1.83% | 134,000 | 1.99% | |
|
99,000 | 1.62% | 117,000 | 1.81% | 135,000 | 2% |
|
6,111,000 | 100% | 6,453,000 | 100% | 6,744,000 | 100% |
Indo-Canadians
Visible minorities and Indigenous peoples
- Note: Statistics Canada defines visible minorities as defined in the Employment Equity Act which defines visible minorities as "persons, other than Aboriginal peoples, who are non-Caucasian in race or non-white in colour".
Population of British Columbia by visible minority and indigenous identity (2021):[10]
| Visible minority and Indigenous population (Canada 2021 Census)[11] | |||
|---|---|---|---|
| Population group | Population | % | |
| European[lower-alpha 1] | 2,936,245 | 59.7% | |
| Visible minority group | South Asian | 473,965 | 9.6% |
| Chinese | 550,590 | 11.2% | |
| Black | 61,760 | 1.3% | |
| Filipino | 174,280 | 3.5% | |
| Arab | 28,010 | 0.6% | |
| Latin American | 65,970 | 1.3% | |
| Southeast Asian | 71,785 | 1.5% | |
| West Asian | 69,270 | 1.4% | |
| Korean | 72,815 | 1.5% | |
| Japanese | 44,120 | 0.9% | |
| Visible minority, n.i.e. | 18,080 | 0.4% | |
| Multiple visible minorities | 58,840 | 1.2% | |
| Total visible minority population | 1,689,490 | 34.4% | |
| Indigenous group | First Nations (North American Indian) | 180,085 | 3.7% |
| Métis | 97,860 | 2.0% | |
| Inuk (Inuit) | 1,720 | 0.0% | |
| Multiple Indigenous responses | 5,980 | 0.1% | |
| Indigenous responses n.i.e. | 4,560 | 0.1% | |
| Total Indigenous population | 290,210 | 5.9% | |
| Total population | 4,915,945 | 100.0% | |
Languages
Knowledge of languages
The question on knowledge of languages allows for multiple responses. The following figures are from the 2021 Canadian Census and the 2016 Canadian Census, and lists languages that were selected by at least one per cent of respondents.
| Language | 2021[12] | 2016 | ||
|---|---|---|---|---|
| Pop. | % | Pop. | % | |
| English | 4,753,280 | 96.69% | 4,560,235 | 96.60% |
| French | 327,350 | 6.66% | 314,225 | 6.89% |
| Punjabi | 315,000 | 6.41% | 244,485 | 5.36% |
| Mandarin | 312,625 | 6.36% | 265,635 | 5.83% |
| Cantonese | 246,045 | 5.01% | 234,445 | 5.14% |
| Spanish | 143,900 | 2.93% | 115,115 | 2.52% |
| Hindi | 134,950 | 2.75% | 81,330 | 1.78% |
| Tagalog | 133,780 | 2.72% | 113,265 | 2.48% |
| German | 84,325 | 1.72% | 95,005 | 2.08% |
| Korean | 69,935 | 1.42% | 57,490 | 1.26% |
| Iranian Persian[note 1] | 61,525 | 1.25% | 49,835 | 1.09% |
Mother tongue
Figures shown are for the number of single language responses and the percentage of total single-language responses. Numerous other languages were also counted, but only languages with more than 2,000 native speakers are shown.
| Language | 2016 Census | % | 2006 Census | % |
|---|---|---|---|---|
| English | 3,170,110 | 70.5% | 2,875,770 | 71.5% |
| Punjabi | 198,805 | 4.4% | 158,750 | 3.9% |
| Cantonese | 193,530 | 4.3% | 131,245 | 3.3% |
| Mandarin | 186,325 | 4.1% | 72,160 | 1.8% |
| Tagalog (Filipino) | 78,770 | 1.8% | 50,425 | 1.3% |
| German | 66,885 | 1.5% | 86,690 | 2.2% |
| French | 55,325 | 1.2% | 54,745 | 1.4% |
| Korean | 52,160 | 1.2% | 46,500 | 1.2% |
| Spanish | 47,010 | 1.0% | 34,075 | 0.9% |
| Persian | 43,470 | 1.0% | 28,150 | 0.7% |
| Vietnamese | 27,150 | 0.6% | 24,560 | 0.7% |
| Hindi | 26,720 | 0.6% | 23,240 | 0.6% |
| Russian | 25,955 | 0.6% | 19,320 | 0.5% |
| Italian | 22,680 | 0.5% | 27,020 | 0.7% |
| Japanese | 21,350 | 0.5% | 20,040 | 0.5% |
| Dutch | 21,020 | 0.5% | 26,355 | 0.7% |
| Arabic | 17,480 | 0.4% | 8,440 | 0.2% |
| Portuguese | 17,450 | 0.4% | 14,385 | 0.4% |
| Polish | 16,910 | 0.4% | 17,565 | 0.4% |
| Chinese, n.o.s. | 10,050 | 0.2% | 132,755 | 3.2% |
| Urdu | 9,885 | 0.2% | 7,025 | 0.2% |
| Hungarian | 9,025 | 0.2% | 10,670 | 0.3% |
| Romanian | 8,730 | 0.2% | 6,335 | 0.2% |
| Ukrainian | 8,630 | 0.2% | 12,285 | 0.3% |
| Croatian | 7,475 | 0.2% | 8,505 | 0.2% |
| Serbian | 7,045 | 0.2% | 6,180 | 0.2% |
| Gujarati | 6,895 | 0.2% | 6,565 | 0.2% |
| Greek | 6,115 | 0.1% | 6,620 | 0.2% |
| Czech | 5,920 | 0.1% | 6,000 | 0.1% |
| Ilocano | 5,240 | 0.1% | 3,100 | 0.1% |
| Danish | 4,665 | 0.1% | 6,720 | 0.2% |
| Malay | 3,895 | 0.1% | 3,100 | 0.1% |
| Finnish | 3,760 | 0.1% | 4,770 | 0.1% |
| Tamil | 3,615 | 0.1% | 3,200 | 0.1% |
| Slovak | 3,400 | 0.1% | 3,490 | 0.1% |
| Turkish | 3,145 | 0.1% | 2,255 | 0.1% |
| Swedish | 2,520 | 0.1% | 2,875 | 0.1% |
| Athabaskan languages | 2,310 | 0.1% | 3,500 | 0.1% |
| Salish languages | 2,270 | 0.1% | 3,190 | 0.1% |
| Norwegian | 2,005 | 0.1% | 3,275 | 0.1% |
| Source: Statistics Canada 2006 & 2016 Census[13][14] | ||||
Religion
The largest denominations by number of adherents according to the 2021 census were Irreligion (atheist, agnostic, and so on.) with 2,559,250 (52.2%); Christianity with 1,684,870 (34.4%); Sikhism with 290,870 (5.9%); Islam with 125,915 (2.6%); Buddhism with 83,860 (1.7%); and Hinduism with 81,320 (1.7%).
| Religious group | 2021[16] | 2011[17] | 2001[18] | 1991[19] | 1981[20] | |||||
|---|---|---|---|---|---|---|---|---|---|---|
| Pop. | % | Pop. | % | Pop. | % | Pop. | % | Pop. | % | |
| Irreligion | 2,559,250 | 52.06% | 1,908,285 | 44.13% | 1,388,300 | 35.88% | 987,990 | 30.42% | 568,170 | 20.94% |
| Christianity |
1,684,870 | 34.27% | 1,930,415 | 44.64% | 2,124,605 | 54.92% | 2,073,095 | 63.84% | 2,048,000 | 75.47% |
| Sikhism |
290,870 | 5.92% | 201,110 | 4.65% | 135,310 | 3.5% | 74,545 | 2.3% | 40,940 | 1.51% |
| Islam |
125,915 | 2.56% | 79,310 | 1.83% | 56,220 | 1.45% | 24,925 | 0.77% | 12,715 | 0.47% |
| Buddhism |
83,860 | 1.71% | 90,620 | 2.1% | 85,540 | 2.21% | 36,430 | 1.12% | 11,190 | 0.41% |
| Hinduism |
81,320 | 1.65% | 45,795 | 1.06% | 31,495 | 0.81% | 18,140 | 0.56% | 8,980 | 0.33% |
| Judaism |
26,850 | 0.55% | 23,130 | 0.53% | 21,230 | 0.55% | 16,565 | 0.51% | 14,685 | 0.54% |
| Indigenous spirituality | 11,570 | 0.24% | 10,295 | 0.24% | — | — | — | — | — | — |
| Other | 51,440 | 1.05% | 35,500 | 0.82% | 26,180 | 0.68% | 15,825 | 0.49% | 5,940 | 0.22% |
| Total responses | 4,915,945 | 98.3% | 4,324,455 | 98.28% | 3,868,875 | 99.01% | 3,247,505 | 98.95% | 2,713,615 | 98.88% |
| Total population | 5,000,879 | 100% | 4,400,057 | 100% | 3,907,738 | 100% | 3,282,061 | 100% | 2,744,467 | 100% |
Migration
Immigration
| Year | Immigrant percentage | Immigrant population | Total population |
|---|---|---|---|
| 1881 | 27.8% | 13,751 | 49,459 |
| 1891 | 42% | 41,210 | 98,173 |
| 1901 | 44.2% | 79,045 | 178,657 |
| 1911 | 59.4% | 233,158 | 392,480 |
| 1921 | 49.7% | 260,536 | 524,582 |
| 1931 | 46% | 319,529 | 694,263 |
| 1941 | 37.3% | 304,729 | 817,861 |
| 1951 | 29.1% | 339,197 | 1,165,210 |
| 1961 | 26% | 423,132 | 1,629,082 |
| 1971 | 22.7% | 496,660 | 2,184,620 |
The 2021 census reported that immigrants (individuals born outside Canada) comprise 1,425,715 persons or 29.0 percent of the total population of British Columbia.[23]
| Country of Birth | 2021[24][23] | 2016[25] | 2011[26][27] | 2006[28][29] | 2001[30][31] | |||||
|---|---|---|---|---|---|---|---|---|---|---|
| Pop. | % | Pop. | % | Pop. | % | Pop. | % | Pop. | % | |
| 217,975 | 15.3% | 199,990 | 15.5% | 167,530 | 14.1% | 145,315 | 13% | 107,450 | 10.6% | |
| 197,115 | 13.8% | 162,645 | 12.6% | 143,340 | 12% | 119,265 | 10.7% | 92,430 | 9.2% | |
| 131,645 | 9.2% | 112,100 | 8.7% | 96,560 | 8.1% | 69,200 | 6.2% | 51,130 | 5.1% | |
| 116,530 | 8.2% | 123,810 | 9.6% | 130,730 | 11% | 137,460 | 12.3% | 141,370 | 14% | |
| 78,855 | 5.5% | 74,210 | 5.7% | 74,635 | 6.3% | 78,060 | 7% | 88,720 | 8.8% | |
| 59,920 | 4.2% | 57,780 | 4.5% | 57,975 | 4.9% | 56,560 | 5.1% | 54,410 | 5.4% | |
| 47,520 | 3.3% | 41,515 | 3.2% | 37,730 | 3.2% | 34,395 | 3.1% | 22,635 | 2.2% | |
| 45,975 | 3.2% | 37,160 | 2.9% | 30,050 | 2.5% | 22,755 | 2% | 18,450 | 1.8% | |
| 40,445 | 2.8% | 38,900 | 3% | 42,045 | 3.5% | 42,195 | 3.8% | 44,940 | 4.5% | |
| 32,390 | 2.3% | 27,875 | 2.2% | 25,845 | 2.2% | 26,375 | 2.4% | 25,675 | 2.5% | |
| Total | 1,425,715 | 100% | 1,292,675 | 100% | 1,191,875 | 100% | 1,119,215 | 100% | 1,009,815 | 100% |
Recent immigration
A large number of immigrants have lived in British Columbia for 30 years or less.[6]
The 2021 Canadian census counted a total of 197,420 people who immigrated to British Columbia between 2016 and 2021.[23]
| Recent immigrants to British Columbia by Country of birth (2016 to 2021)[23] | |||
|---|---|---|---|
| Country of Birth | Population | % recent immigrants | |
| 39,390 | 20% | ||
| 31,445 | 15.9% | ||
| 21,225 | 10.8% | ||
| 8,760 | 4.4% | ||
| 7,670 | 3.9% | ||
| 7,225 | 3.7% | ||
| 5,850 | 3% | ||
| 5,125 | 2.6% | ||
| 4,955 | 2.5% | ||
| 3,280 | 1.7% | ||
| Total | 197,420 | 100% | |
Interprovincial migration

British Columbia has also traditionally been gaining from interprovincial migration. Over the last 50 years, British Columbia had 12 years of negative interprovincial immigration: the lowest in the country. The only time the province significantly lost population to this phenomenon was during the 1990s, when it had a negative interprovincial migration for 5 consecutive years.[32]
| In-migrants | Out-migrants | Net migration | |
|---|---|---|---|
| 2009–10 | |||
| 2010–11 | |||
| 2011–12 | |||
| 2012–13 | |||
| 2013–14 | |||
| 2014–15 | |||
| 2015–16 | |||
| 2016–17 | |||
| 2017–18 | |||
| 2018–19 | |||
| 2019–20 |
Source: Statistics Canada[33]
See also
Notes
- Statistic includes all persons that did not make up part of a visible minority or an Indigenous identity.
- Includes Persian (Farsi) not otherwise specified
- Statistic includes all persons that did not make up part of a visible minority or an aboriginal identity.
References
- "Crude birth rate, age-specific fertility rates and total fertility rate (live births)". Retrieved 8 January 2022.
- "Estimates of the components of natural increase, quarterly". Retrieved 8 January 2022.
- "25_imr.FH10" (PDF). Archived from the original (PDF) on 2006-02-27. Retrieved 2006-06-30.
- "Population Projections, British Columbia and Sub-Provincial - BC Stats". Archived from the original on 2012-06-29. Retrieved 2006-06-30.
- Statistics Canada - Population
- "Census Profile, 2016 Census British Columbia [Province]". Retrieved 25 November 2018.
- "2006 Canadian Census". Statistics Canada. Retrieved September 21, 2014.
- Government of Canada, Statistics Canada (2022-09-08). "Projected population by racialized group, generation status and other selected characteristics (x 1,000)". www12.statcan.gc.ca. Retrieved 2022-10-01.
- Government of Canada, Statistics Canada (2021-10-06). "Projected population by Indigenous identity, age group, sex, area of residence, provinces and territories, and projection scenario, Canada (x 1,000)". www12.statcan.gc.ca. Retrieved 2022-10-01.
- Government of Canada, Statistics Canada (2022-10-26). "Census Profile, 2021 Census of Population". www12.statcan.gc.ca. Retrieved 2023-07-04.
- Government of Canada, Statistics Canada (2022-10-26). "Census Profile, 2021 Census of Population". www12.statcan.gc.ca. Retrieved 2023-07-04.
- Government of Canada, Statistics Canada (2022-08-17). "Census Profile, 2021 Census of Population Profile table British Columbia [Province]". www12.statcan.gc.ca. Retrieved 2022-08-17.
- "Detailed Mother Tongue (148), Single and Multiple Language Responses (3) and Sex (3) for the Population of Canada, Provinces, Territories, Census Metropolitan Areas and Census Agglomerations, 2006 Census – 20% Sample Data". Statistics Canada. 2007.
- "Census Profile, 2016 Census British Columbia [Province]". Statistics Canada. 2019.
- "Census Profile, 2021 Census of Population". Statistics Canada. October 26, 2022. Retrieved November 12, 2022.
- Government of Canada, Statistics Canada (2022-10-26). "Census Profile, 2021 Census of Population". www12.statcan.gc.ca. Retrieved 2023-04-14.
- Government of Canada, Statistics Canada (2015-11-27). "NHS Profile". www12.statcan.gc.ca. Retrieved 2023-04-14.
- Government of Canada, Statistics Canada (2019-07-02). "2001 Community Profiles". www12.statcan.gc.ca. Retrieved 2023-04-14.
- Government of Canada, Statistics Canada (2019-03-29). "Data tables, 1991 Census R9101 - Population by Religion (29), Showing Age Groups (13) Education (20% Data) - Canada, provinces and territories, census divisions and census subdivisions". www12.statcan.gc.ca. Retrieved 2023-04-14.
- Government of Canada, Statistics Canada (2013-04-03). "1981 Census of Canada 20 per cent data base : highlight information on ethnicity, place of birth, citizenship, income, language, immigration, religion, shelter costs". www12.statcan.gc.ca. Retrieved 2023-04-14.
- Government of Canada, Statistics Canada (2013-04-03). "Sixth census of Canada,1921 . Vol. II: Ages, conjugal condition, birthplace, birthplace of parents, year of immigration and naturalization, language spoken, literacy, school attendance, blindness and deaf-mutism". www12.statcan.gc.ca. Retrieved 2023-01-10.
- Government of Canada, Statistics Canada (4 September 2022). "1971 Census of Canada : population : vol. I – part 3 = Recensement du Canada 1971 : population : vol. I – partie 3. Birthplace. TABLE 42. Population Bom Outside Canada, Showing Numerical and Percentage Distribution, for Canada and Provinces, 1921-1971". www12.statcan.gc.ca. Retrieved 2023-01-10.
- Government of Canada, Statistics Canada (2022-10-26). "Census Profile, 2021 Census of Population". www12.statcan.gc.ca. Retrieved 2022-12-04.
- Government of Canada, Statistics Canada (2023-06-21). "Place of birth and period of immigration by gender and age: Province or territory". www12.statcan.gc.ca. Retrieved 2023-10-15.
- Government of Canada, Statistics Canada (2019-06-17). "Data tables, 2016 Census Immigrant Status and Period of Immigration (11), Place of Birth (272), Age (7A) and Sex (3) for the Population in Private Households of Canada, Provinces and Territories, Census Divisions and Census Subdivisions, 2016 Census - 25% Sample Data". www12.statcan.gc.ca. Retrieved 2023-03-04.
- Government of Canada, Statistics Canada (2019-01-23). "2011 National Household Survey: Data tables Profile - Immigration and Ethnocultural Diversity, and Aboriginal Peoples for Canada, Provinces, Territories, Census Divisions and Census Subdivisions, National Household Survey, 2011". www12.statcan.gc.ca. Retrieved 2023-03-04.
- Government of Canada, Statistics Canada (2015-11-27). "NHS Profile, 2011". www12.statcan.gc.ca. Retrieved 2023-03-04.
- Government of Canada, Statistics Canada (2009-03-23). "Place of birth for the immigrant population by period of immigration, 2006 counts and percentage distribution, for Canada, provinces and territories - 20% sample data". www12.statcan.gc.ca. Retrieved 2023-03-04.
- Government of Canada, Statistics Canada (2020-05-01). "2006 Census Topic-based tabulations Immigrant Status and Period of Immigration (8) and Place of Birth (261) for the Immigrants and Non-permanent Residents of Canada, Provinces, Territories, Census Metropolitan Areas and Census Agglomerations, 2006 Census - 20% Sample Data". www12.statcan.gc.ca. Retrieved 2023-03-04.
- Government of Canada, Statistics Canada (2013-12-23). "2001 Census Topic-based tabulations Immigrant Status and Period of Immigration (10A) and Place of Birth of Respondent (260) for Immigrants and Non-permanent Residents, for Canada, Provinces, Territories, Census Metropolitan Areas and Census Agglomerations, 2001 Census - 20% Sample Data". www12.statcan.gc.ca. Retrieved 2023-03-04.
- Government of Canada, Statistics Canada (2013-12-23). "2001 Census Topic-based tabulations Selected Places of Birth (85) for the Immigrant Population, for Canada, Provinces, Territories, Census Metropolitan Areas and Census Agglomerations, 1996 and 2001 Censuses - 20% Sample Data". www12.statcan.gc.ca. Retrieved 2023-03-04.
- "Interprovincial Migration in Canada: Quebeckers Vote with Their Feet" (PDF). www.fraserinstitute.org. Retrieved 2018-12-26.
- Statistics Canada, table 051-0012: Interprovincial migrants, by age group and sex, Canada, provinces and territories, annual.