Schattendorf
Schattendorf (Croatian: Šundrof, Hungarian: Somfalva) is a town in the district of Mattersburg in the Austrian state of Burgenland.
Schattendorf | |
|---|---|
.jpg.webp) Schattendorf | |
 Coat of arms | |
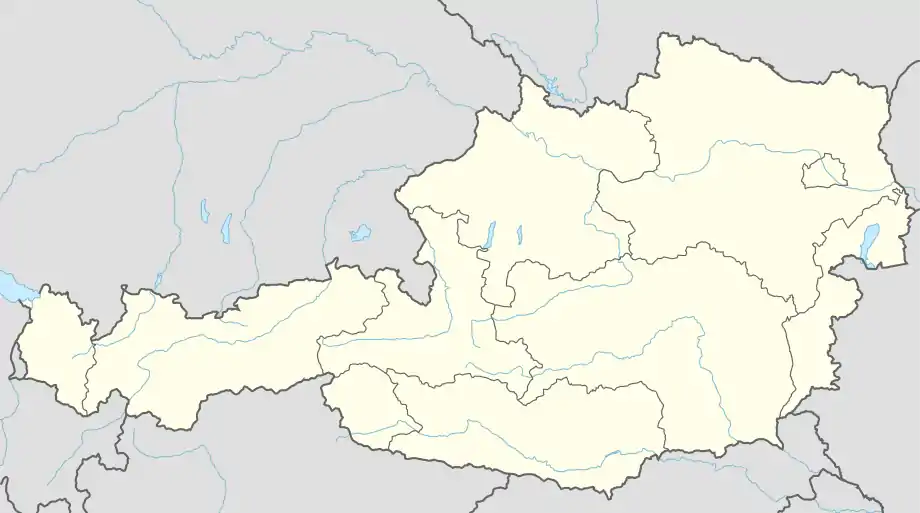
 Schattendorf Location within Austria | |
| Coordinates: 47°43′N 16°31′E | |
| Country | Austria |
| State | Burgenland |
| District | Mattersburg |
| Government | |
| • Mayor | Johann Lotter (SPÖ) |
| Area | |
| • Total | 12.12 km2 (4.68 sq mi) |
| Elevation | 256 m (840 ft) |
| Population (2018-01-01)[2] | |
| • Total | 2,379 |
| • Density | 200/km2 (510/sq mi) |
| Time zone | UTC+1 (CET) |
| • Summer (DST) | UTC+2 (CEST) |
| Postal code | 7022 |
| Website | www.schattendorf.at |
The Rosalia-Kogelberg nature preserve lies within the district.
History
This district was a part of the pre-Christian Celtic Kingdom Noricum and was in the vicinity of the settlement Hoehensiedlung Burg on the Burgberg, a 600 meter tall mountain in Austria. Later, in the Roman Empire, the area was part of the province Pannonia. The town, along with the entire Burgenland, belonged to Hungary (German West Hungary) until 1920/21. Since 1898, the Hungarian name for the town, Somfalva, was used as a result of the Magyarization policies of the government in Budapest. After the end of the World War I, German West Hungary was awarded to Austria after tough negotiations. In 1921, the town became part of the newly founded federal state Burgenland
On 30 January 1927 a small number of armed members of the right-wing Frontkämpfervereinigung were involved in a confrontation with a much larger group of unarmed members of the left-wing Republikanischer Schutzbund. The Frontkämpfervereinigung activists opened fire and killed an adult and a six-year-old boy. When they were found not guilty on grounds of self-defence by a jury, the socialists organised a general strike which led to the July Revolt of 1927.
Population
| Year | Pop. | ±% |
|---|---|---|
| 1869 | 1,503 | — |
| 1880 | 1,712 | +13.9% |
| 1890 | 1,610 | −6.0% |
| 1900 | 1,902 | +18.1% |
| 1910 | 2,159 | +13.5% |
| 1923 | 2,173 | +0.6% |
| 1934 | 2,555 | +17.6% |
| 1939 | 2,568 | +0.5% |
| 1951 | 2,541 | −1.1% |
| 1961 | 2,527 | −0.6% |
| 1971 | 2,590 | +2.5% |
| 1981 | 2,539 | −2.0% |
| 1991 | 2,509 | −1.2% |
| 2001 | 2,465 | −1.8% |
| 2011 | 2,400 | −2.6% |
References
- "Dauersiedlungsraum der Gemeinden Politischen Bezirke und Bundesländer - Gebietsstand 1.1.2018". Statistics Austria. Retrieved 10 March 2019.
- "Einwohnerzahl 1.1.2018 nach Gemeinden mit Status, Gebietsstand 1.1.2018". Statistics Austria. Retrieved 9 March 2019.