Smyth County, Virginia
Smyth County is a county located in the U.S. state of Virginia. As of the 2020 census, the population was 29,800.[1] Its county seat is Marion.[2]
Smyth County | |
|---|---|
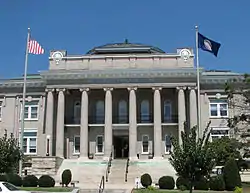
 Smyth County Courthouse in Marion | |
 Flag  Seal | |
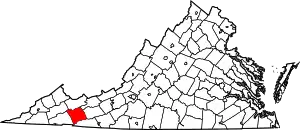
 Location within the U.S. state of Virginia | |
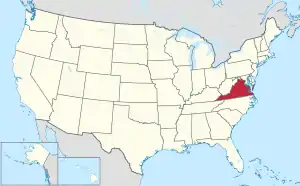
 Virginia's location within the U.S. | |
| Coordinates: 36°50′N 81°32′W | |
| Country | |
| State | |
| Founded | 1832 |
| Named for | Alexander Smyth |
| Seat | Marion |
| Largest town | Marion |
| Area | |
| • Total | 452 sq mi (1,170 km2) |
| • Land | 451 sq mi (1,170 km2) |
| • Water | 1.4 sq mi (4 km2) 0.3% |
| Population (2020) | |
| • Total | 29,800 |
| • Density | 66/sq mi (25/km2) |
| Congressional district | 9th |
| Website | www |
History
Smyth County was formed on February 23, 1832, from Washington and Wythe counties. The county is named after Alexander Smyth, a general during the War of 1812 who was elected to the state Senate, House of Delegates, and as a Representative to the United States Congress.
Geography
According to the U.S. Census Bureau, the county has a total area of 452 square miles (1,170 km2), of which 451 square miles (1,170 km2) is land and 1.4 square miles (3.6 km2) (0.3%) is water.[3]
Adjacent counties
- Russell County – northwest
- Tazewell County – north
- Bland County – northeast
- Wythe County – east
- Grayson County – south
- Washington County – southwest
National protected areas
Demographics
| Census | Pop. | Note | %± |
|---|---|---|---|
| 1840 | 6,522 | — | |
| 1850 | 8,162 | 25.1% | |
| 1860 | 8,952 | 9.7% | |
| 1870 | 8,898 | −0.6% | |
| 1880 | 12,160 | 36.7% | |
| 1890 | 13,360 | 9.9% | |
| 1900 | 17,121 | 28.2% | |
| 1910 | 20,326 | 18.7% | |
| 1920 | 22,125 | 8.9% | |
| 1930 | 25,125 | 13.6% | |
| 1940 | 28,861 | 14.9% | |
| 1950 | 30,187 | 4.6% | |
| 1960 | 31,066 | 2.9% | |
| 1970 | 31,349 | 0.9% | |
| 1980 | 33,366 | 6.4% | |
| 1990 | 32,370 | −3.0% | |
| 2000 | 33,081 | 2.2% | |
| 2010 | 32,208 | −2.6% | |
| 2020 | 29,800 | −7.5% | |
| U.S. Decennial Census[4] 1790–1960[5] 1900–1990[6] 1990–2000[7] 2010[8] 2020[9] | |||
2020 census
| Race / Ethnicity | Pop 2010[8] | Pop 2020[9] | % 2010 | % 2020 |
|---|---|---|---|---|
| White alone (NH) | 30,642 | 27,762 | 95.14% | 93.16% |
| Black or African American alone (NH) | 630 | 408 | 1.96% | 1.37% |
| Native American or Alaska Native alone (NH) | 41 | 36 | 0.13% | 0.12% |
| Asian alone (NH) | 82 | 104 | 0.25% | 0.35% |
| Pacific Islander alone (NH) | 3 | 1 | 0.01% | 0.00% |
| Some Other Race alone (NH) | 18 | 49 | 0.06% | 0.16% |
| Mixed Race/Multi-Racial (NH) | 265 | 882 | 0.82% | 2.96% |
| Hispanic or Latino (any race) | 527 | 558 | 1.64% | 1.87% |
| Total | 32,208 | 29,800 | 100.00% | 100.00% |
Note: the US Census treats Hispanic/Latino as an ethnic category. This table excludes Latinos from the racial categories and assigns them to a separate category. Hispanics/Latinos can be of any race.
2000 Census
As of the census[10] of 2000, there were 33,081 people, 13,493 households, and 9,607 families residing in the county. The population density was 73 inhabitants per square mile (28/km2). There were 15,111 housing units at an average density of 33 units per square mile (13 units/km2). The racial makeup of the county was 96.86% White, 1.87% Black or African American, 0.15% Native American, 0.18% Asian, 0.32% from other races, and 0.60% from two or more races. 0.86% of the population were Hispanic or Latino of any race.
There were 13,493 households, out of which 29.20% had children under the age of 18 living with them, 55.70% were married couples living together, 11.20% had a female householder with no husband present, and 28.80% were non-families. 26.00% of all households were made up of individuals, and 12.50% had someone living alone who was 65 years of age or older. The average household size was 2.37 and the average family size was 2.83.
In the county, the population was spread out, with 21.60% under the age of 18, 8.00% from 18 to 24, 28.10% from 25 to 44, 26.00% from 45 to 64, and 16.30% who were 65 years of age or older. The median age was 40 years. For every 100 females there were 93.80 males. For every 100 females age 18 and over, there were 90.50 males.
The median income for a household in the county was $30,083, and the median income for a family was $36,392. Males had a median income of $26,698 versus $19,712 for females. The per capita income for the county was $16,105. About 9.90% of families and 13.30% of the population were below the poverty line, including 15.20% of those under age 18 and 14.00% of those age 65 or over.
Tourism
The Smyth County Tourism Association was formed in April 2006 to promote sustainable tourism development and manages the operation of the state-certified H.L. Bonham Regional Development and Tourism Center. The organization markets the area through https://visitsmythcountyva.com/
Education
Communities
Towns
- Chilhowie
- Marion
- Saltville (partly in Washington County)
Census-designated places
Other unincorporated communities
Politics
| Year | Republican | Democratic | Third party | |||
|---|---|---|---|---|---|---|
| No. | % | No. | % | No. | % | |
| 2020 | 10,963 | 77.55% | 3,008 | 21.28% | 165 | 1.17% |
| 2016 | 9,750 | 75.64% | 2,665 | 20.67% | 475 | 3.69% |
| 2012 | 8,379 | 65.58% | 4,171 | 32.64% | 227 | 1.78% |
| 2008 | 7,817 | 63.54% | 4,239 | 34.46% | 246 | 2.00% |
| 2004 | 7,906 | 64.18% | 4,143 | 33.63% | 270 | 2.19% |
| 2000 | 6,580 | 56.05% | 4,836 | 41.19% | 324 | 2.76% |
| 1996 | 4,966 | 42.74% | 4,990 | 42.95% | 1,663 | 14.31% |
| 1992 | 6,128 | 47.39% | 4,924 | 38.08% | 1,879 | 14.53% |
| 1988 | 7,446 | 63.49% | 3,989 | 34.02% | 292 | 2.49% |
| 1984 | 8,593 | 67.08% | 4,102 | 32.02% | 116 | 0.91% |
| 1980 | 6,033 | 50.86% | 5,335 | 44.98% | 493 | 4.16% |
| 1976 | 5,032 | 47.29% | 5,246 | 49.30% | 363 | 3.41% |
| 1972 | 6,409 | 72.27% | 2,280 | 25.71% | 179 | 2.02% |
| 1968 | 5,297 | 54.32% | 2,631 | 26.98% | 1,823 | 18.70% |
| 1964 | 3,830 | 48.16% | 4,113 | 51.72% | 9 | 0.11% |
| 1960 | 4,256 | 59.62% | 2,864 | 40.12% | 18 | 0.25% |
| 1956 | 4,771 | 66.23% | 2,374 | 32.95% | 59 | 0.82% |
| 1952 | 3,694 | 64.98% | 1,972 | 34.69% | 19 | 0.33% |
| 1948 | 2,897 | 60.08% | 1,750 | 36.29% | 175 | 3.63% |
| 1944 | 2,726 | 54.53% | 2,266 | 45.33% | 7 | 0.14% |
| 1940 | 2,134 | 46.70% | 2,420 | 52.95% | 16 | 0.35% |
| 1936 | 2,067 | 46.75% | 2,337 | 52.86% | 17 | 0.38% |
| 1932 | 1,843 | 43.92% | 2,287 | 54.50% | 66 | 1.57% |
| 1928 | 2,751 | 58.68% | 1,937 | 41.32% | 0 | 0.00% |
| 1924 | 2,232 | 53.50% | 1,907 | 45.71% | 33 | 0.79% |
| 1920 | 1,883 | 55.16% | 1,516 | 44.41% | 15 | 0.44% |
| 1916 | 1,321 | 53.63% | 1,134 | 46.04% | 8 | 0.32% |
| 1912 | 609 | 27.46% | 1,022 | 46.08% | 587 | 26.47% |
References
- "Smyth County, Virginia". United States Census Bureau. Retrieved January 30, 2022.
- "Find a County". National Association of Counties. Retrieved June 7, 2011.
- "US Gazetteer files: 2010, 2000, and 1990". United States Census Bureau. February 12, 2011. Retrieved April 23, 2011.
- "Census of Population and Housing from 1790-2000". US Census Bureau. Retrieved January 24, 2022.
- "Historical Census Browser". University of Virginia Library. Retrieved January 5, 2014.
- "Population of Counties by Decennial Census: 1900 to 1990". United States Census Bureau. Retrieved January 5, 2014.
- "Census 2000 PHC-T-4. Ranking Tables for Counties: 1990 and 2000" (PDF). United States Census Bureau. Archived (PDF) from the original on October 9, 2022. Retrieved January 5, 2014.
- "P2 HISPANIC OR LATINO, AND NOT HISPANIC OR LATINO BY RACE - 2010: DEC Redistricting Data (PL 94-171) - Smyth County, Virginia". United States Census Bureau.
- "P2 HISPANIC OR LATINO, AND NOT HISPANIC OR LATINO BY RACE - 2020: DEC Redistricting Data (PL 94-171) - Smyth County, Virginia". United States Census Bureau.
- "U.S. Census website". United States Census Bureau. Retrieved May 14, 2011.
- Leip, David. "Dave Leip's Atlas of U.S. Presidential Elections". uselectionatlas.org. Retrieved December 9, 2020.