Spencer County, Kentucky
Spencer County is a county located in the U.S. state of Kentucky. As of the 2020 census, the total population was 19,490.[1] Its county seat is Taylorsville.[2] The county was founded in 1824[3] and named for Spier Spencer.
Spencer County | |
|---|---|
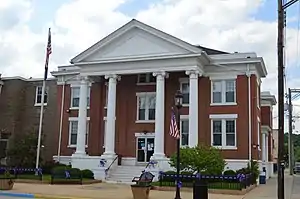
 Spencer County Courthouse in Taylorsville. | |
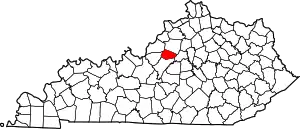
 Location within the U.S. state of Kentucky | |
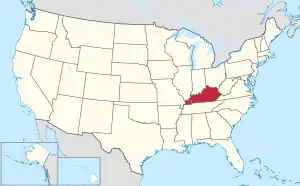
 Kentucky's location within the U.S. | |
| Coordinates: 38°02′N 85°19′W | |
| Country | |
| State | |
| Founded | 1824 |
| Named for | Spier Spencer |
| Seat | Taylorsville |
| Largest city | Taylorsville |
| Area | |
| • Total | 192 sq mi (500 km2) |
| • Land | 187 sq mi (480 km2) |
| • Water | 5.0 sq mi (13 km2) 2.6% |
| Population (2020) | |
| • Total | 19,490 |
| • Estimate (2022) | 20,204 |
| • Density | 100/sq mi (39/km2) |
| Time zone | UTC−5 (Eastern) |
| • Summer (DST) | UTC−4 (EDT) |
| Congressional districts | 2nd, 4th |
| Website | www |
Spencer County is part of the Louisville/Jefferson County, KY—IN Metropolitan Statistical Area.
Taylorsville Lake, located primarily within Spencer County, serves as a major economic resource for the area. Spencer was a dry county until 2009 when the county's residents voted to overturn the ban on alcohol sales. From 2000 to 2005, Spencer County ranked 19th out of all U.S. counties in percent growth, with a 33% increase.
History
Spencer County was formed in January 1824, by the 32nd Kentucky General Assembly. The land that now makes up Spencer County was taken from Bullitt County, Shelby County, and Nelson County. Spencer County became Kentucky's 77th county. The county was named for Kentucky's Captain Spier Spencer, who fought and died in the Battle of Tippecanoe.[4]
Later that year, in December 1824, Taylorsville was made the county seat. In 1829, the city was incorporated.[5]
During the American Civil War, the courthouse at Taylorsville was burned by Confederate guerrillas in January 1865, but the county's records were saved.[6]
Geography
According to the United States Census Bureau, the county has a total area of 192 square miles (500 km2), of which 187 square miles (480 km2) is land and 5.0 square miles (13 km2) (2.6%) is water.[7]
Adjacent counties
- Shelby County (north)
- Anderson County (east)
- Nelson County (south)
- Bullitt County (west)
- Jefferson County (northwest)
Major highways
Demographics
| Census | Pop. | Note | %± |
|---|---|---|---|
| 1830 | 6,812 | — | |
| 1840 | 6,581 | −3.4% | |
| 1850 | 6,842 | 4.0% | |
| 1860 | 6,188 | −9.6% | |
| 1870 | 5,956 | −3.7% | |
| 1880 | 7,040 | 18.2% | |
| 1890 | 6,760 | −4.0% | |
| 1900 | 7,406 | 9.6% | |
| 1910 | 7,567 | 2.2% | |
| 1920 | 7,785 | 2.9% | |
| 1930 | 6,606 | −15.1% | |
| 1940 | 6,757 | 2.3% | |
| 1950 | 6,157 | −8.9% | |
| 1960 | 5,680 | −7.7% | |
| 1970 | 5,488 | −3.4% | |
| 1980 | 5,929 | 8.0% | |
| 1990 | 6,801 | 14.7% | |
| 2000 | 11,766 | 73.0% | |
| 2010 | 17,061 | 45.0% | |
| 2020 | 19,490 | 14.2% | |
| 2022 (est.) | 20,204 | [8] | 3.7% |
| U.S. Decennial Census[9] 1790-1960[10] 1900-1990[11] 1990-2000[12] 2010-2020[1] | |||
As of the census of 2000, there were 11,766 people, 4,251 households, and 3,358 families residing in the county. The population density was 63 per square mile (24/km2). There were 4,555 housing units at an average density of 24 per square mile (9.3/km2). The racial makeup of the county was 97.50% White, 1.13% Black or African American, 0.22% Native American, 0.08% Asian, 0.27% from other races, and 0.79% from two or more races. 1.12% of the population were Hispanic or Latino of any race.
There were 4,251 households, out of which 38.40% had children under the age of 18 living with them, 67.90% were married couples living together, 7.60% had a female householder with no husband present, and 21.00% were non-families. 17.10% of all households were made up of individuals, and 6.00% had someone living alone who was 65 years of age or older. The average household size was 2.74 and the average family size was 3.08.
In the county, the population was spread out, with 27.00% under the age of 18, 7.70% from 18 to 24, 33.50% from 25 to 44, 22.70% from 45 to 64, and 9.10% who were 65 years of age or older. The median age was 35 years. For every 100 females, there were 101.80 males. For every 100 females age 18 and over, there were 99.50 males.
The median income for a household in the county was $47,042, and the median income for a family was $52,038. Males had a median income of $36,638 versus $24,196 for females. The per capita income for the county was $19,848. About 7.70% of families and 8.80% of the population were below the poverty line, including 8.90% of those under age 18 and 10.50% of those age 65 or over.
Education
The Spencer County Public Schools comprises six schools: Spencer County High School, Spencer County Middle School, Spencer County Elementary School, Taylorsville Elementary School, Hillview Academy, and Spencer County Preschool.[13]
Communities
City
- Taylorsville (county seat)
Census-designated place
Other unincorporated places
- Little Mount
- Mount Eden
- Rivals
- Waterford
- Yoder
Politics
| Year | Republican | Democratic | Third party | |||
|---|---|---|---|---|---|---|
| No. | % | No. | % | No. | % | |
| 2020 | 8,737 | 76.42% | 2,530 | 22.13% | 166 | 1.45% |
| 2016 | 7,196 | 75.63% | 1,921 | 20.19% | 398 | 4.18% |
| 2012 | 5,726 | 67.92% | 2,549 | 30.23% | 156 | 1.85% |
| 2008 | 5,378 | 66.82% | 2,519 | 31.30% | 152 | 1.89% |
| 2004 | 4,816 | 70.60% | 1,970 | 28.88% | 36 | 0.53% |
| 2000 | 3,150 | 66.01% | 1,554 | 32.56% | 68 | 1.42% |
| 1996 | 1,614 | 47.92% | 1,404 | 41.69% | 350 | 10.39% |
| 1992 | 1,305 | 41.21% | 1,383 | 43.67% | 479 | 15.12% |
| 1988 | 1,368 | 54.61% | 1,121 | 44.75% | 16 | 0.64% |
| 1984 | 1,456 | 61.38% | 910 | 38.36% | 6 | 0.25% |
| 1980 | 935 | 42.50% | 1,216 | 55.27% | 49 | 2.23% |
| 1976 | 742 | 37.42% | 1,209 | 60.97% | 32 | 1.61% |
| 1972 | 1,120 | 68.75% | 481 | 29.53% | 28 | 1.72% |
| 1968 | 733 | 41.89% | 564 | 32.23% | 453 | 25.89% |
| 1964 | 525 | 26.87% | 1,422 | 72.77% | 7 | 0.36% |
| 1960 | 1,134 | 51.97% | 1,048 | 48.03% | 0 | 0.00% |
| 1956 | 896 | 42.32% | 1,214 | 57.35% | 7 | 0.33% |
| 1952 | 723 | 36.02% | 1,283 | 63.93% | 1 | 0.05% |
| 1948 | 493 | 26.90% | 1,298 | 70.81% | 42 | 2.29% |
| 1944 | 646 | 30.82% | 1,443 | 68.85% | 7 | 0.33% |
| 1940 | 567 | 24.65% | 1,728 | 75.13% | 5 | 0.22% |
| 1936 | 638 | 27.81% | 1,647 | 71.80% | 9 | 0.39% |
| 1932 | 736 | 29.26% | 1,773 | 70.50% | 6 | 0.24% |
| 1928 | 1,565 | 62.20% | 947 | 37.64% | 4 | 0.16% |
| 1924 | 961 | 41.95% | 1,320 | 57.62% | 10 | 0.44% |
| 1920 | 1,102 | 33.88% | 2,135 | 65.63% | 16 | 0.49% |
| 1916 | 591 | 31.62% | 1,271 | 68.00% | 7 | 0.37% |
| 1912 | 271 | 17.10% | 1,052 | 66.37% | 262 | 16.53% |
See also
References
- "State & County QuickFacts". United States Census Bureau. Retrieved October 24, 2022.
- "Find a County". National Association of Counties. Retrieved June 7, 2011.
- E., Kleber, John; Kentucky, University Press of; Policy, Institute for Regional Analysis and Public; Library, Camden-Carroll; University, Morehead State (2000). "The Kentucky Encyclopedia". www.kyenc.org. Retrieved July 6, 2018.
{{cite web}}:|last3=has generic name (help)CS1 maint: multiple names: authors list (link) - The Register of the Kentucky State Historical Society, Volume 1. Kentucky State Historical Society. 1903. p. 37.
- Spencer County History
- KY:Historical Society - Historical Marker Database - Search for Markers
- "2010 Census Gazetteer Files". United States Census Bureau. August 22, 2012. Archived from the original on August 12, 2014. Retrieved August 20, 2014.
- "Annual Estimates of the Resident Population for Counties: April 1, 2020 to July 1, 2022". United States Census Bureau. Retrieved April 2, 2023.
- "U.S. Decennial Census". United States Census Bureau. Retrieved August 20, 2014.
- "Historical Census Browser". University of Virginia Library. Retrieved August 20, 2014.
- "Population of Counties by Decennial Census: 1900 to 1990". United States Census Bureau. Retrieved August 20, 2014.
- "Census 2000 PHC-T-4. Ranking Tables for Counties: 1990 and 2000" (PDF). United States Census Bureau. Archived (PDF) from the original on March 27, 2010. Retrieved August 20, 2014.
- "Our Schools". Spencer County Public Schools. Retrieved August 9, 2015.
- Leip, David. "Dave Leip's Atlas of U.S. Presidential Elections". uselectionatlas.org. Retrieved July 6, 2018.