2004 elections in India
| This article is part of a series on the |
 |
|---|
|
|
General election
| Date | Country | Government before election | Prime Minister before election | Government after election | Prime Minister after election | ||
|---|---|---|---|---|---|---|---|
| 20 April to 10 May 2004 | India | National Democratic Alliance | Atal Bihari Vajpayee | United Progressive Alliance | Manmohan Singh | ||
| Left Front | |||||||
Legislative Assembly elections
Elections to the State Legislative Assemblies were held in six Indian states during 2004. Four (Andhra Pradesh, Karnataka, Orissa and Sikkim) had assembly election simultaneous with the Lok Sabha elections in April–May. In Maharashtra and Arunachal Pradesh elections were held September–October.
Andhra Pradesh
| Party | No. of candidates | No. of elected | No. of votes | % |
|---|---|---|---|---|
| Bharatiya Janata Party | 27 | 2 | 942008 | 2,63% |
| Bahujan Samaj Party | 160 | 1 | 440719 | 1,23% |
| Communist Party of India | 12 | 6 | 545867 | 1.53% |
| Communist Party of India (Marxist) | 14 | 9 | 656721 | 1,84% |
| Indian National Congress | 234 | 185 | 13793461 | 38,56% |
| Telugu Desam Party | 267 | 47 | 13444168 | 37,59% |
| Communist Party of India (Marxist-Leninist) Liberation | 11 | 0 | 66997 | 0,19% |
| Janata Dal (Secular) | 5 | 0 | 3864 | 0,01% |
| Indian Union Muslim League | 2 | 0 | 5371 | 0,02% |
| Rashtriya Janata Dal | 8 | 0 | 2725 | 0,01% |
| Samajwadi Party | 19 | 1 | 95416 | 0,27% |
| Akhil Bharatiya Jan Sangh | 4 | 0 | 3792 | 0,01% |
| All India Majlis-e-Ittehadul Muslimeen | 7 | 4 | 375165 | 1,05% |
| Ambedkar National Congress | 5 | 0 | 6573 | 0,02% |
| Backward Castes United Front | 7 | 0 | 3652 | 0,01% |
| Bahujan Republican Party | 9 | 0 | 10576 | 0,03% |
| Bharatiya Rashtravadi Paksha | 1 | 0 | 542 | 0,00% |
| Bahujan Samaj Party (Ambedkar) | 1 | 0 | 2339 | 0,01% |
| Indian Justice Party | 2 | 0 | 1361 | 0,00% |
| Janata Party | 37 | 2 | 306347 | 0,86% |
| Lok Janshakti Party | 4 | 0 | 21550 | 0,06% |
| Majlis Bachao Tahreek | 7 | 0 | 70285 | 0,20% |
| Marxist Communist Party of India | 16 | 0 | 23373 | 0,06% |
| Mudiraj Rashtriya Samithi | 5 | 0 | 10606 | 0,03% |
| NTR Telugu Desam Party (Lakshmi Parvathi) | 18 | 0 | 7857 | 0,02% |
| Praja Party | 8 | 0 | 4439 | 0,01% |
| Pyramid Party of India | 65 | 0 | 115187 | 0,32% |
| Peoples Republican Party | 1 | 0 | 1515 | 0,00% |
| Rashtriya Praja Congress (Secular) | 1 | 0 | 1037 | 0,00% |
| Republican Party of India | 3 | 0 | 1523 | 0,00% |
| Republican Party of India (Athvale) | 1 | 0 | 956 | 0,00% |
| Republican Party of India (Khobragade) | 5 | 0 | 6031 | 0,02% |
| Samajwadi Janata Party (Rashtriya) | 1 | 0 | 1991 | 0,01% |
| Telangana Congress Party | 1 | 0 | 52161 | 0,15% |
| Telangana Praja Party | 2 | 0 | 1083 | 0,00% |
| Bharat Rashtra Samithi | 54 | 26 | 2390940 | 6,68% |
| Independents | 872 | 11 | 2349436 | 6,57% |
| Total: | 1896 | 294 | 35767634 |
The elected independents include one member of the Communist Party of India (Marxist-Leninist) New Democracy.
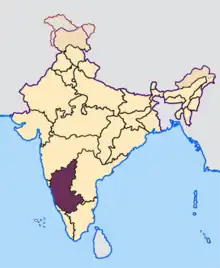
Karnataka
| Party | No. of candidates | No. of elected | No. of votes | % |
|---|---|---|---|---|
| Bharatiya Janata Party | 198 | 79 | 7118658 | 28,33% |
| Bahujan Samaj Party | 102 | 0 | 437564 | 1,74% |
| Communist Party of India | 5 | 0 | 26223 | 0,10% |
| Communist Party of India (Marxist) | 5 | 1 | 92081 | 0,37% |
| Indian National Congress | 224 | 65 | 8861959 | 35,27% |
| Janata Dal (Secular) | 220 | 58 | 5220121 | 20,77% |
| Janata Dal (United) | 26 | 5 | 517904 | 2,06% |
| All India Anna Dravida Munnetra Kazhagam | 2 | 0 | 16737 | 0,07% |
| All India Forward Bloc | 1 | 0 | 657 | 0,00% |
| Communist Party of India (Marxist-Leninist) Liberation | 2 | 0 | 2323 | 0,01% |
| Indian Union Muslim League | 6 | 0 | 3698 | 0,01% |
| Shiv Sena | 11 | 0 | 47805 | 0,19% |
| Samajwadi Party | 15 | 0 | 11028 | 0,04% |
| All India Forward Bloc (Subhasist) | 1 | 0 | 1099 | 0,00% |
| Ambedkar National Congress | 2 | 0 | 1155 | 0,00% |
| Bharatiya Praja Paksha | 1 | 0 | 228 | 0,00% |
| Bharatiya Peoples and National Security National Party | 1 | 0 | 189 | 0,00% |
| Indian Christian Secular Party | 1 | 0 | 111 | 0,00% |
| Janata Party | 155 | 0 | 504932 | 2,01% |
| Kannada Chalavali Vatal Paksha | 5 | 1 | 38687 | 0,15% |
| Kannada Nadu Party | 188 | 1 | 330547 | 1,32% |
| Karnataka Rajya Ryota Sangha | 10 | 0 | 52874 | 0,21% |
| Lok Janshakti Party | 4 | 0 | 3775 | 0,02% |
| Manava Party | 1 | 0 | 343 | 0,00% |
| Parcham Party of India | 1 | 0 | 2058 | 0,01% |
| Pyramid Party of India | 3 | 0 | 2866 | 0,01% |
| Republican Party of India | 3 | 1 | 25379 | 0,10% |
| Republican Party of India (Athvale) | 9 | 0 | 8483 | 0,03% |
| Sirpanch Samaj Party | 3 | 0 | 4037 | 0,02% |
| Urs Samyuktha Paksha | 67 | 0 | 66319 | 0,26% |
| Independents | 442 | 13 | 1724480 | 6,57% |
| Total: | 1715 | 224 | 25129066 |
Orissa

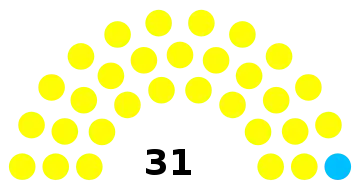
Parliament diagram after the election
Biju Janata Dal
Bharatiya Janata Party
Independents
Communist Party of India (Marxist)
Communist Party of India
Orissa Gana Parishad
Jharkhand Mukti Morcha
Indian National Congress
Source:ECI[1]
| Party | No. of candidates | No. of elected | No. of votes | % |
|---|---|---|---|---|
| Indian National Congress | 133 | 38 | 5896713 | 34,82% |
| Biju Janata Dal | 84 | 61 | 4632280 | 27,36% |
| Bharatiya Janata Party | 63 | 32 | 2898105 | 17,11% |
| Bahujan Samaj Party | 86 | 0 | 326724 | 1,93% |
| Jharkhand Mukti Morcha | 12 | 4 | 301777 | 1,78% |
| Orissa Gana Parishad | 4 | 2 | 217998 | 1,29% |
| Communist Party of India | 6 | 1 | 129989 | 0,77% |
| Samajwadi Party | 29 | 0 | 99214 | 0,59% |
| Communist Party of India (Marxist) | 3 | 1 | 93159 | 0,55% |
| Janata Dal (Secular) | 8 | 0 | 75223 | 0,44% |
| Republican Party of India | 23 | 0 | 47831 | 0,28% |
| Communist Party of India (Marxist-Leninist) Liberation | 8 | 0 | 28531 | 0,17% |
| Samajwadi Jan Parishad | 1 | 0 | 20365 | 0,12% |
| All Jharkhand Students Union | 4 | 0 | 18982 | 0,11% |
| Bharatiya Manavata Vikas Party | 10 | 0 | 12498 | 0,07% |
| Janata Dal (United) | 5 | 0 | 12080 | 0,07% |
| Kosal Party | 4 | 0 | 11062 | 0,07% |
| Shiv Sena | 4 | 0 | 10733 | 0,06% |
| Jharkhand Party | 3 | 0 | 8751 | 0,05% |
| Janata Party | 4 | 0 | 8022 | 0,05% |
| Revolutionary Socialist Party | 2 | 0 | 4469 | 0,03% |
| Rashtriya Janata Dal | 4 | 0 | 2942 | 0,02% |
| Akhil Bharatiya Hindu Mahasabha | 1 | 0 | 2159 | 0,01% |
| Lok Janshakti Party | 1 | 0 | 1621 | 0,01% |
| Indian Justice Party | 1 | 0 | 1563 | 0,01% |
| Jharkhand Disom Party | 1 | 0 | 1489 | 0,01% |
| Proutist Sarva Samaj Party | 1 | 0 | 1443 | 0,01% |
| Sirpanch Samaj Party | 1 | 0 | 1251 | 0,01% |
| All India Forward Bloc | 1 | 0 | 832 | 0,00% |
| Independents | 295 | 8 | 2065650 | 12,20% |
| Total: | 802 | 147 | 16933456 |
Sikkim
 | ||||
| Party | No. of candidates | No. of elected | No. of votes | % |
|---|---|---|---|---|
| Bharatiya Janata Party | 4 | 0 | 667 | 0,34% |
| Communist Party of India (Marxist) | 1 | 0 | 144 | 0,07% |
| Indian National Congress | 28 | 1 | 51329 | 26,13% |
| Sikkim Democratic Front | 32 | 31 | 139662 | 71,09% |
| Sikkim Himali Rajya Parishad | 9 | 0 | 1123 | 0,57% |
| Sikkim Sangram Parishad | 1 | 0 | 90 | 0,05% |
| Independents | 16 | 0 | 3450 | 1,76% |
| Total: | 91 | 32 | 196465 | |
Arunachal Pradesh
| Party | No. of candidates | No. of elected | No. of votes | % |
|---|---|---|---|---|
| Bharatiya Janata Party | 39 | 9 | 87312 | 2.63% |
| Indian National Congress | 60 | 34 | 204102 | 44.41% |
| Nationalist Congress Party | 10 | 2 | 19673 | 4.28% |
| Arunachal Congress | 11 | 2 | 17817 | 3.88% |
| Independents | 48 | 13 | 130654 | 28.43% |
| Total: | 168 | 60 | 459558 |
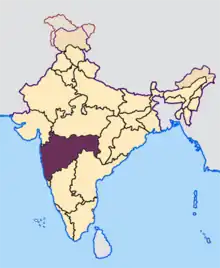
Maharashtra
| Party | No. of candidates | No. of elected | No. of votes | % |
|---|---|---|---|---|
| Bharatiya Janata Party | 111 | 56 | 5717287 | 13,67% |
| Bahujan Samaj Party | 272 | 0 | 1671429 | 4,00% |
| Communist Party of India | 15 | 0 | 59242 | 0,14% |
| Communist Party of India (Marxist) | 16 | 3 | 259567 | 0,62% |
| Indian National Congress | 157 | 69 | 8810363 | 21,06% |
| Nationalist Congress Party | 124 | 71 | 7841962 | 18,75% |
| Shiv Sena | 163 | 62 | 8351654 | 19,97% |
| All India Forward Bloc | 2 | 0 | 2747 | 0,01% |
| Janata Dal (Secular) | 34 | 0 | 242720 | 0,58% |
| Janata Dal (United) | 17 | 0 | 16891 | 0,04% |
| Indian Union Muslim League | 2 | 0 | 342 | 0,00% |
| Rashtriya Lok Dal | 12 | 0 | 9538 | 0,02% |
| Samajwadi Party | 95 | 0 | 471425 | 1,13% |
| Akhil Bharatiya Hindu Mahasabha | 18 | 0 | 14914 | 0,04% |
| Akhil Bharatiya Sena | 20 | 1 | 69986 | 0,17% |
| Apna Dal | 1 | 0 | 1053 | 0,00% |
| All India Forward Bloc (Subhasist) | 1 | 0 | 1113 | 0,00% |
| All India Krantikari Congress | 3 | 0 | 1527 | 0,00% |
| Ambedkarist Republican Party | 21 | 0 | 13282 | 0,03% |
| Bharipa Bahujan Mahasangha | 83 | 1 | 516221 | 1,23% |
| Bharatiya Minorities Suraksha Mahasangh | 1 | 0 | 223 | 0,00% |
| Bahujan Mahasangha Paksha | 6 | 0 | 20478 | 0,05% |
| Bharatiya Rashtriya Swadeshi Congress Paksh | 1 | 0 | 721 | 0,00% |
| Gondvana Gantantra Party | 30 | 0 | 58288 | 0,14% |
| Hindu Ekta Andolan Party | 1 | 0 | 273 | 0,00% |
| Hindustan Janata Party | 2 | 0 | 1832 | 0,00% |
| Indian Justice Party | 9 | 0 | 7153 | 0,02% |
| Indian Union Muslim League (dissident group) | 1 | 0 | 111 | 0,00% |
| Janata Party | 2 | 0 | 1497 | 0,00% |
| Jan Surajya Shakti | 19 | 4 | 368156 | 0,88% |
| Kranti Kari Jai Hind Sena | 14 | 0 | 10683 | 0,01% |
| Lok Janshakti Party | 33 | 0 | 30180 | 0,07% |
| Lok Rajya Party | 9 | 0 | 16738 | 0,04% |
| Maharashtra Rajiv Congress | 2 | 0 | 586 | 0,00% |
| Maharashtra Secular Front | 1 | 0 | 457 | 0,00% |
| National Loktantrik Party | 15 | 0 | 9509 | 0,02% |
| Nag Vidarbha Andolan Samiti | 1 | 0 | 29499 | 0,07% |
| Native People’s Party | 1 | 0 | 315 | 0,00% |
| Peoples Republican Party | 55 | 0 | 73806 | 0,18% |
| Prabuddha Republican Party | 21 | 0 | 12501 | 0,03% |
| Peasants and Workers Party of India | 43 | 2 | 549010 | 1,31% |
| Republican Party of India | 4 | 0 | 62531 | 0,15% |
| Republican Party of India (Athvale) | 20 | 1 | 206175 | 0,49% |
| Republican Party of India (Democratic) | 18 | 0 | 12094 | 0,03% |
| Republican Party of India (Kamble) | 2 | 0 | 866 | 0,00% |
| Rashtriya Samajik Nayak Paksha | 6 | 0 | 10087 | 0,02% |
| Rashtriya Samaj Paksha | 38 | 0 | 144753 | 0,35% |
| Sachet Bharat Party | 1 | 0 | 378 | 0,00% |
| Samajwadi Janata Party(Maharashtra) | 4 | 0 | 25866 | 0,06% |
| Samajwadi Janata Party (Rashtriya) | 1 | 0 | 473 | 0,00% |
| Swatantra Bharat Paksha | 7 | 1 | 176022 | 0,42% |
| Shivrajya Party | 37 | 0 | 28071 | 0,07% |
| Savarn Samaj Party | 1 | 0 | 262 | 0,00% |
| Samajwadi Jan Parishad | 1 | 0 | 545 | 0,00% |
| Vidharbha Janata Congress | 2 | 0 | 7417 | 0,02% |
| Vidharbha Rajya Party | 10 | 0 | 6157 | 0,01% |
| Womanist Party of India | 9 | 0 | 5215 | 0,01% |
| Independents | 1083 | 19 | 5877454 | 14,05% |
| Total: | 2678 | 288 | 41829645 |
References
- "Statistical Report on General Election, 2004 to the Legislative Assembly of Odisha". Election Commission of India. Retrieved 6 February 2022.
External links
Wikimedia Commons has media related to 2004 elections in India.
This article is issued from Wikipedia. The text is licensed under Creative Commons - Attribution - Sharealike. Additional terms may apply for the media files.
.png.webp)


