Table Rock, Nebraska
Table Rock is a village in Pawnee County, Nebraska, United States. The population was 236 at the 2020 census.[3]
Table Rock, Nebraska | |
|---|---|
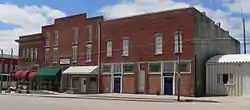
 Downtown Table Rock: Houston Street | |
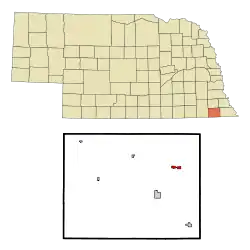
 Location of Table Rock, Nebraska | |
| Coordinates: 40°10′42″N 96°05′19″W | |
| Country | United States |
| State | Nebraska |
| County | Pawnee |
| Area | |
| • Total | 0.59 sq mi (1.52 km2) |
| • Land | 0.59 sq mi (1.52 km2) |
| • Water | 0.00 sq mi (0.00 km2) |
| Elevation | 1,034 ft (315 m) |
| Population | |
| • Total | 233 |
| • Estimate (2021)[3] | 238 |
| • Density | 390/sq mi (150/km2) |
| Time zone | UTC-6 (Central (CST)) |
| • Summer (DST) | UTC-5 (CDT) |
| ZIP code | 68447 |
| Area code | 402 |
| FIPS code | 31-48270[4] |
| GNIS feature ID | 2399947[2] |
History
Table Rock was platted in 1855.[5] It was named from a large rock formation nearby on the Nemaha River which has since been destroyed.[6] It failed to prosper until the Atchison and Nebraska Railroad was built through town in about 1882.[5]
Geography
According to the United States Census Bureau, the village has a total area of 0.59 square miles (1.53 km2), all land.[7]
Climate
According to the Köppen Climate Classification system, Table Rock has a hot-summer humid continental climate, abbreviated "Dfa" on climate maps. The hottest temperature recorded in Table Rock was 106 °F (41.1 °C) on July 26, 2012, while the coldest temperature recorded was −27 °F (−32.8 °C) on February 16–17, 2021.[8]
| Climate data for Table Rock, Nebraska, 1991–2020 normals, extremes 1931–present | |||||||||||||
|---|---|---|---|---|---|---|---|---|---|---|---|---|---|
| Month | Jan | Feb | Mar | Apr | May | Jun | Jul | Aug | Sep | Oct | Nov | Dec | Year |
| Record high °F (°C) | 70 (21) |
79 (26) |
91 (33) |
92 (33) |
98 (37) |
100 (38) |
106 (41) |
103 (39) |
104 (40) |
98 (37) |
84 (29) |
74 (23) |
106 (41) |
| Mean maximum °F (°C) | 60.9 (16.1) |
63.2 (17.3) |
77.2 (25.1) |
86.0 (30.0) |
90.7 (32.6) |
94.7 (34.8) |
99.3 (37.4) |
98.5 (36.9) |
94.2 (34.6) |
87.3 (30.7) |
75.0 (23.9) |
61.9 (16.6) |
100.8 (38.2) |
| Average high °F (°C) | 35.4 (1.9) |
40.7 (4.8) |
53.0 (11.7) |
63.8 (17.7) |
74.0 (23.3) |
83.7 (28.7) |
88.4 (31.3) |
86.6 (30.3) |
79.5 (26.4) |
67.1 (19.5) |
51.9 (11.1) |
39.4 (4.1) |
63.6 (17.6) |
| Daily mean °F (°C) | 24.9 (−3.9) |
29.4 (−1.4) |
40.6 (4.8) |
51.1 (10.6) |
62.0 (16.7) |
72.2 (22.3) |
76.7 (24.8) |
74.5 (23.6) |
66.3 (19.1) |
53.8 (12.1) |
40.3 (4.6) |
29.1 (−1.6) |
51.7 (11.0) |
| Average low °F (°C) | 14.4 (−9.8) |
18.1 (−7.7) |
28.1 (−2.2) |
38.3 (3.5) |
50.0 (10.0) |
60.7 (15.9) |
65.0 (18.3) |
62.5 (16.9) |
53.1 (11.7) |
40.5 (4.7) |
28.6 (−1.9) |
18.8 (−7.3) |
39.8 (4.3) |
| Mean minimum °F (°C) | −7.5 (−21.9) |
−3.0 (−19.4) |
9.3 (−12.6) |
22.9 (−5.1) |
36.1 (2.3) |
49.2 (9.6) |
54.8 (12.7) |
51.2 (10.7) |
38.3 (3.5) |
24.5 (−4.2) |
12.8 (−10.7) |
−0.9 (−18.3) |
−10.6 (−23.7) |
| Record low °F (°C) | −17 (−27) |
−27 (−33) |
−8 (−22) |
12 (−11) |
27 (−3) |
38 (3) |
46 (8) |
43 (6) |
31 (−1) |
14 (−10) |
3 (−16) |
−15 (−26) |
−27 (−33) |
| Average precipitation inches (mm) | 0.78 (20) |
1.14 (29) |
2.18 (55) |
3.24 (82) |
5.01 (127) |
4.68 (119) |
4.56 (116) |
3.80 (97) |
3.13 (80) |
2.60 (66) |
1.69 (43) |
1.28 (33) |
34.09 (867) |
| Average snowfall inches (cm) | 5.6 (14) |
5.5 (14) |
2.6 (6.6) |
0.9 (2.3) |
0.0 (0.0) |
0.0 (0.0) |
0.0 (0.0) |
0.0 (0.0) |
0.0 (0.0) |
0.4 (1.0) |
1.7 (4.3) |
4.7 (12) |
21.4 (54.2) |
| Average precipitation days (≥ 0.01 in) | 4.6 | 5.0 | 7.1 | 9.6 | 10.6 | 9.5 | 9.1 | 8.2 | 7.0 | 7.3 | 5.3 | 4.6 | 87.9 |
| Average snowy days (≥ 0.1 in) | 2.8 | 2.9 | 1.5 | 0.4 | 0.0 | 0.0 | 0.0 | 0.0 | 0.0 | 0.1 | 1.0 | 2.3 | 11.0 |
| Source 1: NOAA[9] | |||||||||||||
| Source 2: National Weather Service[8] | |||||||||||||
Demographics
| Census | Pop. | Note | %± |
|---|---|---|---|
| 1890 | 673 | — | |
| 1900 | 852 | 26.6% | |
| 1910 | 814 | −4.5% | |
| 1920 | 750 | −7.9% | |
| 1930 | 673 | −10.3% | |
| 1940 | 562 | −16.5% | |
| 1950 | 513 | −8.7% | |
| 1960 | 422 | −17.7% | |
| 1970 | 429 | 1.7% | |
| 1980 | 393 | −8.4% | |
| 1990 | 308 | −21.6% | |
| 2000 | 264 | −14.3% | |
| 2010 | 269 | 1.9% | |
| 2020 | 233 | −13.4% | |
| 2021 (est.) | 238 | [3] | 2.1% |
| U.S. Decennial Census[10] | |||
2010 census
As of the census[11] of 2010, there were 269 people, 133 households, and 70 families residing in the village. The population density was 455.9 inhabitants per square mile (176.0/km2). There were 167 housing units at an average density of 283.1 units per square mile (109.3 units/km2). The racial makeup of the village was 97.8% White, 1.5% African American, and 0.7% from two or more races. Hispanic or Latino of any race were 1.9% of the population.
There were 133 households, of which 27.1% had children under the age of 18 living with them, 40.6% were married couples living together, 7.5% had a female householder with no husband present, 4.5% had a male householder with no wife present, and 47.4% were non-families. 46.6% of all households were made up of individuals, and 27.1% had someone living alone who was 65 years of age or older. The average household size was 2.02 and the average family size was 2.83.
The median age in the village was 46.3 years. 23.4% of residents were under the age of 18; 4% were between the ages of 18 and 24; 20.8% were from 25 to 44; 27.1% were from 45 to 64; and 24.5% were 65 years of age or older. The gender makeup of the village was 49.1% male and 50.9% female.
2000 census
As of the census[4] of 2000, there were 264 people, 144 households, and 68 families residing in the village. The population density was 451.2 inhabitants per square mile (174.2/km2). There were 178 housing units at an average density of 304.2 units per square mile (117.5 units/km2). The racial makeup of the village was 99.62% White and 0.38% Asian. Hispanic or Latino of any race were 1.52% of the population.
There were 144 households, out of which 15.3% had children under the age of 18 living with them, 38.9% were married couples living together, 5.6% had a female householder with no husband present, and 52.1% were non-families. 46.5% of all households were made up of individuals, and 25.7% had someone living alone who was 65 years of age or older. The average household size was 1.83 and the average family size was 2.58.
In the village, the population was spread out, with 16.3% under the age of 18, 3.8% from 18 to 24, 19.7% from 25 to 44, 26.9% from 45 to 64, and 33.3% who were 65 years of age or older. The median age was 54 years. For every 100 females, there were 95.6 males. For every 100 females age 18 and over, there were 97.3 males.
As of 2000 the median income for a household in the village was $24,545, and the median income for a family was $33,000. Males had a median income of $28,250 versus $16,500 for females. The per capita income for the village was $18,384. About 11.8% of families and 11.1% of the population were below the poverty line, including 7.7% of those under the age of eighteen and 16.5% of those 65 or over.
Education
Its school district is Humboldt Table Rock Steinauer Public Schools.[12]
Table Rock is part of a school district including Steinauer, Humboldt, Dawson, Stella, and Shubert.
Notable people
- Rufus A. Lyman (1875–1957), leader in US pharmacy education during the first half of the 20th century
- William R. (Link) Lyman (1898–1972), football player in Pro Football Hall of Fame
- Theodore Pepoon (1836–1915), legislator and publisher
- Floyd Vrtiska (1926–2020), farmer and politician
References
- "ArcGIS REST Services Directory". United States Census Bureau. Retrieved September 18, 2022.
- U.S. Geological Survey Geographic Names Information System: Table Rock, Nebraska
- Bureau, US Census. "City and Town Population Totals: 2020—2021". Census.gov. US Census Bureau. Retrieved October 19, 2022.
- "U.S. Census website". United States Census Bureau. Retrieved January 31, 2008.
- "Table Rock, Pawnee County". Center for Advanced Land Management Information Technologies. University of Nebraska. Retrieved August 21, 2014.
- "Table Rock". Pawnee County Promotional Network. Retrieved August 21, 2014.
- "US Gazetteer files 2010". United States Census Bureau. Archived from the original on January 25, 2012. Retrieved June 24, 2012.
- "NOAA Online Weather Data – NWS Omaha". National Weather Service. Retrieved June 16, 2023.
- "U.S. Climate Normals Quick Access – Station: Table Rock 4N, NE". National Oceanic and Atmospheric Administration. Retrieved June 16, 2023.
- "Census of Population and Housing". Census.gov. Retrieved June 4, 2015.
- "U.S. Census website". United States Census Bureau. Retrieved June 24, 2012.
- "2020 CENSUS - SCHOOL DISTRICT REFERENCE MAP: Pawnee County, NE" (PDF). U.S. Census Bureau. Retrieved November 26, 2022. - See text list