Texas's 12th congressional district
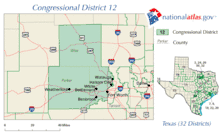
Texas's 12th congressional district in the United States House of Representatives is in the north portion of the state of Texas. As of 2017, the 12th district contained 806,551 people and had a median income of $67,703.[2] It consists of the western half of Tarrant County, as well as most of Parker County. The district also contains Texas Christian University. Fragments of the Dallas–Fort Worth metroplex are included in the district. The district is currently represented by Republican Kay Granger, who was first elected in 1996.
| Texas's 12th congressional district | |||
|---|---|---|---|
.tif.png.webp) Texas's 12th congressional district since January 3, 2023 | |||
| Representative |
| ||
| Distribution |
| ||
| Population (2022) | 803,772[2] | ||
| Median household income | $78,999[2] | ||
| Ethnicity |
| ||
| Cook PVI | R+12[3] | ||
Election results from presidential races
| Year | Office | Result |
|---|---|---|
| 2000 | President | Bush 59 – 40% |
| 2004 | President | Bush 67 – 33% |
| 2008 | President | McCain 63 – 36% |
| 2012 | President | Romney 67 – 32% |
| 2016 | President | Trump 62 – 33% |
| 2020 | President | Trump 60 – 38% |
List of members representing the district
Election results
General election
| Party | Candidate | Votes | % | |
|---|---|---|---|---|
| Republican | Kay Granger (incumbent) | 152,953 | 64.2 | |
| Democratic | Trey Hunt | 85,026 | 35.7 | |
| Total votes | 237,979 | 100.0 | ||
| Republican hold | ||||
| Party | Candidate | Votes | % | |
|---|---|---|---|---|
| Republican | Kay Granger (incumbent) | 233,853 | 63.7 | |
| Democratic | Lisa Welch | 121,250 | 33.0 | |
| Libertarian | Trey Holcomb | 11,918 | 3.3 | |
| Total votes | 367,021 | 100.0 | ||
| Republican hold | ||||
| Party | Candidate | Votes | % | ±% | |
|---|---|---|---|---|---|
| Republican | Kay Granger (incumbent) | 172,557 | 64.27 | -5.13 | |
| Democratic | Vanessa Adia | 90,994 | 33.89 | +7.04 | |
| Libertarian | Jacob Leddy | 4,940 | 1.84 | -1.91 | |
| Total votes | 268,491 | 100 | |||
| Republican hold | |||||
| Party | Candidate | Votes | % | ±% | |
|---|---|---|---|---|---|
| Republican | Kay Granger (incumbent) | 196,482 | 69.4 | -1.91 | |
| Democratic | Bill Bradshaw | 76,029 | 26.85 | +0.54 | |
| Libertarian | Ed Colliver | 10,604 | 3.75 | +1.36 | |
| Total votes | 283,115 | 100 | |||
| Republican hold | |||||
| Party | Candidate | Votes | % | ±% | |
|---|---|---|---|---|---|
| Republican | Kay Granger (Incumbent) | 113,186 | 71.31 | +0.41 | |
| Democratic | Mark Greene | 41,757 | 26.31 | +0.04 | |
| Libertarian | Ed Colliver | 3,787 | 2.39 | -0.02 | |
| Total votes | 158,730 | 100 | |||
| Republican hold | |||||
| Party | Candidate | Votes | % | ±% | |
|---|---|---|---|---|---|
| Republican | Kay Granger (incumbent) | 175,649 | 70.90 | -0.95 | |
| Democratic | Dave Robinson | 66,080 | 26.27 | +1.54 | |
| Libertarian | Matthew Solodow | 5,983 | 2.41 | -0.59 | |
| Majority | 109,569 | 44.23 | -2.49 | ||
| Turnout | 247,712 | +61.99 | |||
| Republican hold | |||||
| Party | Candidate | Votes | % | ±% | |
|---|---|---|---|---|---|
| Republican | Kay Granger (incumbent) | 109,882 | 71.85 | +4.26 | |
| Democratic | Tracey Smith | 38,434 | 25.13 | -5.47 | |
| Libertarian | Matthew Solodow | 4,601 | 3.00 | +1.20 | |
| Majority | 71,448 | 46.72 | +9.73 | ||
| Turnout | 152,917 | -43.10 | |||
| Republican hold | |||||
| Party | Candidate | Votes | % | ±% | |
|---|---|---|---|---|---|
| Republican | Kay Granger (incumbent) | 181,662 | 67.59 | +0.65 | |
| Democratic | Tracey Smith | 82,250 | 30.60 | -0.48 | |
| Libertarian | Shiloh Sidney Shambaugh | 4,842 | 1.80 | -0.16 | |
| Majority | 99,412 | 36.99 | |||
| Turnout | 268,754 | ||||
| Republican hold | |||||
| Party | Candidate | Votes | % | ±% | |
|---|---|---|---|---|---|
| Republican | Kay Granger (incumbent) | 98,371 | 66.94 | +2.88 | |
| Democratic | John R. Morris | 69,148 | 31.08 | -3.40 | |
| Libertarian | Gardner Osborne | 3,251 | 1.96 | +1.96 | |
| Majority | 52,695 | 36.2 | |||
| Turnout | 145,396 | ||||
| Republican hold | |||||
| Party | Candidate | Votes | % | ±% | |
|---|---|---|---|---|---|
| Republican | Kay Granger (incumbent) | 127,870 | 63.76 | ||
| Democratic | Tracey Smith | 69,148 | 34.48 | ||
| Majority | 106,906 | 44.6 | |||
| Turnout | 239,538 | ||||
| Republican hold | |||||
Historical district boundaries

2007–2013
.tif.png.webp)
2013–2023
References
- Martis, Kenneth C. (1989). The Historical Atlas of Political Parties in the United States Congress. New York: Macmillan Publishing Company.
- Martis, Kenneth C. (1982). The Historical Atlas of United States Congressional Districts. New York: Macmillan Publishing Company.
- Congressional Biographical Directory of the United States 1774–present
- "TEXAS CONGRESSIONAL DISTRICTS BY URBAN AND RURAL POPULATION AND LAND AREA". US Census Bureau. Retrieved January 19, 2019.
- Center for New Media & Promotion (CNMP), US Census Bureau. "My Congressional District". www.census.gov. Retrieved January 19, 2019.
- "2022 Cook PVI: District Map and List". Cook Political Report. Retrieved January 10, 2023.
- "Texas Election Results - Official Results". Texas Secretary of State. Retrieved November 26, 2020.
- "Race Summary Report: 2018 General Election". Office of the Secretary of State (Texas). November 6, 2018. Retrieved January 19, 2019.
This article is issued from Wikipedia. The text is licensed under Creative Commons - Attribution - Sharealike. Additional terms may apply for the media files.

.jpg.webp)


