Thyra, New South Wales
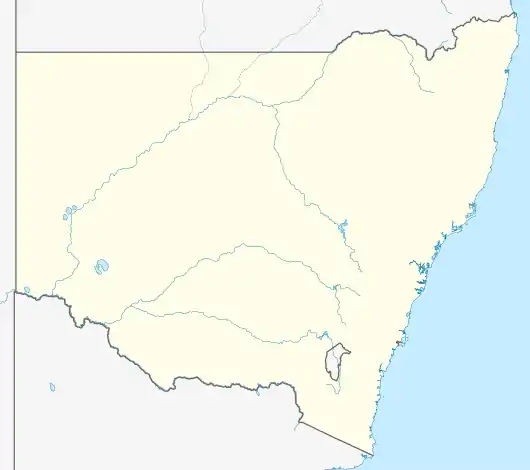
Thyra, New South Wales is a parish and suburb in Cadell County, Southern New South Wales, Australia. It is located 15 km north of Echuca, Victoria at 35°49′54″S 144°41′04″E and is on the Balranald branch line of the Deniliquin railway line and in Murray River Council.
| Thyra New South Wales | |||||||||
|---|---|---|---|---|---|---|---|---|---|
 Thyra | |||||||||
| Coordinates | 35°49′54″S 144°41′04″E | ||||||||
| Population | 650 (2011 census)[1] | ||||||||
| Established | 1860 | ||||||||
| Postcode(s) | 2710 | ||||||||
| Elevation | 105 m (344 ft) | ||||||||
| Location |
| ||||||||
| LGA(s) | Murray River Council | ||||||||
| County | Cadell | ||||||||
| State electorate(s) | Murray | ||||||||
| Federal division(s) | Farrer | ||||||||
| |||||||||
One church building remains the only public building, and the nearest town is Mathoura.
History
Thyra was on the border of the traditional lands of the Yorta Yorta peoples, and their neighbors the Baraba baraba.[2]
The first Europeans to the area were Hamilton Hume and William Hovell, in 1824, and Captain Charles Sturt in 1830. In In 1852 Francis Cadell, began a steam ship service.[3] The nearby Murray river here is still navigable by paddle steamer.
Climate
| Climate data for Mathoura | |||||||||||||
|---|---|---|---|---|---|---|---|---|---|---|---|---|---|
| Month | Jan | Feb | Mar | Apr | May | Jun | Jul | Aug | Sep | Oct | Nov | Dec | Year |
| Record high °C (°F) | 44.7 (112.5) |
44.2 (111.6) |
40.8 (105.4) |
34.9 (94.8) |
27.2 (81.0) |
26.6 (79.9) |
19.4 (66.9) |
23.1 (73.6) |
33.3 (91.9) |
37.8 (100.0) |
41.7 (107.1) |
41.9 (107.4) |
44.7 (112.5) |
| Average high °C (°F) | 31.4 (88.5) |
30.3 (86.5) |
27.5 (81.5) |
22.1 (71.8) |
16.9 (62.4) |
14.1 (57.4) |
12.9 (55.2) |
15.0 (59.0) |
18.1 (64.6) |
21.7 (71.1) |
25.6 (78.1) |
28.6 (83.5) |
22.0 (71.6) |
| Average low °C (°F) | 15.5 (59.9) |
15.2 (59.4) |
13.2 (55.8) |
9.2 (48.6) |
6.1 (43.0) |
4.3 (39.7) |
3.3 (37.9) |
4.2 (39.6) |
5.9 (42.6) |
8.7 (47.7) |
10.7 (51.3) |
13.1 (55.6) |
9.1 (48.4) |
| Record low °C (°F) | 5.6 (42.1) |
5.8 (42.4) |
2.8 (37.0) |
1.3 (34.3) |
−1.1 (30.0) |
−3.3 (26.1) |
−3.8 (25.2) |
−2.6 (27.3) |
−1.4 (29.5) |
−0.7 (30.7) |
0.8 (33.4) |
4.4 (39.9) |
−3.8 (25.2) |
| Average precipitation mm (inches) | 32.3 (1.27) |
23.5 (0.93) |
35.8 (1.41) |
28.0 (1.10) |
40.6 (1.60) |
36.8 (1.45) |
42.6 (1.68) |
43.4 (1.71) |
41.8 (1.65) |
41.6 (1.64) |
34.7 (1.37) |
34.6 (1.36) |
436.3 (17.18) |
| Average precipitation days | 3.8 | 3.6 | 4.3 | 5.3 | 8.0 | 9.0 | 10.5 | 10.6 | 8.9 | 7.7 | 6.1 | 5.2 | 83.0 |
| Source: [4] | |||||||||||||
Agriculture remains the main economic activity and Electorally the parish is in the Division of Farrer.
References
- Australian Bureau of Statistics (31 October 2012). "Mathoura (L) (Urban Centre/Locality)". 2011 Census QuickStats. Retrieved 31 March 2015.
- indigenousmap at www.abc.net.au.
- "Present condition and prospects of south australia". South Australian Register. 14 September 1852. p. 1S. Retrieved 4 November 2010.
- "Climate statistics for". Bureau of Meteorology. Retrieved 20 January 2014.