Timeline of the 2017 Pacific hurricane season
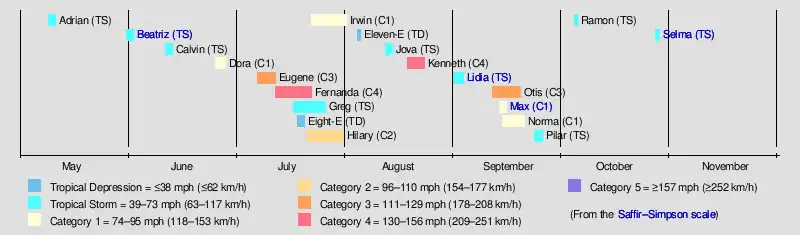
The 2017 Pacific hurricane season was an event in the annual cycle of tropical cyclone formation, in which tropical cyclones form in the eastern Pacific Ocean. The season officially started on May 15 in the eastern Pacific—east of 140°W—and on June 1 in the central Pacific—between the International Date Line and 140°W—and ended on November 30. These dates typically cover the period of each year when most tropical cyclones form in the eastern Pacific basin.[1] However, storm formation is possible at any time of the year, as illustrated in 2017 by the formation of the season's first named storm, Tropical Storm Adrian, on May 10. At the time, this was the earliest formation of a tropical storm on record in the basin.[2]
| Timeline of the 2017 Pacific hurricane season | |||||
|---|---|---|---|---|---|
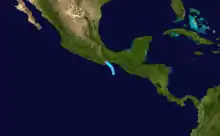
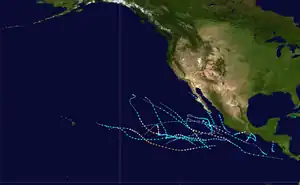 Season summary map | |||||
| Season boundaries | |||||
| First system formed | May 9, 2017 | ||||
| Last system dissipated | October 28, 2017 | ||||
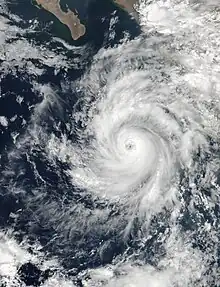
| Strongest system | |||||
| Name | Fernanda | ||||
| Maximum winds | 145 mph (230 km/h) (1-minute sustained) | ||||
| Lowest pressure | 948 mbar (hPa; 27.99 inHg) | ||||
| Longest lasting system | |||||
| Name | Fernanda, Hilary and Irwin | ||||
| Duration | 10.50 days | ||||
| |||||
Four time zones are utilized in the basin: Central for storms east of 106°W, Mountain between 114.9°W and 106°W, Pacific between 140°W and 115°W,[3] and Hawaii–Aleutian for storms between the International Date Line and 140°W. However, for convenience, all information is listed by Coordinated Universal Time (UTC) first with the respective local time included in parentheses. This timeline includes information that was not operationally released, meaning that data from post-storm reviews by the National Hurricane Center is included. This timeline documents tropical cyclone formations, strengthening, weakening, landfalls, extratropical transitions, and dissipations during the season.
Timeline
May
May 9
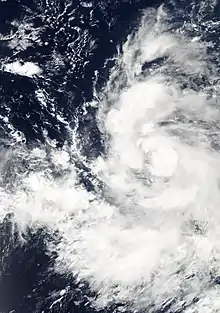
- 18:00 UTC (1:00 p.m. CDT) at 9.3°N 91.2°W – Tropical Depression One-E develops from an area of low pressure about 315 miles (510 km) south-southwest of the El Salvador–Guatemala border.[2]
May 10
- 00:00 UTC (7:00 p.m. CDT May 9) at 9.5°N 91.7°W – Tropical Depression One-E intensifies into Tropical Storm Adrian.[2]
- 06:00 UTC (1:00 a.m. CDT) at 9.7°N 92.0°W – Tropical Storm Adrian reaches peak intensity with winds of 45 mph (70 km/h) and a minimum pressure of 1004 mbar (hPa; 29.65 inHg).[2]
May 11
- 00:00 UTC (7:00 p.m. CDT May 10) at 10.5°N 92.9°W – Tropical Storm Adrian degenerates to a post-tropical cyclone around 280 miles (455 km) south of the Guatemala–Mexico border.[2]
May 15
- The 2017 Eastern Pacific hurricane season officially begins.[1]
May 31
- 12:00 UTC (7:00 a.m. CDT) at 13.8°N 97.9°W – Tropical Depression Two-E develops from an area of low pressure about 175 miles (280 km) southwest of Puerto Ángel, Mexico.[4]
June
June 1
- The 2017 Central Pacific hurricane season officially begins.[1]
- 06:00 UTC (1:00 a.m. CDT) at 14.5°N 97.3°W – Tropical Depression Two-E intensifies into Tropical Storm Beatriz roughly 105 miles (165 km) southwest of Puerto Ángel, Mexico.[4]
- 12:00 UTC (7:00 a.m. CDT) at 14.8°N 97.1°W – Tropical Storm Beatriz reaches peak intensity with winds of 45 mph (70 km/h) and a minimum pressure of 1001 mbar (hPa; 29.56 inHg).[4]
June 2
- 00:00 UTC (7:00 p.m. CDT June 1) at 15.7°N 96.6°W – Tropical Storm Beatriz makes landfall 25 miles (35 km) west of Puerto Ángel, Mexico while still at peak intensity.[4]
- 06:00 UTC (1:00 a.m. CDT) at 16.3°N 96.3°W – Tropical Storm Beatriz weakens to a tropical depression over southern Mexico.[4]
June 11
- 12:00 UTC (7:00 p.m. CDT) at 14.0°N 94.7°W – Tropical Depression Three-E develops from an area of low pressure about 150 miles (240 km) south-southeast of Salina Cruz, Mexico.[5]
June 12
- 18:00 UTC (1:00 p.m. CDT) at 15.6°N 95.4°W – Tropical Depression Three-E intensifies into Tropical Storm Calvin about 45 miles (75 km) south-southwest of Salina Cruz, Mexico.[5]
June 13
- 00:00 UTC (7:00 p.m. CDT June 12) at 15.9°N 95.7°W – Tropical Storm Calvin reaches peak intensity with winds of 45 mph (70 km/h) and a minimum pressure of 1004 mbar (hPa; 29.65 inHg), and simultaneously makes landfall near Paja Blanca, Mexico.[5]
- 06:00 UTC (1:00 a.m. CDT) at 16.2°N 96.1°W – Tropical Storm Calvin weakens to a tropical depression as it pushes inland.[5]
June 24
- 18:00 UTC (1:00 p.m. CDT) at 13.6°N 98.7°W – Tropical Depression Four-E develops from an area of low pressure about 230 miles (370 km) south-southeast of Acapulco, Mexico.[6]
June 25
- 06:00 UTC (1:00 a.m. CDT June 25) at 14.4°N 100.4°W – Tropical Depression Four-E intensifies into Tropical Storm Dora.[6]
June 26
- 06:00 UTC (1:00 a.m. CDT) at 16.6°N 104.8°W – Tropical Storm Dora intensifies into a Category 1 hurricane about 175 miles (280 km) south of Manzanillo, Mexico.[6]
- 12:00 UTC (7:00 a.m. CDT) at 17.1°N 105.8°W – Hurricane Dora intensifies into a Category 2 hurricane.[6]
- 18:00 UTC (12:00 p.m. MDT) at 17.6°N 106.8°W – Hurricane Dora attains its peak intensity with maximum sustained winds of 105 mph (170 km/h) and a minimum barometric pressure of 974 mbar (hPa; 28.76 inHg).[6]
June 27
- 06:00 UTC (12:00 a.m. MDT) at 18.6°N 108.7°W – Hurricane Dora weakens into a Category 1 hurricane.[6]
- 18:00 UTC (12:00 p.m. MDT) at 19.3°N 110.7°W – Hurricane Dora weakens further into a tropical storm.[6]
June 28
- 06:00 UTC (12:00 a.m. MDT) at 19.7°N 112.6°W – Tropical Storm Dora degenerates into a post-tropical cyclone about 275 miles (445 km) southwest of the southern tip of the Baja California peninsula.[6]
July
July 7
- 12:00 UTC (6:00 a.m. MDT) at 11.2°N 110.0°W – Tropical Depression Five-E develops from an area of low pressure about 765 miles (1230 km) south of the southern tip of Baja California.[7]
- 18:00 UTC (12:00 p.m. MDT) at 11.6°N 110.8°W – Tropical Depression Five-E intensifies into Tropical Storm Eugene.[7]
July 9
- 00:00 UTC (6:00 p.m. MDT July 8) at 14.1°N 113.4°W – Tropical Storm Eugene intensifies into a Category 1 hurricane roughly 630 miles (1020 km) south-southwest of the southern tip of Baja California.[7]
- 06:00 UTC (12:00 a.m. MDT July 8) at 15.2°N 114.1°W – Hurricane Eugene rapidly intensifies into a Category 2 hurricane approximately 600 miles (960 km) south-southwest of the southern tip of the Baja California Peninsula.[7]
- 12:00 UTC (6:00 a.m. MDT) at 16.3°N 115.0°W – Hurricane Eugene rapidly intensifies into a Category 3 hurricane and simultaneously attains its peak intensity with maximum sustained winds of 115 mph (185 km/h) and a minimum barometric pressure of 966 mbar (hPa; 28.53 inHg) about 565 miles (910 km) southwest of the southern tip of the Baja California Peninsula.[7]
July 10
- 00:00 UTC (5:00 p.m. PDT July 9) at 17.1°N 115.6°W – Hurricane Eugene weakens to a Category 2 hurricane roughly 535 miles (860 km) southwest of the southern tip of the Baja California Peninsula.[7]
- 12:00 UTC (5:00 a.m. PDT) at 18.3°N 116.9°W – Hurricane Eugene weakens to a Category 1 hurricane approximately 640 miles (1,035 km) south-southwest of Punta Eugenia, Mexico.[7]
July 11
- 00:00 UTC (5:00 p.m. PDT July 10) at 19.6°N 118.0°W – Hurricane Eugene weakens to a tropical storm about 560 miles (900 km) south-southwest of Punta Eugenia, Mexico.[7]
- 18:00 UTC (12:00 p.m. MDT) at 12.2°N 108.4°W – Tropical Depression Six-E develops from an area of low pressure about 740 miles (1,190 km) south of the southern tip of the Baja California Peninsula.[8]
July 12
- 12:00 UTC (5:00 a.m. PDT) at 23.2°N 121.5°W – Tropical Storm Eugene weakens to a tropical depression roughly 510 miles (815 km) west-southwest of Punta Eugenia, Mexico.[7]
- 12:00 UTC (6:00 a.m. MDT) at 11.9°N 111.8°W – Tropical Depression Six-E intensifies into Tropical Storm Fernanda about 760 miles (1,225 km) south of the southern tip of the Baja California Peninsula.[8]
- 18:00 UTC (11:00 a.m. PDT) at 23.7°N 122.2°W – Tropical Depression Eugene degenerates to a remnant low approximately 525 miles (845 km) west-southwest of Punta Eugenia, Mexico.[7]
July 13
- 18:00 UTC (11:00 a.m. PDT) at 11.3°N 115.5°W – Tropical Storm Fernanda intensifies into a Category 1 hurricane about 900 miles (1,450 km) south-southwest of the southern tip of the Baja California Peninsula.[8]
July 14
- 06:00 UTC (11:00 p.m. PDT July 13) at 11.0°N 117.4°W – Hurricane Fernanda intensifies into a Category 2 hurricane roughly 975 miles (1,570 km) southwest of the southern tip of the Baja California Peninsula.[8]
- 18:00 UTC (11:00 a.m. PDT) at 10.7°N 119.3°W – Hurricane Fernanda intensifies into a Category 3 hurricane approximately 1,020 miles (1,640 km) southwest of the southern tip of the Baja California Peninsula.[8]
July 15
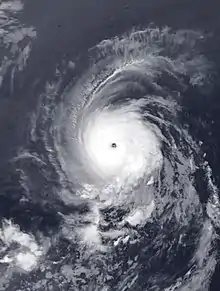
- 00:00 UTC (5:00 p.m. PDT July 14) at 10.7°N 120.3°W – Hurricane Fernanda intensifies into a Category 4 hurricane and simultaneously reaches its peak intensity of 145 mph (230 km/h) and a minimum barometric pressure of 948 mbar (hPa; 27.99 inHg), the second strongest hurricane so far south in the eastern Pacific, about 1,060 miles (1,710 km) southwest of the southern tip of the Baja California Peninsula.[8][9]
July 17
- 00:00 UTC (5:00 p.m. PDT July 16) at 12.8°N 128.8°W – Hurricane Fernanda weakens to a Category 3 hurricane about 1545 miles (2485 km) west-southwest of the southern tip of Baja California.[8]
- 06:00 UTC (11:00 p.m. PDT July 16) at 13.1°N 115.9°W – Tropical Depression Eight-E develops from an area of low pressure approximately 815 miles (1,315 km) southwest of the southern tip of the Baja California Peninsula.[10]
- 12:00 UTC (6:00 a.m. CDT) at 14.1°N 105.0°W – Tropical Depression Seven-E develops from an area of low pressure approximately 340 miles (550 km) south of Manzanillo, Colima.[11]
- 18:00 UTC (11:00 a.m. PDT) at 13.7°N 116.8°W –Tropical Depression Eight-E reaches its peak intensity of 35 mph (55 km/h) and a minimum barometric pressure of 1007 mbar (hPa; 29.74 inHg).[10]
July 18
- 00:00 UTC (5:00 p.m. PDT July 17) at 14.4°N 131.8°W – Hurricane Fernanda weakens to a Category 2 hurricane roughly 1,560 miles (2,515 km) west-southwest of the southern tip of the Baja California Peninsula.[8]
- 12:00 UTC (6:00 a.m. MDT) at 14.5°N 107.9°W – Tropical Depression Seven-E intensifies into Tropical Storm Greg about 375 miles (600 km) southwest of Manzanillo, Colima.[11]
July 19
- 06:00 UTC (11:00 p.m. PDT July 18) at 16.8°N 134.7°W – Hurricane Fernanda weakens to a Category 1 hurricane roughly 1,330 miles (2,140 km) east of Hilo, Hawaii.[8]
July 20
- 06:00 UTC (11:00 p.m. PDT July 20) at 18.0°N 137.5°W – Hurricane Fernanda weakens to a tropical storm roughly 1,140 miles (1,835 km) east of Hilo, Hawaii.[8]
- 06:00 UTC (11:00 p.m. PDT July 20) at 13.9°N 122.5°W – Tropical Depression Eight-E degenerates to a remnant area of low pressure roughly 1130 miles (1820 km) west-southwest of the southern tip of the Baja California Peninsula.[10]
July 21
- 00:00 UTC (5:00 p.m. PDT July 20) at 14.2°N 117.0°W – Tropical Storm Greg attains peak winds of 60 mph (95 km/h) and a minimum barometric pressure of 1000 mbar (hPa; 29.53 inHg) while located 810 miles (1,305 km) southwest of the southern tip of the Baja California Peninsula.[11]
- 12:00 UTC (7:00 a.m. CDT) at 8.8°N 92.3°W – Tropical Depression Nine-E develops from an area of low pressure approximately 505 miles (815 km) south-southeast of Puerto Ángel, Oaxaca.[12]
July 22
- 03:00 UTC (10:00 p.m. CDT July 22) at 10.0°N 98.3°W – Tropical Depression Nine-E intensifies into Tropical Storm Hilary about 585 miles (940 km) south-southeast of Manzanillo, Colima.[12]
- 06:00 UTC (12:00 a.m. MDT) at 14.1°N 111.7°W – Tropical Depression Ten-E develops from an area of low pressure approximately 595 miles (960 km) south-southwest of the southern tip of the Baja California Peninsula.[13]
- 18:00 UTC (8:00 a.m. HST) at 19.4°N 146.9°W – Tropical Storm Fernanda degenerates to a remnant area of low pressure roughly 500 miles (805 km) east of Hilo, Hawaii.[8]
July 23
- 06:00 UTC (12:00 a.m. MDT) at 14.7°N 114.8°W – Tropical Depression Ten-E intensifies into Tropical Storm Irwin roughly 665 miles (1,070 km) south-southwest of the southern tip of the Baja California Peninsula.[13]
July 24
- 06:00 UTC (1:00 a.m. CDT) at 13.7°N 103.5°W – Tropical Storm Hilary intensifies into a Category 1 hurricane about 345 miles (560 km) south of Manzanillo, Colima.[12]
July 25
- 00:00 UTC (11:00 p.m. PDT July 24) at 15.2°N 118.1°W – Tropical Storm Irwin strengthens into a Category 1 hurricane roughly 770 miles (1,235 km) southwest of the southern tip of the Baja California Peninsula.[13]
- 06:00 UTC (1:00 a.m. CDT) at 15.0°N 106.3°W – Hurricane Hilary intensifies into a Category 2 hurricane approximately 290 miles (470 km) south-southwest of Manzanillo, Colima.[12]
- 18:00 UTC (11:00 a.m. PDT) at 15.8°N 119.8°W – Hurricane Irwin peaks as a strong Category 1 hurricane with winds of 90 mph (145 km/h) and a central pressure of 979 mbar (hPa; 28.91 inHg) approximately 855 miles (1,375 km) west-southwest of the southern tip of the Baja California Peninsula.

July 26
- 00:00 UTC (5:00 p.m. PDT July 25) at 16.8°N 138.3°W – Tropical Storm Greg weakens to a tropical depression about 1185 miles (1910 km) east of South Point, Hawaii.[11]
- 00:00 UTC (6:00 p.m. MDT July 25) at 15.9°N 109.3°W – Hurricane Hilary reaches its peak intensity with winds of 110 mph (175 km/h) and a minimum pressure of 969 mbar (hPa; 28.61 inHg) while located about 480 miles (770 km) south-southwest of the southern tip of the Baja California Peninsula.[12]
- 12:00 UTC (5:00 a.m. PDT) at 15.6°N 121.8°W – Hurricane Irwin weakens to a tropical storm roughly 940 miles (1,515 km) west-southwest of the southern tip of the Baja California Peninsula.[13]
- 18:00 UTC (8:00 a.m. HST) at 18.3°N 141.6°W – Tropical Depression Greg degenerates into a remnant area of low pressure about 865 miles (1395 km) east-southeast of Hawaii.[11][14]
July 27
- 06:00 UTC (12:00 a.m. MDT) at 17.1°N 114.6°W – Hurricane Hilary weakens back to a Category 1 hurricane around 515 miles (825 km) southwest of the southern tip of the Baja California Peninsula.[12]
July 28
- 00:00 UTC (5:00 p.m. PDT July 27) at 18.1°N 116.9°W – Hurricane Hilary further weakens to a tropical storm about 575 miles (925 km) west-southwest of the southern tip of the Baja California Peninsula.[12]
July 31
- 00:00 UTC (5:00 p.m. PDT July 30) at 25.3°N 127.9°W – Tropical Storm Hilary degenerates to a post-tropical cyclone about 1,185 miles (1,905 km) west-northwest of the southern tip of the Baja California Peninsula.[12]
August
August 1
- 18:00 UTC (11:00 a.m. PDT) at 26.4°N 129.5°W – Tropical Storm Irwin degenerates to a post-tropical cyclone roughly 1,230 miles (1,980 km) west-northwest of the southern tip of the Baja California Peninsula.[13]
August 4
- 06:00 UTC (12:00 a.m. MDT) at 16.5°N 107.3°W – Tropical Depression Eleven-E forms about 335 miles (535 km) west-southwest of Manzanillo, Mexico.[15]
- 18:00 UTC (12:00 p.m. MDT) at 17.7°N 109.8°W – Tropical Depression Eleven-E reaches its minimum pressure of 1006 mbar (hPa; 29.71 inHg) about 340 miles (545 km) south of the southern tip of Baja California.[15]
August 5
- 18:00 UTC (12:00 p.m. MDT) at 20.0°N 111.6°W – Tropical Depression Eleven-E becomes a remnant low roughly 115 miles (180 km) north-northwest of Socorro Island.[15]
August 11
- 12:00 UTC (6:00 a.m. MDT) at 19.3°N 109.8°W – Tropical Depression Twelve-E forms about 150 miles (240 km) west-southwest of Manzanillo.[16]
- 18:00 UTC (12:00 p.m. MDT) at 18.8°N 108.0°W – Tropical Depression Twelve-E intensifies into Tropical Storm Jova and simultaneously reaches its peak intensity with winds 40 mph (65 km/h) and a minimum pressure of 1003 mbar (hPa; 29.62 inHg), about 250 miles (400 km) south of the southern tip of Baja California.[16]
August 12
- 18:00 UTC (12:00 p.m. MDT) at 20.2°N 112.4°W – Tropical Storm Jova weakens into a tropical depression roughly 175 miles (285 km) northwest of Socorro Island.[16]
August 13
- 18:00 UTC (11:00 a.m. PDT) at 20.4°N 118.0°W – Tropical Depression Jova transitions into a remnant low roughly 650 miles (1,045 km) west-southwest of the southern tip of Baja California.[16]
August 18
- 06:00 UTC (12:00 a.m. MDT) at 14.2°N 114.6°W – Tropical Depression Thirteen-E forms about 705 miles (1,135 km) southwest of the southern tip of Baja California.[17]
August 19
- 00:00 UTC (5:00 p.m. PDT August 18) at 14.9°N 118.5°W – Tropical Depression Thirteen-E intensifies into Tropical Storm Kenneth about 810 miles (1,305 km) southwest of the southern tip of Baja California.[17]
August 20
- 12:00 UTC (5:00 a.m. PDT) at 16.1°N 126.8°W – Tropical Storm Kenneth intensifies into a Category 1 hurricane about 1,225 miles (1,970 km) west-southwest of the southern tip of Baja California.[17]
August 21
- 00:00 UTC (5:00 p.m. PDT August 20) at 16.5°N 128.8°W – Hurricane Kenneth intensifies into a high-end Category 2 hurricane about 1,315 miles (2,115 km) west-southwest of the southern tip of Baja California.[17]
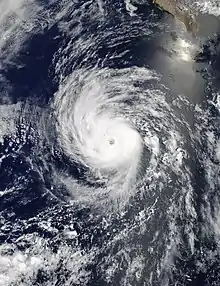
- 06:00 UTC (11:00 p.m. PDT August 20) at 16.8°N 129.1°W – Hurricane Kenneth rapidly intensifies into a Category 4 hurricane and simultaneously reaches its peak intensity of 130 mph (210 km/h) and a minimum pressure of 951 mbar (hPa; 28.08 inHg) about 1,355 miles (2180 km) west-southwest of the southern tip of Baja California.[17]
- 18:00 UTC (11:00 a.m. PDT) at 18.1°N 131.2°W – Hurricane Kenneth weakens to a Category 3 hurricane about 1,435 miles (2,310 km) west of the southern tip of Baja California.[17]
August 22
- 00:00 UTC (5:00 p.m. PDT August 21) at 18.8°N 131.8°W – Hurricane Kenneth weakens to a Category 2 about 1,450 miles (2,335 km) west of the southern tip of Baja California.[17]
- 12:00 UTC (5:00 a.m. PDT) at 20.3°N 132.9°W – Hurricane Kenneth weakens to a Category 1 about 1,465 miles (2,355 km) west of the southern tip of Baja California.[17]
August 23
- 00:00 UTC (5:00 p.m. PDT August 22) at 22.2°N 133.8°W – Hurricane Kenneth weakens to a tropical storm about 1,515 miles (2,435 km) west of the southern tip of Baja California.[17]
- 12:00 UTC (5:00 a.m. PDT) at 24.1°N 134.8°W – Tropical Storm Kenneth becomes a remnant low about 1,625 miles (2,615 km) west of the southern tip of Baja California.[17]
August 30
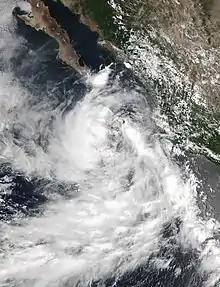
- 18:00 UTC (12:00 p.m. MDT) at 19.8°N 108.7°W – Tropical Storm Lidia forms about 180 miles (290 km) south-southeast of the southern tip of Baja California.[18]
September
September 1
- 00:00 UTC (6:00 p.m. MDT August 30) at 22.9°N 110.3°W – Tropical Storm Lidia reaches its peak intensity with winds of 65 mph (105 km/h) and a minimum pressure of 986 mbar (hPa; 29.12 inHg) about 50 miles (80 km) south-southwest of La Paz, Mexico.[18]
- 12:00 UTC (6:00 a.m. MDT) at 24.0°N 110.9°W – Tropical Storm Lidia makes landfall near Punta Marquez with winds of 60 mph (95 km/h) about 45 miles (70 km) west of La Paz, Mexico.[18]
September 2
- 06:00 UTC (12:00 a.m. MDT) at 26.8°N 113.2°W – Tropical Storm Lidia makes landfall near Punta Abreojos as a weaker tropical storm with winds of 45 mph (70 km/h) about 70 miles (115 km) west-southwest of Santa Rosalia, Mexico.[18]
September 3
- 00:00 UTC (5:00 p.m. PDT) at 28.9°N 115.4°W – Tropical Storm Lidia weakens to a tropical depression about 95 miles (150 km) of Punta Eugenia, Mexico.[18]
- 06:00 UTC (11:00 p.m. PDT) at 29.3°N 115.9°W – Tropical Depression Lidia transitions into a remnant low about 40 miles (65 km) southwest of Punta Baja, Mexico.[18]
September 11
- 06:00 UTC (12:00 a.m. CDT) at 16.4°N 108.6°W – Tropical Depression Fifteen-E forms about 555 miles (895 km) west-southwest of Manzanillo, Mexico.[19]
September 13
- 00:00 UTC (11:00 p.m. PDT September 13) at 15.2°N 118.0°W – Tropical Depression Fifteen-E intensifies into Tropical Storm Otis roughly 830 miles (1,335 km) southwest of the southern tip of Baja California.[19]
- 12:00 UTC (5:00 a.m. PDT) at 14.9°N 120.1°W – Tropical Storm Otis weakens back into a tropical depression around 985 miles (1,590 km) west-southwest of the southern tip of Baja California.[19]
September 16
- 18:00 UTC (11:00 a.m. PDT) at 15.8°N 126.8°W – Tropical Depression Otis re-intensifies back into a tropical storm about 1,215 miles (1,950 km) west-southwest of the southern tip of Baja California.[19]
September 17
- 12:00 UTC (5:00 a.m. PDT) at 16.3°N 127.2°W – Tropical Storm Otis strengthens into a Category 1 hurricane about 1,200 miles (1,930 km) west-southwest of the southern tip of Baja California.[19]
September 18
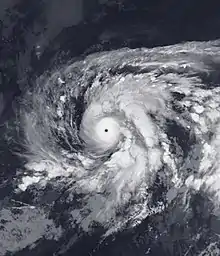
- 00:00 UTC (5:00 p.m. PDT September 17) at 17.6°N 127.2°W – Hurricane Otis becomes a Category 3 hurricane and reaches its peak intensity of 115 mph (185 km/h) and a minimum pressure of 965 mbar (hPa; 28.50 inHg) about 1,170 miles (1,880 km) west-southwest of the southern tip of Baja California.[19]
- 06:00 UTC (11:00 p.m. PDT September 17) at 18.3°N 127.3°W – Hurricane Otis weakens to a Category 2 hurricane about 1,165 miles (1,870 km) west-southwest of the southern tip of Baja California.[19]
- 12:00 UTC (5:00 a.m. PDT) at 18.7°N 127.4°W – Hurricane Otis weakens to a Category 1 hurricane about 1,160 miles (1,865 km) west of the southern tip of Baja California.[19]
- 18:00 UTC (11:00 a.m. PDT) at 19.0°N 127.5°W – Hurricane Otis weakens to a tropical storm about 1,170 miles (1,885 km) of the southern tip of Baja California.[19]
See also
References
- Christopher W. Landsea; Neal Dorst; Erica Rule (June 2, 2011). "G: Tropical Cyclone Climatology". Hurricane Research Division: Frequently Asked Questions. G1) When is hurricane season ?. Retrieved April 21, 2017.
{{cite book}}:|work=ignored (help) - Michael J. Brennan (November 22, 2017). Tropical Storm Adrian (PDF) (Report). National Hurricane Center. Retrieved September 1, 2018.
- Robbie J. Berg (May 28, 2015). Tropical Depression One-E Discussion Number 1 (Report). Miami, Florida: National Hurricane Center. Retrieved June 17, 2017.
- Daniel P. Brown (July 13, 2017). Tropical Storm Beatriz (PDF) (Report). National Hurricane Center. Retrieved September 1, 2018.
- John P. Cangialosi (June 19, 2018). Tropical Storm Calvin (PDF) (Report). National Hurricane Center. Retrieved September 1, 2018.
- Robbie J. Berg (November 20, 2017). Hurricane Dora (PDF) (Report). National Hurricane Center. Retrieved September 1, 2018.
- Avila, Lixion A.; Landsea, Christopher W. (October 20, 2017). Hurricane Eugene (PDF) (Report). Miami, Florida: National Hurricane Center. Retrieved February 24, 2021.
- Brennan, Michael J.; Powell, Jeff (February 28, 2019). Hurricane Fernanda (PDF) (Report). Miami, Florida: National Hurricane Center. Retrieved February 24, 2021.
- NHC E. Pacific Ops (July 14, 2017). "Fernanda is now a category 4 hurricane- the 2nd strongest storm so far south in the eastern Pacific..." Twitter. Retrieved July 15, 2017.
- Beven II, John L. (March 21, 2018). Tropical Depression Eight-E (PDF) (Report). Miami, Florida: National Hurricane Center. Retrieved February 27, 2021.
- Pasch, Richard J.; Zelinsky, David A.; Jeselma, Jon (March 16, 2018). Tropical Storm Greg (PDF) (Report). Miami, Florida: National Hurricane Center. Retrieved February 24, 2021.
- Stewart, Stacy R. (January 21, 2018). Hurricane Hilary (PDF) (Report). Miami, Florida: National Hurricane Center. Retrieved March 5, 2021.
- Zelinsky, David A. (January 12, 2018). Hurricane Irwin (PDF) (Report). Miami, Florida: National Hurricane Center. Retrieved March 6, 2021.
- "IBTrACS – International Best Track Archive for Climate Stewardship". www.atms.unca.edu. Retrieved 2021-02-27.
- Brown, Daniel P. (November 21, 2017). Tropical Depression Eleven-E (PDF) (Report). Miami, Florida: National Hurricane Center. Retrieved March 6, 2021.
- Cangialosi, John P. (November 16, 2017). Tropical Storm Jova (PDF) (Report). Miami, Florida: National Hurricane Center. Retrieved March 7, 2021.
- Berg, Robbie (January 28, 2018). Hurricane Kenneth (PDF) (Report). Miami, Florida: National Hurricane Center. Retrieved March 10, 2021.
- Avila, Lixion A. (December 20, 2017). Tropical Storm Lidia (PDF) (Report). Miami, Florida: National Hurricane Center. Retrieved March 16, 2021.
- Blake, Eric S. (January 9, 2018). Hurricane Otis (PDF) (Report). Miami, Florida: National Hurricane Center. Retrieved March 20, 2021.
External links
- The National Hurricane Center's 2017 Tropical Cyclone Advisory Archive
- The National Hurricane Center's 2017 Eastern Pacific Tropical Cyclone Report Archive