Timeline of the 2022 Pacific hurricane season
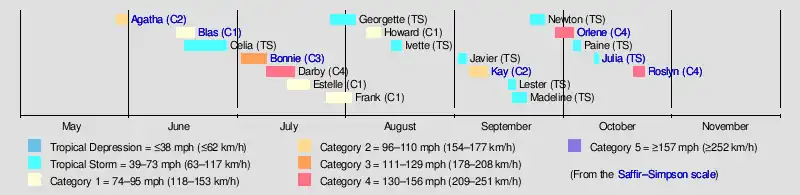
The 2022 Pacific hurricane season was a fairly active tropical cyclone season, with 19 named storm altogether. Ten of those became hurricanes, and four further intensified into major hurricanes (category 3 or higher on the 5-level Saffir–Simpson wind speed scale). Two of this season's storms, Bonnie and Julia, survived the overland crossover from the Atlantic.[1] The season officially started on May 15 in the eastern Pacific—east of 140°W—and June 1 in the central Pacific—between the International Date Line and 140°W, and ended in both regions on November 30. These dates conventionally delimit the period of each year when most tropical cyclones form in the eastern Pacific basin.[2] The season's first storm, Agatha, formed on May 28, and last, Roslyn, dissipated on October 23. Rosyln made landfall in Nayarit with 120 mph (195 km/h) winds, making it the strongest landfalling Pacific hurricane since Patricia in 2015.[3] The season's first major hurricane, Bonnie, entered into the basin from the Atlantic basin on July 2, after crossing Nicaragua as a tropical storm, becoming the first storm to survive the crossover from the Atlantic to the Pacific since Otto in 2016.[4] Three months later, Julia became the second to do so.[5]
| Timeline of the 2022 Pacific hurricane season | |||||
|---|---|---|---|---|---|
 Season summary map | |||||
| Season boundaries | |||||
| First system formed | May 28, 2022 | ||||
| Last system dissipated | October 23, 2022 | ||||
| Strongest system | |||||
| Name | Darby | ||||
| Maximum winds | 140 mph (220 km/h) (1-minute sustained) | ||||
| Lowest pressure | 953 mbar (hPa; 28.14 inHg) | ||||
| Longest lasting system | |||||
| Name | Celia | ||||
| Duration | 12 days | ||||
| |||||
This timeline documents tropical cyclone formations, strengthening, weakening, landfalls, extratropical transitions, and dissipations during the season. It includes information that was not released throughout the season, meaning that data from post-storm reviews by the National Hurricane Center, such as a storm that was not initially warned upon, has been included.
By convention, meteorologists use one time zone when issuing forecasts and making observations: Coordinated Universal Time (UTC), and also use the 24-hour clock (where 00:00 = midnight UTC).[6] Tropical cyclone advisories in the Eastern North Pacific basin use both UTC and the nautical time zone where the center of the tropical cyclone is currently located. Time zones utilized (east to west) are: Central, Mountain, Pacific and Hawaii. In this timeline, all information is listed by UTC first, with the respective regional time zone included in parentheses. Additionally, figures for maximum sustained winds and position estimates are rounded to the nearest 5 units (knots, miles, or kilometers), following National Hurricane Center practice. Direct wind observations are rounded to the nearest whole number. Atmospheric pressures are listed to the nearest millibar and nearest hundredth of an inch of mercury.
Timeline
May
May 15
- The Eastern Pacific hurricane season officially begins.[2]
May 28
- 00:00 UTC (7:00 p.m. CDT, May 27) at 12.8°N 97.9°W – Tropical Depression One-E forms from a low-pressure system about 230 mi (370 km) south-southwest of Bahia de Huatulco, Oaxaca.[7]
- 06:00 UTC (1:00 a.m. CDT) at 12.9°N 97.9°W – Tropical Depression One-E strengthens into Tropical Storm Agatha south-southwest of Bahia de Hautulco.[7]
May 29
- 06:00 UTC (1:00 a.m. CDT) at 13.9°N 99.1°W – Tropical Storm Agatha strengthens into a Category 1 hurricane west-southwest of Bahia de Huatulco.[7]
- 18:00 UTC (1:00 p.m. CDT) at 14.0°N 98.9°W – Hurricane Agatha intensifies to Category 2 strength, and simultaneously reaches peak intensity with winds of 110 mph (175 km/h) and a minimum central pressure of 964 mbar (28.47 inHg), about 220 mi (350 km) southwest of Bahia de Huatulco.[7]
May 30
- 21:00 UTC (4:00 p.m. CDT) at 15.7°N 96.6°W – Hurricane Agatha makes landfall near La Redonda, just west of Puerto Angel, Oaxaca, with sustained winds of 105 mph (165 km/h).[7][8]
May 31
- 00:00 UTC (7:00 p.m. CDT, May 30) at 15.9°N 96.4°W – Hurricane Agatha weakens to Category 1 strength inland about 15 mi (24 km) north-northeast of Puerto Angel.[7][9]
- 06:00 UTC (1:00 a.m. CDT) at 16.5°N 95.8°W – Hurricane Agatha weakens to a tropical storm inland.[7]
- 12:00 UTC (7:00 a.m. CDT) at 17.0°N 95.3°W – Tropical Storm Agatha weakens to a tropical depression inland north-northwest of Salina Cruz, Oaxaca.[7][10]
- 18:00 UTC (1:00 p.m. CDT) at 17.7°N 94.9°W – Tropical Depression Agatha degenerates into a remnant low inland over the northern Isthmus of Tehuantepec, and is later absorbed into a disorganized area of disturbed weather.[nb 1][7]
June
June 1
- The Central Pacific hurricane season officially begins.[2]
June 14
- 06:00 UTC (1:00 a.m. CDT) at 13.6°N 102.5°W – Tropical Storm Blas forms about 290 mi (465 km) southwest of Acapulco, Guerrero.[11]
June 15
- 12:00 UTC (7:00 a.m. CDT) at 14.9°N 102.3°W – Tropical Storm Blas strengthens into a Category 1 hurricane about 215 mi (345 km) southwest of Acapulco.[11]
June 16
- 00:00 UTC (7:00 p.m. CDT, June 15) at 15.4°N 103.0°W – Hurricane Blas reaches peak intensity with winds of 85 mph (140 km/h) and a minimum central pressure of 978 mbar (28.88 inHg), about 235 mi (380 km) southwest of Acapulco.[11]
- 18:00 UTC (1:00 p.m. CDT) at 10.7°N 90.0°W – Tropical Depression Three-E forms from an area of low pressure about 195 mi (315 km) south of Los Cobanos, El Salvador.[12]
June 17
- 00:00 UTC (7:00 p.m. CDT, June 16) at 10.8°N 89.7°W – Tropical Depression Three-E strengthens into Tropical Storm Celia about 145 mi (235 km) south of Los Cobanos.[12]
June 18
- 00:00 UTC (7:00 p.m. CDT, June 17) at 12.0°N 89.2°W – Tropical Storm Celia weakens to a tropical depression about 115 mi (185 km) south-southeast of Los Cobanos.[12]
- 06:00 UTC (11:00 p.m. MDT, June 17) at 17.8°N 110.4°W – Hurricane Blas weakens to a tropical storm south of the southern tip of the Baja California peninsula.[11]
- 18:00 UTC (12:00 p.m. MDT) at 19.0°N 112.4°W – Tropical Storm Blas degenerates into a post-tropical cyclone about 310 mi (500 km) south-southwest of the southern tip of the Baja California peninsula.[11]
June 21
- 12:00 UTC (7:00 a.m. CDT) at 11.8°N 99.3°W – Tropical Depression Celia re-strengthens into a tropical storm about 345 mi (555 km) south of Acapulco, Guerrero.[12]
June 24
- 18:00 UTC (12:00 p.m. MDT) at 17.1°N 108.7°W – Tropical Storm Celia reaches peak intensity with winds of 60 mph (95 km/h) and a minimum central pressure of 997 mbar (29.44 inHg), south-southeast of the southern tip of the Baja California peninsula.[12]
June 28
- 06:00 UTC (11:00 p.m. PDT, June 27) at 21.6°N 119.1°W – Tropical Storm Celia weakens to a tropical depression west of the southern tip of the Baja California peninsula.[12]
- 18:00 UTC (11:00 a.m. PDT) at 22.4°N 120.9°W – Tropical Depression Celia degenerates into a remnant low about 690 mi (1,110 km) west of the southern tip of the Baja California peninsula.[12]
July
July 2
- 12:00 UTC (7:00 a.m. CDT) at 11.2°N 85.9°W – Tropical Storm Bonnie enters the East Pacific basin from the Atlantic basin about 60 mi (95 km) southeast of Managua, Nicaragua.[13][14]
July 4
- 00:00 UTC (7:00 p.m. CDT, July 3) at 12.9°N 94.9°W – Tropical Storm Bonnie strengthens into a Category 1 hurricane.[13]
- 18:00 UTC (1:00 p.m. CDT) at 13.9°N 99.6°W – Hurricane Bonnie intensifies to Category 2 strength.[13]
July 5
- 12:00 UTC (7:00 a.m. CDT) at 15.1°N 103.8°E – Hurricane Bonnie intensifies to Category 3 strength and simultaneously reaches peak intensity with maximum sustained winds of 115 mph (185 km/h) and a minimum central pressure of 964 mbar (28.47 inHg), about 275 mi (445 km) south of Manzanillo, Colima.[13]
- 18:00 UTC (12:00 p.m. MDT) at 15.4°N 105.1°W – Hurricane Bonnie weakens to Category 2 strength about 260 mi (415 km) south-southwest of Manzanillo.[13]
July 7
- 00:00 UTC (6:00 p.m. MDT, July 6) at 16.6°N 110.6°W – Hurricane Bonnie weakens to Category 1 strength about 435 mi (705 km) south-southwest of the southern tip of the Baja California peninsula.[13]
- 18:00 UTC (12:00 p.m. MDT) at 17.5°N 114.5°W – Hurricane Bonnie restrengthens to Category 2 strength about 480 mi (770 km) southwest of the southern tip of the Baja California peninsula.[13]
July 8
- 06:00 UTC (11:00 p.m. PDT, July 7) at 18.0°N 117.7°W – Hurricane Bonnie weakens to Catgegory 1 strength about 610 mi (980 km) southwest of the southern tip of the Baja California peninsula.[13]
- 18:00 UTC (11:00 a.m. PDT) at 18.6°N 121.0°W – Hurricane Bonnie weakens to a tropical storm about 775 mi (1,250 km) west-southwest of the southern tip of the Baja California peninsula.[13]
July 9
- 12:00 UTC (6:00 a.m. MDT) at 13.0°N 111.0°W – A tropical depression forms from a tropical wave about 575 mi (925 km) southwest of the southwestern coast of Mexico.[15]
- 18:00 UTC (11:00 a.m. PDT) at 19.5°N 128.6°W – Tropical Storm Bonnie transitions into post-tropical cyclone about 1,220 mi (1,965 km) west-southwest of the southern tip of the Baja California peninsula, and subsequently degenerates into a trough.[13]
- 18:00 UTC (12:00 p.m. MDT) at 14.2°N 112.8°W – The tropical depression strengthens into Tropical Storm Darby.[15]
July 11
- 00:00 UTC (2:00 p.m. HST, July 10) at 14.5°N 119.9°W – Tropical Storm Darby strengthens into a Category 1 hurricane.[15]
- 06:00 UTC (8:00 p.m. HST, July 10) at 14.5°N 121.3°W – Hurricane Darby intensifies to Category 2 strength.[15]
- 12:00 UTC (2:00 a.m. HST) at 14.5°N 122.8°W – Hurricane Darby intensifies to Category 3 strength.[15]
- 18:00 UTC (8:00 a.m. HST) at 14.6°N 124.3°W – Hurricane Darby intensifies to Category 4 strength and simultaneously reaches peak intensity with maximum sustained winds of 140 mph (220 km/h) and a minimum central pressure of 953 mbar (28.14 inHg), about 1,135 mi (1,825 km) west-southwest of the southern tip of the Baja California peninsula.[15]
July 12
- 18:00 UTC (8:00 a.m. HST) at 14.6°N 130.5°W – Hurricane Darby weakens to Category 3 strength.[15]
July 13

- 00:00 UTC (2:00 p.m. HST, July 12) at 14.6°N 132.7°W – Hurricane Darby weakens to Category 2 strength.[15]
- 18:00 UTC (8:00 a.m. HST) at 15.1°N 136.0°W – Hurricane Darby re-intensifies to Category 3 strength.[15]
July 14
- 06:00 UTC (8:00 p.m. HST, July 13) at 16.0°N 138.9°W – Hurricane Darby weakens to Category 2 strength.[15]
- 12:00 UTC (2:00 a.m. HST) at 16.5°N 140.2°W – Hurricane Darby crosses into the Central Pacific basin.[15]
July 15
- 00:00 UTC (2:00 p.m. HST, July 14) at 17.3°N 142.8°W – Hurricane Darby weakens to Category 1 strength.[15]
- 12:00 UTC (2:00 a.m. HST) at 17.5°N 145.4°W – Hurricane Darby weakens to a tropical storm about 610 mi (980 km) east-southeast of the Big Island of Hawaii.[15]
- 12:00 UTC (7:00 a.m. CDT) at 12.0°N 99.9°W – Tropical Depression Six-E forms from a tropical wave about 345 mi (555 km) south of Acapulco, Guerrero.[16]
July 16
- 00:00 UTC (7:00 p.m. CDT, July 15) at 13.0°N 101.6°W – Tropical Depression Six-E strengthens into Tropical Storm Estelle south-southwest of Acapulco.[16]
July 17
- 00:00 UTC (2:00 p.m. HST, July 16) at 17.7°N 157.5°W – Tropical Storm Darby opens up into a trough south of the Big Island of Hawaii.[15]
- 00:00 UTC (7:00 p.m. CDT, July 16) at 14.5°N 104.6°W – Tropical Storm Estelle strengthens into a Category 1 hurricane south of Manzanillo, Colima.[16]
- 12:00 UTC (6:00 a.m. MDT) at 15.3°N 106.4°W – Hurricane Estelle reaches peak intensity with maximum sustained winds of 85 mph (140 km/h) and a minimum central pressure of 985 mbar (29.09 inHg), about 300 mi (480 km) southwest of Manzanillo.[16]
July 19
- 06:00 UTC (12:00 a.m. MDT) at 18.4°N 114.2°W – Hurricane Estelle weakens to a tropical storm about 666,720 m (665 km) southwest of the southern tip of the Baja California peninsula.[16]
July 21
- 6:00 UTC (11:00 p.m. PDT, July 20) at 22.1°N 123.9°W – Tropical Storm Estelle transitions into a post-tropical cyclone about 920 mi (1,480 km) west of the southern tip of the Baja California peninsula, and subsequently dissipates.[16]
July 26
- 00:00 UTC (7:00 p.m. CDT, July 25) at 11.1°N 100.2°W – Tropical Depression Seven-E forms from a tropical wave about 405 mi (650 km) south of Acapulco, Guerrero.[17]
- 6:00 UTC (1:00 a.m. CDT) at 11.3°N 101.2°W – Tropical Depression Seven-E strengthens into Tropical Storm Frank south of Acapulco.[17]
July 27
- 12:00 UTC (6:00 a.m. MDT) at 16.3°N 114.2°W – Tropical Depression Eight-E forms about 535 mi (860 km) south-southwest of the southern tip of the Baja California peninsula.[18]
- 18:00 UTC (11:00 a.m. PDT) at 16.3°N 115.2°W – Tropical Depression Eight-E strengthens into Tropical Storm Georgette south-southwest of the southern tip of the Baja California peninsula.[18]
July 29
- 06:00 UTC (11:00 p.m. PDT, July 28) at 15.4°N 121.3°W – Tropical Storm Georgette attains peak intensity with maximum sustained winds of 60 mph (95 km/h) and a minimum central pressure of 998 mbar (29.47 inHg), about 900 mi (1,445 km) west-southwest of the southern tip of the Baja California peninsula.[18]
July 30
- 00:00 UTC (6:00 p.m. MDT, July 29) at 14.9°N 114.2°W – Tropical Storm Frank strengthens into a Category 1 hurricane about 635 mi (1,020 km) south-southwest of the southern tip of the Baja California peninsula.[17]
- 06:00 UTC (11:00 p.m. PDT, July 29) at 15.5°N 115.0°W – Hurricane Frank attains peak intensity with maximum sustained winds of 90 mph (150 km/h) and a minimum central pressure of 976 mbar (28.82 inHg), southwest of the southern tip of the Baja California peninsula.[17]
July 31
- 18:00 UTC (11:00 a.m. PDT) at 12.8°N 129.7°W – Tropical Storm Georgette weakens to a tropical depression about 1,465 mi (2,360 km) west-southwest of the southern tip of the Baja California peninsula.[18]
August
August 1
- 06:00 UTC (11:00 p.m. PDT, July 31) at 21.2°N 121.3°W – Hurricane Frank weakens to a tropical storm west of the southern tip of the Baja California peninsula.[17]
August 2
- 18:00 UTC (11:00 a.m. PDT) at 25.2°N 125.8°W – Tropical Storm Frank degenerates into a post-tropical cyclone about 690 miles (1,110 km) west of the central Baja California coast, and subsequently opens into a trough.[17]
August 3
- 18:00 UTC (11:00 a.m. PDT) at 19.5°N 133.5°W – Tropical Depression Georgette degenerates into a remnant low about 1,305 mi (2,100 km) west-southwest of the southern tip of the Baja California peninsula.[18]
August 6
- 12:00 UTC (7:00 a.m. CDT) at 14.0°N 105.3°W – Tropical Depression Nine-E forms about 380 mi (610 km) south-southwest of Manzanillo, Colima.[19]
August 7
- 18:00 UTC (12:00 p.m. MDT) at 17.2°N 110.4°W – Tropical Depression Nine-E strengthens into Tropical Storm Howard west-southwest of Manzanillo, Colima.[19]
August 8
- 18:00 UTC (12:00 p.m. MDT) at 20.3°N 113.9°W – Tropical Storm Howard strengthens into a Category 1 hurricane.[19]
August 9
- 00:00 UTC (6:00 p.m. MDT, August 8) at 20.9°N 114.8°W – Hurricane Howard attains peak intensity with maximum sustained winds of 85 mph (140 km/h) and a minimum central pressure of 983 mbar (29.03 inHg), west-southwest of Baja California Sur.[19]
August 10
- 00:00 UTC (5:00 p.m. PDT, August 9) at 22.9°N 118.0°W – Hurricane Howard weakens into a tropical storm.[19]
August 11
- 00:00 UTC (5:00 p.m. PDT, August 10) at 24.0°N 121.9°W – Tropical Storm Howard degenerates into a post-tropical low about 690 mi (1,110 km) west of the southern tip of the Baja California peninsula, and subsequently opens up into a trough.[19]
August 13
- 12:00 UTC (6:00 a.m. MDT) at 17.7°N 110.3°W – Tropical Depression Ten-E forms from a tropical wave about 345 mi (555 km) south of the southern tip of the Baja California peninsula.[20]
August 15
- 12:00 UTC (6:00 a.m. MDT) at 17.8°N 113.5°W – Tropical Depression Ten-E strengthens into Tropical Storm Ivette, and simultaneously attains peak intensity with maximum sustained winds of 40 mph (65 km/h) and a minimum central pressure of 1005 mbar (29.68 inHg), about 425 mi (685 km) south-southwest of the southern tip of the Baja California peninsula.[20]
August 16
- 00:00 UTC (6:00 p.m. MDT, August 15) at 17.6°N 113.9°W – Tropical Storm Ivette weakens to a tropical depression southwest of the southern tip of the Baja California peninsula.[20]
- 18:00 UTC (11:00 a.m. PDT) at 17.2°N 114.8°W – Tropical Depression Ivette degenerates into a remnant low about 505 mi (815 km) southwest of the southern tip of the Baja California peninsula, and subsequently dissipates far to the east-southeast of the Hawaiian Islands.[nb 2][20]
September
September 1
- 18:00 UTC 12:00 p.m. MDT) at 18.5°N 110.5°W – Tropical Depression Eleven-E forms about 30 mi (45 km) east-southeast of Socorro Island.[23]
September 2
- 06:00 UTC (12:00 a.m. MDT) at 19.6°N 111.6°W – Tropical Depression Eleven-E intensifies into Tropical Storm Javier while passing to the west of Socorro Island.[23]
September 3
- 00:00 UTC (6:00 p.m. MDT, September 2) at 22.5°N 112.8°W – Tropical Storm Javier attains peak intensity with maximum sustained winds of 50 mph (85 km/h) and a minimum central pressure of 999 mbar (29.50 inHg), about 190 mi (305 km) west-southwest of Cabo San Lucas, Baja California Sur.[23]
- 18:00 UTC (11:00 a.m. PDT) at 25.4°N 115.5°W – Tropical Storm Javier degenerates into a post-tropical low off the western coast of Baja California Sur, and subsequently dissipates.[23]
September 4
- 12:00 UTC (7:00 a.m. CDT) at 14.1°N 100.9°W – Tropical Depression Twelve-E forms about 225 mi (360 km) south-southwest of Acapulco, Guerrero.[24]
- 18:00 UTC (1:00 p.m. CDT) at 14.7°N 102.0°W – Tropical Depression Twelve-E intensifies into Tropical Storm Kay southwest of Acapulco.[24]
September 5
- 18:00 UTC (12:00 p.m. MDT) at 15.5°N 106.9°W – Tropical Storm Kay intensifies into a Category 1 hurricane about 545 mi (880 km) south-southeast of the southern tip of Baja California.[24]
September 7
- 12:00 UTC (6:00 a.m. MDT) at 20.6°N 112.3°W – Hurricane Kay intensifies into a Category 2 hurricane and simultaneously attains peak intensity with maximum sustained winds of 100 mph (155 km/h) and a minimum central pressure of 968 mbar (28.59 inHg), about 220 mi (355 km) southwest of the southern tip of Baja California.[24]
- 18:00 UTC (12:00 p.m. MDT) at 21.5°N 112.8°W – Hurricane Kay weakens to a Category 1 hurricane about 210 mi (335 km) southwest of the southern tip of Baja California.[24]
September 8
- 18:00 UTC (12:00 p.m. MDT) at 26.6°N 114.1°W – Hurricane Kay weakens to a tropical storm about 110 mi (175 km) southeast of Punta Eugenia, Baja California Sur.[24][25]
- 20:35 UTC (2:35 p.m. MDT) at 27.2°N 114.3°W – Tropical Storm Kay makes landfall near San Rafael, Baja California Sur, with sustained winds of 70 mph (110 km/h).[24]
September 9
- 18:00 30.8°N 117.4°W – Tropical Storm Kay transitions into a post-tropical cyclone offshore about 130 mi (210 km) south of San Diego, California, and subsequently dissipates.[24]
September 15
- 18:00 UTC (1:00 p.m. CDT) at 12.6°N 95.0°W – Tropical Depression Thirteen-E forms from an area of disturbed weather about 230 mi (370 km) south-southeast of Puerto Angel, Oaxaca.[26]
September 16
- 06:00 UTC (1:00 a.m. CDT) at 13.1°N 95.4°W – Tropical Depression Thirteen-E intensifies into Tropical Storm Lester about 190 mi (305 km) south-southeast of Puerto Angel, and simultaneously attains peak intensity with maximum sustained winds of 40 mph (65 km/h) and a minimum central pressure of 1005 mbar (29.68 inHg).[26]
- 18:00 UTC (1:00 p.m. CDT) at 14.6°N 106.8°W – A tropical depression forms from an area of low pressure about 345 mi (555 km) south-southwest of Manzanillo, Colima.[27]
September 17
- 06:00 UTC (1:00 a.m. CDT) at 14.9°N 106.5°W – The tropical depression strengthens into Tropical Storm Madeline about 315 mi (510 km) south-southwest of Manzanillo.[27]
- 12:00 UTC (7:00 a.m. CDT) at 15.8°N 97.0°W – Tropical Depression Lester makes Landfall near Puerto Escondido, Oaxaca, with sustained winds of 30 mph (50 km/h), and dissipates a few hours later over the mountains of southern Mexico.[26]
September 19
- 12:00 UTC (6:00 a.m. MDT) at 20.5°N 108.7°W – Tropical Storm Madeline attains peak intensity with maximum sustained winds of 65 mph (100 km/h) and a minimum central pressure of 991 mbar (29.26 inHg), about 175 mi (280 km) south-southeast of the southern tip of the Baja California peninsula.[27]
September 20
- 12:00 UTC (6:00 a.m. MDT) at 21.1°N 111.6°W – Tropical Storm Madeline degenerates into a remnant low about 160 mi (260 km) southwest of the southern tip of the Baja California peninsula, and subsequently opens into a trough of low pressure over the open ocean.[27]
September 21
- 12:00 UTC (7:00 a.m. CDT) at 16.9°N 104.3°W – Tropical Depression Fifteen-E forms from an area of disturbed weather about 155 mi (250 km) south of Manzanillo, Colima.[28]
- 18:00 UTC (2:00 p.m. CDT) at 17.2°N 105.4°W – Tropical Depression Fifteen-E intensifies into Tropical Storm Newton south-southwest of Manzanillo.[28]
September 22
- 12:00 UTC (8:00 a.m. MDT) at 17.6°N 108.2°W – Tropical Storm Newton attains peak intensity with maximum sustained winds of 65 mph (100 km/h) and a minimum central pressure of 997 mbar (29.44 inHg), west-southwest of Manzanillo.[28]
September 24
- 18:00 UTC (12:00 p.m. MDT) at 19.3°N 113.6°W – Tropical Storm Newton weakens to a tropical depression.[28]
September 25
- 18:00 UTC (11:00 a.m. PDT) at 18.6°N 116.7°W – Tropical Depression Newton degenerated into a remnant low about 530 mi (850 km) southwest of the southern tip of the Baja California Peninsula.[28]
September 28
- 18:00 UTC (1:00 p.m. CDT) at 13.8°N 102.3°W – Tropical Depression Sixteen-E forms about 265 mi (425 km) south of Zihuatanejo, Guerrero.[29]
September 29
- 00:00 UTC (7:00 p.m. CDT, September 28)) at 14.1°N 103.2°W – Tropical Depression Sixteen-E intensifies into Tropical Storm Orlene.[29]
October
October 1
- 12:00 UTC (6:00 a.m. MDT) at 17.4°N 107.0°WTropical Storm Orlene strengthens into a Category 1 hurricane about 205 mi (335 km) west-southwest of Manzanillo, Colima.[29]
October 2
- 00:00 UTC (6:00 p.m. MDT, October 1) at 18.1°N 107.0°W – Hurricane Orlene intensifies into a Category 2 hurricane.[29]
- 06:00 UTC (12:00 a.m. MDT) at 18.6°N 106.9°W – Hurricane Orlene intensifies into a Category 3 hurricane about 145 mi (235 km) south-southwest of Cabo Corrientes.[29][30]
- 12:00 UTC (6:00 a.m. MDT) at 19.3°N 106.9°W – Hurricane Orlene intensifies into a Category 4 hurricane, and simultaneously attains peak intensity with maximum sustained winds of 130 mph (215 km/h) and a minimum central pressure of 954 mbar (28.17 inHg), about 140 mi (220 km) southwest of Puerto Vallarta, Jalisco.[29]
- 18:00 UTC (12:00 p.m. MDT) at 20.0°N 107.0°W – Hurricane Orlene weakens to a Category 3 hurricane near Islas Marias.[29]
October 3
- 00:00 UTC (6:00 p.m. MDT, October 2) at 20.8°N 106.8°W – Hurricane Orlene weakens to a Category 2 hurricane.[29]
- 06:00 UTC (12:00 a.m. MDT) at 14.9°N 111.5°W – A tropical depression forms from a disturbance about 520 mi (835 km) southwest of the coast of southwestern Mexico.[31]
- 12:00 UTC (6:00 a.m. MDT) at 22.6°N 106.2°W – Hurricane Orlene weakens to a Category 1 hurricane south-southeast of Mazatlan, Sinaloa.[29][32]
- 14:35 UTC (9:35 a.m. CDT) at 22.9°N 106.1°W – Hurricane Orlene makes landfall near Caimanero, Sinaloa with sustained winds of 80 mph (130 km/h).[29]
- 18:00 UTC (1:00 p.m. CDT) at 23.2°N 106.0°W – Hurricane Orlene weakens to a tropical storm inland east of Mazatlan, and rapidly dissipates.[29][33]
- 18:00 UTC (12:00 p.m. MDT) at 15.9°N 111.9°W – The tropical depression strengthens to Tropical Storm Paine.[31]
October 4
- 18:00 UTC (12:00 p.m. MDT) at 17.5°N 113.2°W – Tropical Storm Paine attains peak intensity with maximum sustained winds of 45 mph (75 km/h) and a minimum central pressure of 1005 mbar (29.68 inHg).[31]
October 5
- 06:00 UTC (12:00 a.m. MDT) at 18.1°N 113.9°W – Tropical Storm Paine degenerates into a remnant low about 405 mi (650 km) south-southwest of the southern tip of the Baja California peninsula, and subsequently dissipaters.[31]
October 10
- 00:00 UTC (7:00 p.m. CDT, October 9) at 12.6°N 87.6°W – Tropical Storm Julia enters the East Pacific basin from the Atlantic basin about 90 mi (145 km) west-northwest of Managua, Nicaragua.[34][35]
- 11:00 UTC (6:00 a.m. CDT) at 13.6°N 89.7°W – Tropical Storm Julia makes landfall near Acajutla, El Salvador with sustained winds of 40 mph (65 km/h).[35]
- 12:00 UTC (7:00 a.m. CDT) at 13.7°N 89.9°W – Tropical Storm Julia weakens to a tropical depression inland about 40 mi (65 km) west of San Salvador, El Salvador, and later dissipates.[35][36]
October 20
- 00:00 UTC (7:00 p.m. CDT, October 19) at 15.1°N 100.9°W – Tropical Depression Nineteen-E forms about 140 mi (220 km) south-southwest of Acapulco, Guerrero.[37]
- 12:00 UTC (7:00 a.m. CDT) at 15.1°N 101.8°W – Tropical Depression Nineteen-E strengthens into Tropical Storm Roslyn.[37]
October 22
- 00:00 UTC (7:00 p.m. CDT, October 21) at 16.6°N 105.3°W – Tropical Storm Roslyn strengthens into a hurricane about 185 mi (295 km) south-southwest of Manzanillo, Colima.[37]
- 06:00 UTC (1:00 a.m. CDT) at 17.0°N 105.8°W – Hurricane Roslyn intensifies to a Category 3 hurricane[37] about 175 mi (280 km) southwest of Manzanillo.[38]
- 18:00 UTC (12:00 a.m. MDT) at 18.5°N 106.6°W – Hurricane Roslyn intensifies to a Category 4 hurricane, and simultaneously attains peak intensity with maximum sustained winds of 130 mph (215 km/h) and a minimum central pressure of 954 mbar (28.17 inHg), about 140 mi (220 km) west-southwest of Manzanillo.[37]
October 23
- 06:00 UTC (12:00 a.m. MDT) at 20.5°N 106.4°W – Hurricane Roslyn weakens to a Category 3 hurricane[37] about 45 mi (70 km) west of Cabo Corrientes, Jalisco.[39]
- 11:20 UTC (5:20 a.m. MDT) at 21.9°N 105.6°W – Hurricane Roslyn makes landfall near Santa Cruz, Nayarit, with sustained winds of 120 mph (195 km/h).[37]
- 18:00 UTC (1:00 p.m. CDT) at 23.9°N 103.9°W – Hurricane Roslyn weakens to a tropical storm inland about 70 mi (110 km) southeast of Durango City, Durango.[37]
October 24
- 00:00 UTC (7:00 p.m. CDT, October 23) at 25.6°N 101.5°W – Tropical Storm Roslyn degenerates into a remnant low over Coahuila, west of Monterrey, Nuevo León, and later dissipates.[37]
November
- No tropical cyclones formed in the basin during the month of November.
November 30
- The 2022 Pacific hurricane season officially ends in the Eastern Pacific and Central Pacific basins.[2]
See also
Notes
- This large and complex area of disturbed weather eventually became Tropical Storm Alex.[7]
- The National Hurricane Center monitored Ivette's remnants for possible regeneration from August 20 to August 21, when environmental conditions became increasingly unfavorable for further development.[21][22]
References
- Monthly Tropical Weather Summary for November 2022 (Report). Miami, Florida: National Hurricane Center. December 1, 2022. Retrieved December 2, 2022.
- "Hurricane Season Information". Frequently Asked Questions About Hurricanes. Miami, Florida: NOAA Atlantic Oceanographic and Meteorological Laboratory. June 1, 2018. Retrieved April 13, 2021.
- Masters, Jeff (October 22, 2022). "Category 4 Hurricane Roslyn heads for landfall on Mexico's Pacific coast". New Haven, Connecticut: Yale Climate Connections. Retrieved October 25, 2022.
- Masters, Jeff; Henson, Bob (July 2, 2022). "Tropical Storm Colin forms along the South Carolina coast". New Haven Connecticut: Yale Climate Connections. Retrieved July 5, 2022.
- Henson, Bob (October 10, 2022). "As Julia fades, floods plague Central America". New Haven, Connecticut: Yale Climate Connections. Retrieved March 21, 2023.
- "Understanding the Date/Time Stamps". Miami, Florida: National Hurricane Center. Retrieved July 20, 2022.
- Beven, John (December 6, 2022). Tropical Cyclone Report: Hurricane Agatha (PDF) (Report). Miami, Florida: National Hurricane Center. Retrieved December 7, 2022.
- Brown, Daniel (May 31, 2022). Hurricane Agatha Advisory Number 12 (Report). Miami, Florida: National Hurricane Center. Retrieved June 13, 2022.
- Blake, Eric (May 30, 2022). Hurricane Agatha Intermediate Advisory Number 12A (Report). Miami, Florida: National Hurricane Center. Retrieved May 31, 2022.
- Brown, Daniel; Bucci, Lisa (May 31, 2022). Tropical Depression Agatha Intermediate Advisory Number 14A (Report). Miami, Florida: National Hurricane Center. Retrieved May 31, 2022.
- Reinhart, Brad (October 26, 2022). Tropical Cyclone Report: Hurricane Blas (PDF) (Report). Miami, Florida: National Hurricane Center. Retrieved November 19, 2022.
- Brown, Daniel (November 1, 2022). Tropical Cyclone Report: Tropical Storm Celia (PDF) (Report). Miami, Florida: National Hurricane Center. Retrieved November 17, 2022.
- Papin, Philippe (March 20, 2023). Tropical Cyclone Report: Hurricane Bonnie (PDF) (Report). Miami, Florida: National Hurricane Center. Retrieved March 21, 2023.
- Cangialosi, John; Hogsett, Wallace (July 2, 2022). Tropical Storm Bonnie Intermediate Advisory Number 19A (Report). Miami, Florida: National Hurricane Center. Retrieved July 2, 2022.
- Bucci, Lisa (February 27, 2023). Tropical Cyclone Report: Hurricane Darby (PDF) (Report). Miami, Florida: National Hurricane Center. Retrieved February 28, 2023.
- Latto, Andrew; Cangialosi, John (November 22, 2022). Tropical Cyclone Report: Hurricane Estelle (PDF) (Report). Miami, Florida: National Hurricane Center. Retrieved November 22, 2022.
- Cangialosi, John (October 26, 2022). Tropical Cyclone Report: Hurricane Frank (PDF) (Report). Miami, Florida: National Hurricane Center. Retrieved October 31, 2022.
- Berg, Robbie (November 15, 2022). Tropical Cyclone Report: Tropical Storm Georgette (PDF) (Report). Miami, Florida: National Hurricane Center. Retrieved November 17, 2022.
- Blake, Eric (March 13, 2023). Tropical Cyclone Report: Hurricane Howard (PDF) (Report). Miami, Florida: National Hurricane Center. Retrieved March 13, 2023.
- Pasch, Richard (March 1, 2023). Tropical Cyclone Report: Tropical Storm Ivette (PDF) (Report). Miami, Florida: National Hurricane Center. Retrieved March 1, 2023.
- Latto, Andrew (August 20, 2022). Two Day Graphical Tropical Weather Outlook (Report). Miami, Florida: National Hurricane Center. Retrieved August 21, 2022.
- Papin, Philippe (August 21, 2022). Five Day Graphical Tropical Weather Outlook (Report). Miami, Florida: National Hurricane Center. Retrieved August 21, 2022.
- Bevin, John (January 31, 2023). Tropical Cyclones Report: Tropical Storm Javier (PDF) (Report). Miami, Florida: National Hurricane Center. Retrieved January 30, 2023.
- Bucci, Lisa; Reinhart, Brad (April 3, 2023). Tropical Cyclone Report: Hurricane Kay (PDF) (Report). Miami, Florida: National Hurricane Center. Retrieved April 6, 2023.
- Beven, Jack (September 8, 2022). Hurricane Kay Advisory Number 17A (Report). Miami, Florida: National Hurricane Center. Retrieved April 6, 2023.
- Reinhart, Brad (December 21, 2022). Tropical Cyclone Report: Tropical Storm Lester (PDF) (Report). Miami, Florida: National Hurricane Center. Retrieved December 21, 2022.
- Brown, Daniel (December 14, 2022). Tropical Cyclone Report: Tropical Storm Madeline (PDF) (Report). Miami, Florida: National Hurricane Center. Retrieved December 16, 2022.
- Papin, Philippe (February 7, 2023). Tropical Cyclones Report: Tropical Storm Newton (PDF) (Report). Miami, Florida: National Hurricane Center. Retrieved February 7, 2023.
- Landsea, Christopher (March 9, 2023). Tropical Cyclones Report: Hurricane Orlene (PDF) (Report). Miami, Florida: National Hurricane Center. Retrieved March 9, 2023.
- Pasch, Richard (October 2, 2022). Hurricane Orlene Advisory Number 14A (Report). Miami, Florida: National Hurricane Center. Retrieved October 2, 2022.
- Cangialosi, John (January 18, 2023). Tropical Cyclone Report: Tropical Storm Paine (PDF) (Report). Miami, Florida: National Hurricane Center. Retrieved January 18, 2023.
- Brown, Daniel (October 3, 2022). Hurricane Orlene Intermediate Advisory Number 19A (Report). Miami, Florida: National Hurricane Center. Retrieved October 3, 2022.
- Brown, Daniel (October 3, 2022). Tropical Storm Orlene Advisory Number 20A (Report). Miami, Florida: National Hurricane Center. Retrieved October 3, 2022.
- Brown, Daniel (October 9, 2022). Tropical Storm Julia Advisory Number 14A (Report). Miami, Florida: National Hurricane Center. Retrieved October 10, 2022.
- Cangialosi, John (March 2, 2023). Tropical Cyclone Report: Hurricane Julia (PDF) (Report). Miami, Florida: National Hurricane Center. Retrieved March 3, 2023.
- Blake, Eric (October 10, 2022). Tropical Depression Julia Advisory Number 16A (Report). Miami, Florida: National Hurricane Center. Retrieved October 10, 2022.
- Berg, Robbie (February 15, 2023). Tropical Cyclone Report: Hurricane Roslyn (PDF) (Report). Miami, Florida: National Hurricane Center. Retrieved February 15, 2023.
- Berg, Robbie (October 22, 2022). Hurricane Roslyn Intermediate Advisory Number 9A (Report). Miami, Florida: National Hurricane Center. Retrieved October 22, 2022.
- Blake, Eric (October 23, 2022). Hurricane Roslyn Intermediate Advisory Number 13A (Report). Miami, Florida: National Hurricane Center. Retrieved October 23, 2022.
External links
- 2022 Tropical Cyclone Advisory Archive, National Hurricane Center and Central Pacific Hurricane Center, noaa.gov