1999–2000 Australian region cyclone season
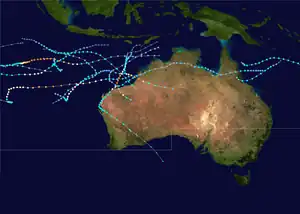
The 1999–2000 Australian region cyclone season was a slightly above average tropical cyclone season. It ran from 1 November 1999 to 30 April 2000. The regional tropical cyclone operational plan also defines a "tropical cyclone year" separately from a "tropical cyclone season", with the "tropical cyclone year" for this season lasting from 1 July 1999 to 30 June 2000.
| 1999–2000 Australian region cyclone season | |
|---|---|
 Season summary map | |
| Seasonal boundaries | |
| First system formed | 2 December 1999 |
| Last system dissipated | 23 May 2000 |
| Strongest storm | |
| Name | Paul |
| • Maximum winds | 220 km/h (140 mph) (10-minute sustained) |
| • Lowest pressure | 915 hPa (mbar) |
| Seasonal statistics | |
| Tropical lows | 14 |
| Tropical cyclones | 13 |
| Severe tropical cyclones | 7 |
| Total fatalities | 0 |
| Total damage | Unknown |
| Related articles | |
Two of the most notable cyclones of the season were Steve and Rosita. Cyclone Steve transversed the entire Australian continent, and although a fairly weak cyclone, caused widespread flooding in Queensland, Northern Territory and Western Australia, while Cyclone Rosita made an almost direct hit on Broome as a severe Category 4 cyclone, devastating several remote stations and the town itself. Rosita surprised many residents of its arrival, as it made landfall very late in the season.
Systems

Tropical Cyclone Ilsa
| Category 2 tropical cyclone (Australian scale) | |
| Tropical storm (SSHWS) | |
  | |
| Duration | 9 December – 17 December |
|---|---|
| Peak intensity | 100 km/h (65 mph) (10-min); 980 hPa (mbar) |
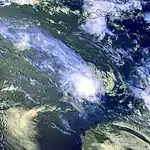
Ilsa formed to the northeast of the Cocos Islands on 11 December 1999. The cyclone moved to the south of Christmas Island on the 13th producing a heavy swell which caused some damage. Its development was impeded by vertical windshear for a large part of its lifetime. After a long track eastwards across the Indian Ocean it eventually crossed the Western Australian coastline on the Eighty Mile Beach near the Sandfire Roadhouse during the early afternoon of 17 December 1999. Apart from producing heavy rainfall, Ilsa did not produce any significant damage.[1]
Severe Tropical Cyclone John
| Category 5 severe tropical cyclone (Australian scale) | |
| Category 4 tropical cyclone (SSHWS) | |
  | |
| Duration | 9 December – 16 December |
|---|---|
| Peak intensity | 205 km/h (125 mph) (10-min); 915 hPa (mbar) |
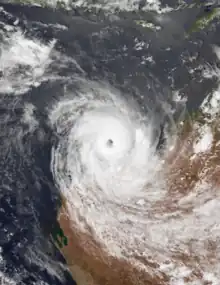
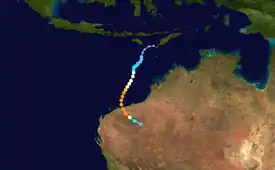
Tropical Cyclone John started as a low to the south-west of Timor on 9 December 1999. It rapidly intensified and moved towards the Pilbara coast of Western Australia. Just before landfall it was a severe category 5 storm with a central pressure of 915 hPa, with winds estimated at being up to 205 km/h (127 mph). The cyclone crossed the coast just to the west of Whim Creek between Port Hedland and Karratha on 8:30 am (WST) 15 December 1999. At the time of coastal crossing, it was estimated to have a central pressure between 930 and 940 hPa. The cyclone moved inland before dissipating the next day.
Port Hedland experienced gale-force winds for a period of 18 hours and near storm force winds with gusts to 124 km/h (77 mph) were observed on 15 December for most of the day. A maximum storm surge of 2 metres was recorded by the Port Hedland Authority at 6 am WST. At Karratha, on the western side of the circulation, the maximum wind gust recorded was 113 km/h (70 mph). At Cape Lambert, winds averaged 150 km/h (93 mph) for 5 hours with a maximum gust of 210 km/h (130 mph).[1]
There was some minor damage in Karratha. High winds and flooding caused extensive structural damage at many stations in the Pilbara and mining operations were suspended at many sites. The 113-year-old Whim Creek Hotel suffered major damage with the top floor lost, and the town of Newman experienced some flooding (500 mm (20 in) of rain was recorded). However, major towns in the Pilbara escaped any serious damage, and the damage was relatively light due to the sparseness of population in the area John hit. There were no deaths from John.[2]
Ten hours prior to landfall on the Australian coastline, John was moving southwards directly towards Karratha and Dampier. Had John failed to turn to the south-east like what it did, damage to the towns of Karratha, Dampier, Roebourne and Wickham caused by John would have been much worse.[3]
Severe Tropical Cyclone Kirrily
| Category 3 severe tropical cyclone (Australian scale) | |
| Category 2 tropical cyclone (SSHWS) | |
  | |
| Duration | 24 January – 2 February |
|---|---|
| Peak intensity | 140 km/h (85 mph) (10-min); 975 hPa (mbar) |
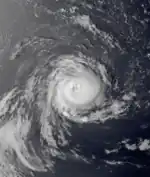
Tropical Cyclone Kirrily formed about 350 km (220 mi) east of the Cocos Islands on 24 January 2000 and moved west southwest towards the Western Australian coast. Kirrily intensified, reaching Category 2 status on 27 January. On 28 January, Kirrily turned southwest, moving away from the coast, weakening to below cyclone strength by 31 January, while located approximately 900 km (560 mi) west of Carnarvon. The lowest central pressure was estimated to have reached 970 hPa.[1]
Severe Tropical Cyclone Leon–Eline
| Category 3 severe tropical cyclone (Australian scale) | |
| Category 1 tropical cyclone (SSHWS) | |
  | |
| Duration | 1 February – 8 February (Exited basin) |
|---|---|
| Peak intensity | 140 km/h (85 mph) (10-min); 960 hPa (mbar) |
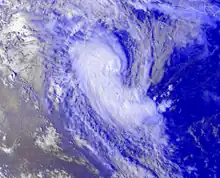
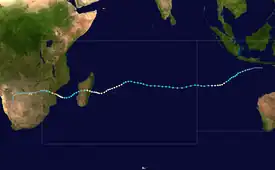
A low-pressure area developed within the monsoon trough on 1 February, while located about 250 km (160 mi) south of the Indonesian island of Bali.[4] The low formed due to a surge of energy within the monsoon that had crossed the equator from the northwest.[5] Associated convection was initially sparse, and over the subsequent few days the system tracked west-southwestward without much development,[4] moving around a large ridge over northwestern Australia.[5] There was initially moderate wind shear in the region, although an anticyclone was developing aloft,[6] which allowed the convection was able to persist over the center and gradually develop outflow.[7] Late on 3 February, the Perth Tropical Cyclone Warning Center (PTCWC) upgraded the tropical low to a Category 1 on the Australian tropical cyclone scale, estimating 10 minute sustained winds of 65 km/h (40 mph).[5] At 04:00 UTC the next day, the PTCWC named the storm Tropical Cyclone Leon. An hour prior, the Joint Typhoon Warning Center (JTWC) initiated advisories on Tropical Cyclone 11S, while the storm was located about 215 km (134 mi) south-southeast of Christmas Island.[7]
After becoming a named storm, Leon turned more to the west-southwest, due to a trough weakening the ridge to the south.[5] The storm developed increased convective banding, aided by decreasing wind shear, and quickly intensified.[4] Early on 5 February, the PTCWC upgraded Leon to a Category 3 on the Australian scale, estimating 10 minute winds of 120 km/h (75 mph). At 22:00 UTC that day, the agency estimated an initial peak of 140 km/h (87 mph).[5] On 6 February, the cyclone developed an eye in the center of the convection that was only visible on Special sensor microwave/imager, not on satellite imagery.[4] On the same day, the JTWC upgraded Leon to the equivalent of a minimal hurricane, estimating 1 minute winds of 140 km/h (87 mph).[8] A trough passing to the south increased wind shear, causing the storm to weaken.[4] Around that time, Leon passed about 510 km (320 mi) south of the Cocos Islands,[7] while turning more to the west after the ridge strengthened to the south. By 8 February, the circulation was exposed from the rapidly dwindling thunderstorms.[4] At 18:00 UTC that day, Leon crossed 90° E into the south-west Indian Ocean,[8]
Tropical Cyclone Marcia
| Category 1 tropical cyclone (Australian scale) | |
| Tropical storm (SSHWS) | |
  | |
| Duration | 14 February – 18 February |
|---|---|
| Peak intensity | 65 km/h (40 mph) (10-min); 995 hPa (mbar) |
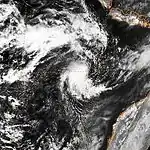
Marcia was a Category 1 cyclone that formed on 15 February, and remained quasi-stationary in the open Indian Ocean at around 15˚S, 103˚E. Perth issued its final warning on 17 February at 0400 UTC, downgrading to a tropical low. Marcia dissipated on 21 February. The lowest central pressure was 992 hPa achieved on 16 February at 1000 UTC.[9]
Tropical Cyclone Steve
| Category 2 tropical cyclone (Australian scale) | |
| Category 1 tropical cyclone (SSHWS) | |
  | |
| Duration | 27 February – 11 March |
|---|---|
| Peak intensity | 110 km/h (70 mph) (10-min); 975 hPa (mbar) |
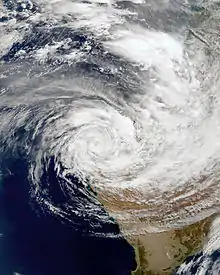
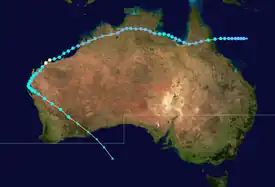
A long lived cyclone lasting 13 days, Steve actually made landfall four times on the Australian mainland. It formed on 25 February 2000 and crossed the Queensland coast north of Cairns the same day as a strong Category 2 in the Australian Scale. It weakened to a low and then redeveloped in the Gulf of Carpentaria. Steve then crossed into the Northern Territory and weakened again. The low then moved over the Indian Ocean near Broome and reformed again into a tropical cyclone. It intensified into a strong Category 2, reaching its peak intensity, and made landfall to the west of Karratha. It weakened to a Category 1 and emerged again over the Indian Ocean near Carnarvon. It finally made its fourth landfall as a weak Category 1 on 9 March 2000 near Shark Bay. It accelerated to the south-east towards Esperance and emerged over the Great Australian Bight where it became extratropical.[10]
There was extensive damage across a wide area of Australia, from Cairns in Queensland to Esperance in Western Australia on 11 March. Most of the damage was caused by severe flooding which resulted with costs in excess of $100 million (AUD). There were no reports of deaths from Cyclone Steve.[11]
Severe Tropical Cyclone Norman
| Category 5 severe tropical cyclone (Australian scale) | |
| Category 4 tropical cyclone (SSHWS) | |
  | |
| Duration | 29 February – 9 March (Exited basin) |
|---|---|
| Peak intensity | 205 km/h (125 mph) (10-min); 930 hPa (mbar) |
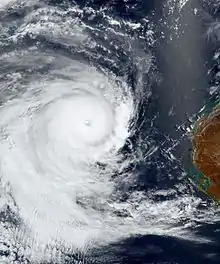
Severe Tropical Cyclone Norman developed from a low that moved off the west Kimberley coast on 29 February 2000. The cyclone tracked parallel to the Pilbara coastline for 3 days at a distance of about 250 km (160 mi), before continuing on a westward track away from the Western Australian coast. Norman quickly reached a peak intensity as a Category 4 cyclone on 2 March with a central pressure estimated at 920 hPa, while about 780 km (480 mi) to the west-northwest of Exmouth. Norman soon weakened over the following 2 days. During 6 March, the cyclone changed direction to a southerly track. The system finally dissipated on 8 March. Norman had no direct impact on Western Australia.[1]
Tropical Cyclone Olga
| Category 2 tropical cyclone (Australian scale) | |
| Tropical storm (SSHWS) | |
  | |
| Duration | 15 March – 20 March |
|---|---|
| Peak intensity | 95 km/h (60 mph) (10-min); 985 hPa (mbar) |
Olga formed from a low that developed in the Timor Sea on 15 March 2000. The low maintained a west southwest track, paralleling the Kimberley and Pilbara coasts. The low was named Tropical Cyclone Olga on 17 March while located approximately 570 km (350 mi) to the north of Exmouth. Olga intensified to Category 2 status with a central pressure of 980 hPa. By the 20th the system had weakened to a tropical low while located about 970 km (600 mi) to the west of Carnarvon. The system had no direct effect on Western Australia.[1]
Tropical Cyclone Hudah
| Category 2 tropical cyclone (Australian scale) | |
| Tropical storm (SSHWS) | |
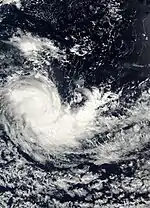 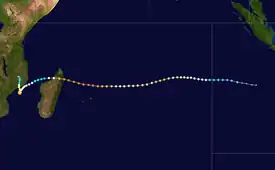 | |
| Duration | 24 March – 25 March (exited basin) |
|---|---|
| Peak intensity | 95 km/h (60 mph) (10-min); 994 hPa (mbar) |
Severe Tropical Cyclone Tessi
| Category 3 severe tropical cyclone (Australian scale) | |
| Tropical storm (SSHWS) | |
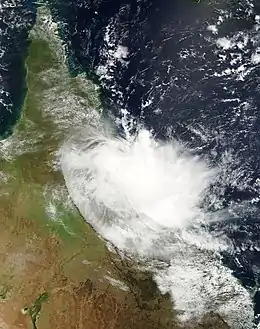 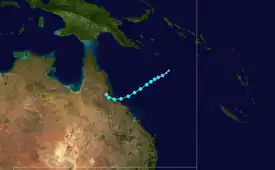 | |
| Duration | 1 April – 3 April |
|---|---|
| Peak intensity | 130 km/h (80 mph) (10-min); 980 hPa (mbar) |
A tropical low in the northern Coral Sea moved toward the coast, deepened into Tropical Cyclone Tessi on 2 April and crossed the coast near Bambaroo and Crystal Creek (80 km (50 mi) north of Townsville) early on 3 April as a Category 2 system on landfall.
Tessi's winds unroofed buildings, uprooted trees, downed power lines in the area between Ingham and Ayr. The Strand suffered wave damage with several boats destroyed. Heavy rain caused landslides on Townsville's Castle Hill destroying two homes and requiring the evacuation of another fifty homes. Considerable damage to personal property and to Townsville City infrastructure was reported. Townsville Aero reported a record April wind gust of 130 km/h (81 mph), a record April daily rainfall total of 271.6 mm (10.69 in) and the cyclone was the main contribution to a record April monthly total of 546.2 mm (21.50 in). In addition, moderate damage was also reported throughout Magnetic Island and the then Thuringowa.
Minor to moderate flooding in the Haughton River increased to major in the lower reaches with the highest level since the start of records in 1978 being recorded at Giru.[12]
Tropical Cyclone Vaughan
| Category 2 tropical cyclone (Australian scale) | |
| Tropical storm (SSHWS) | |
  | |
| Duration | 3 April (Entered basin) – 7 April |
|---|---|
| Peak intensity | 110 km/h (70 mph) (10-min); 975 hPa (mbar) |
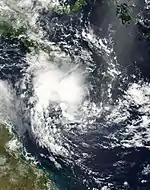
A tropical low was first identified near New Caledonia on 29 March. The low tracked northwest through the Coral Sea to become Tropical Cyclone Vaughan early on 4 April. The system rapidly intensified to Category 2 during the morning of the 4th and tracked westward toward the north Queensland tropical coast. Cyclone Vaughan weakened a little during 5 April and was downgraded to a Category 1 system before re-intensifying to Category 2 early on 6 April. However, by late morning on the 6th the system again rapidly weakened and was downgraded below cyclone strength during the afternoon. The remnants of Cyclone Vaughan drifted slowly northwest and dissipated during 7 April. There was no evidence of any significant impact on the coast from Vaughan.[12]
Severe Tropical Cyclone Paul
| Category 5 severe tropical cyclone (Australian scale) | |
| Category 4 tropical cyclone (SSHWS) | |
  | |
| Duration | 11 April – 20 April |
|---|---|
| Peak intensity | 220 km/h (140 mph) (10-min); 915 hPa (mbar) |
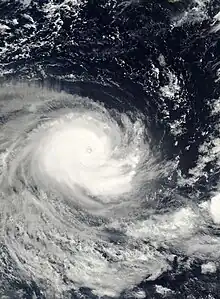
Paul formed about 1,000 km (620 mi) north of Karratha on 13 April 2000 and moved west, away from the West Australian coastline, thus never posing any threat to coastal communities. The cyclone showed rapid intensification and Severe Tropical Cyclone Paul reached Category 5 status during 15 April, and the lowest central pressure was estimated to have been about 920 hPa the following day. Severe Tropical Cyclone Paul passed about 200 km (120 mi) to the south of the Cocos (Keeling) Islands during the 17th and the central pressure was estimated to be about 940 hPa. Wind gusts at Cocos Islands were in the order of around 50 km/h (31 mph). TC Paul continued to weaken as the system followed a general west-south-west track across the Indian Ocean. The cyclone slowed to be almost stationary on 20 April and weakened to below cyclone strength. Perth issued the final warning for TC Paul on 20 April when the Category 1 cyclone was in the vicinity of latitude 14.7° south and longitude 94.3° east.[1]
Severe Tropical Cyclone Rosita
| Category 5 severe tropical cyclone (Australian scale) | |
| Category 4 tropical cyclone (SSHWS) | |
  | |
| Duration | 14 April – 21 April |
|---|---|
| Peak intensity | 220 km/h (140 mph) (10-min); 930 hPa (mbar) |
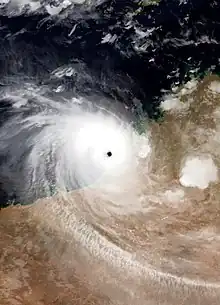
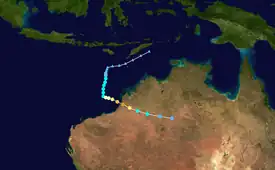
Rosita was named on 17 April while located 670 km (420 mi) north of Port Hedland. It rapidly intensified into a Category 5 storm on 19 April while moving to the east-south-east. Rosita struck the Kimberley coast as a Category 4 at 0100 hours WST on 20 April 2000, 40 km (25 mi) south of Broome. According to the Bureau of Meteorology, Rosita made landfall as a Category 5 cyclone.[13] Its lowest central pressure was estimated to be 930 hPa a couple of hours prior to landfall. The small cyclone left severe structural damage in Eco Beach tourist resort, Yardoogarra and Thangoo Stations. Elsewhere there was considerable tree and powerline damage.[1]
Other systems
On 2 December, TCWC Brisbane reported that a tropical low had developed within a monsoonal trough about 325 km (202 mi) to the north of Cook Town.[2] During that day the low moved eastwards while weakening, before TCWC Brisbane issued the final bulletin on the low early the next day.[2]
On 10 January, a tropical low developed to the northwest of Cairns. It moved to the southeast before it was last noted, the next day.
On 19 February, a weak tropical low formed about 225 km to the east-southeast of Townsville. It became stationary until it was last seen on the same day. There is a possibility that Steve formed from the remnant of this low.
A tropical low was seen beginning to form, while located over the Solomon Sea on 14 March. It moved to the southeast before it was last noted while dissipating on 16 March, to the north of Townsville.
On 26 April, a tropical low was detected to the west of Cooktown. It moved to the west, before turning north and to the east, until it entered the South Pacific basin on 31 April. It meandered on the basin, before reentering the Australian basin on 2 May. It accelerated to the west until it was last noted near Mackay on the same day. It also possessed gale-force winds; however, like the low that formed two days later, it wasn't named.
The last system of the season formed on 20 May as a tropical low to the south of the Solomon Islands. It was last seen on 23 May as it entered the South Pacific basin.
Seasonal effects
| Name | Dates | Peak intensity | Areas affected | Damage (USD) |
Deaths | Refs | ||
|---|---|---|---|---|---|---|---|---|
| Category | Wind speed | Pressure | ||||||
| TL | 2–3 December | Tropical Low | Not specified | 1,002 hPa (29.59 inHg) | Cape York | None | None | |
| Ilsa | 9–17 December | Category 2 tropical cyclone | 100 km/h (62 mph) | 980 hPa (28.94 inHg) | Western Australia | |||
| John | 9–16 December | Category 5 severe tropical cyclone | 205 km/h (127 mph) | 915 hPa (27.02 inHg) | Pilbara, Western Australia | |||
| TL | 21–23 January | Tropical Low | ||||||
| Kirrily | 24 January – 2 February | Category 3 severe tropical cyclone | 140 km/h (85 mph) | 975 hPa (28.79 inHg) | None | None | None | [14] |
| Leon | 1–8 February | Category 3 severe tropical cyclone | 140 km/h (87 mph) | 960 hPa (28.35 inHg) | ||||
| Marcia | 14 – 18 February 2000 | Category 1 tropical cyclone | 65 km/h (40 mph) | 995 hPa (29.38 inHg) | None | None | None | [15] |
| Steve | 25 February – 11 March 2000 | Category 2 tropical cyclone | 110 km/h (70 mph) | 975 hPa (28.79 inHg) | Northern Australia, Western Australia | Unknown | Unknown | [16] |
| Norman | 29 February – 9 March | Category 4 severe tropical cyclone | 185 km/h (115 mph) | 930 hPa (27.46 inHg) | Western Australia | |||
| Olga | 14 – 20 March 2000 | Category 2 tropical cyclone | 95 km/h (60 mph) | 985 hPa (29.09 inHg) | None | None | None | [17] |
| Hudah | 22 – 25 March 2000 | Category 2 tropical cyclone | 95 km/h (60 mph) | 984 hPa (29.06 inHg) | Madagascar, Mozambique | Unknown | Unknown | [18] |
| Tessi | 1–3 April | Category 3 severe tropical cyclone | 140 km/h (87 mph) | 980 hPa (28.94 inHg) | Queensland | |||
| Vaughan | 3 – 7 April 2000 | Category 2 tropical cyclone | 110 km/h (70 mph) | 985 hPa (29.09 inHg) | Queensland | Unknown | Unknown | [19] |
| Paul | 11–20 April | Category 5 severe tropical cyclone | 205 km/h (127 mph) | 915 hPa (27.02 inHg) | Cocos Islands | |||
| Rosita | 14–21 April | Category 5 severe tropical cyclone | 205 km/h (127 mph) | 930 hPa (27.46 inHg) | Western Australia | |||
| 24F | May 20–23 | Tropical Low | 75 km/h (47 mph) | 1,002 hPa (29.59 inHg) | None | None | None | [20][21] |
| Season aggregates | ||||||||
| 14 | 2 December–23 May | 205 km/h (127 mph) | 915 hPa (27.02 inHg) | Unknown | Unknown | |||
Storm names
Most tropical cyclones in the region are assigned names by the Australian Bureau of Meteorology. Tropical cyclones are named if they are non-frontal low-pressure systems of synoptic scale developing over warm waters, or if Dvorak intensity analysis indicate the presence of gale force or stronger winds near the centre. Therefore, tropical systems with gales in one or more quadrants, but not near the centre, are not named.[22] All names assigned in the Australian region are selected sequentially. Only the names used during this cyclone season are listed below. The complete list of names for each basin are found in the World Meteorological Organization's official lists.[23]
Each Australian Tropical Cyclone Warning Centre (Perth, Darwin, and Brisbane) maintains a list of names arranged alphabetically and alternating male and female. Tropical cyclones that develop in the South-East Indian Ocean are assigned names by the Tropical Cyclone Warning Centre in Perth. This region includes the areas east of 90°E, south of the Equator, and west of 125°E. Tropical cyclones that develop south of the Equator between 125°E and 141°E are assigned names by the Tropical Cyclone Warning Centre in Darwin, Northern Territory. This area includes most of the cyclones that form in the Arafura Sea and Western Gulf of Carpentaria. Tropical cyclones in the Coral Sea and Eastern Gulf of Carpentaria between 141°E and 160°E and south of 10°S are assigned names by the Tropical Cyclone Warning Centre in Brisbane, Queensland.[23]
Perth
Brisbane
- Steve — Tessi — Vaughan
No storms formed in Darwin region during the 1999–2000 season. However, Cyclone Steve was named by TCWC Brisbane before passing through the warning area of Darwin. Additionally, the Tropical Cyclone Warning Centre in Port Moresby, Papua New Guinea reserves the right to name cyclones that develop in the Solomon Sea and Gulf of Papua, north of 10°S between 141°E and 160°E. Names are selected randomly from their list and retired once they are used.[24] No cyclones were named by this warning centre during the 1999–2000 season.
See also
References
- Bureau of Meteorology. "BoM — WA Tropical Cyclone Season Summary 1999-00". Bureau of Meteorology. Archived from the original on 28 August 2006. Retrieved 7 August 2006.
- Padgett, Gary. "Monthly Global Tropical Cyclone Summary December 1999". Archived from the original on 11 February 2012.
- Bureau of Meteorology. "Report on John, Steve and Rosita" (PDF). Archived (PDF) from the original on 28 August 2006. Retrieved 7 August 2006.
- Cyclone Season 1999–2000. RSMC La Reunion (Report). Météo-France. Retrieved 15 July 2014.
- Tropical Cyclone Leon (PDF) (Report). Australian Bureau of Meteorology. Retrieved 15 July 2014.
- Darwin Regional Specialised Meteorological Centre (February 2000). "Darwin Tropical Diagnostic Statement" (PDF). 19 (2). Bureau of Meteorology: 2. Retrieved 15 July 2014.
{{cite journal}}: Cite journal requires|journal=(help) - "Monthly Global Tropical Cyclone Summary February 2000". Retrieved 15 July 2014.
- Kenneth R. Knapp; Michael C. Kruk; David H. Levinson; Howard J. Diamond; Charles J. Neumann (2010). 2000 Eline:Leon:Leone_Eline (2000032S11115). The International Best Track Archive for Climate Stewardship (IBTrACS): Unifying tropical cyclone best track data (Report). Bulletin of the American Meteorological Society. Archived from the original on 30 September 2015. Retrieved 15 July 2014.
- Gary Padgett. "CYCLONE TRACKS, FEBRUARY 2000". Retrieved 7 August 2006.
- Bureau of Meteorology. "Bureau — Tropical Cyclone Steve". Bureau of Meteorology. Retrieved 16 June 2006.
- Bureau of Meteorology. "BoM-Impact from Steve". Bureau of Meteorology. Retrieved 16 June 2006.
- Bureau of Meteorology. "SIGNIFICANT WEATHER — APRIL 2000". Bureau of Meteorology. Retrieved 7 July 2006.
- "Microsoft Word — Tropical Cyclone Rosita_report.doc" (PDF). Retrieved 28 January 2011.
- "2000 Tropical Cyclone Kirrily (2000024S12100)". International Best Track Archive for Climate Stewardship. Retrieved 25 May 2022.
- "2000 Tropical Cyclone Marcia (2000045S14100)". International Best Track Archive for Climate Stewardship. Retrieved 25 May 2022.
- "2000 Tropical Cyclone Steve (2000056S17152)". International Best Track Archive for Climate Stewardship. Retrieved 25 May 2022.
- "2000 Tropical Cyclone Olga (2000075S17119)". International Best Track Archive for Climate Stewardship. Retrieved 25 May 2022.
- Tropical Cyclone Hudah (PDF) (Report). Australian Bureau of Meteorology. Retrieved 31 May 2022.
- "2000 Tropical Cyclone Vaughan (2000089S20168)". International Best Track Archive for Climate Stewardship. Retrieved 25 May 2022.
- Padgett, Gary. "Monthly Global Tropical Cyclone Summary May 2000". Retrieved 29 July 2014.
- Padgett, Gary. "Monthly Global Tropical Cyclone Tracks May 2000". Retrieved 29 July 2014.
- "Tropical Cyclones: Frequently Asked Questions". Australian Government Bureau of Meteorology. Retrieved 15 August 2008.
- "Tropical Cyclone Operational Plan for the South Pacific and South-East Indian Ocean". World Meteorological Organization. 1999. Retrieved 15 August 2008.
- "Tropical Cyclone Operational Plan for the South Pacific and South-East Indian Ocean" (PDF). World Meteorological Organization. 2006. Archived (PDF) from the original on 11 September 2008. Retrieved 15 August 2008.
External links
- Joint Typhoon Warning Center (JTWC) Archived 1 March 2010 at the Wayback Machine
- Fiji Meteorological Service (RSMC Nadi)
- World Meteorological Organization
- RA V Tropical Cyclone Committee Final Report
- WMO Annual Summary of Global Tropical Cyclone Seasons 2000
- Joint Typhoon Warning Center 2000 ATCR Archived 21 February 2013 at the Wayback Machine
- Raw cyclone track data
- BoM Monthly Significant Weather Summaries
- BoM 1999-2000 Annual Weather Report
- 1999-00 Annual Summary (Western Australia)
- July 1999 to June 2000 Tropical Cyclone Summaries and Operational Track Data
- Gary Padgett's Southern Hemisphere 1999-2000 Tropical Cyclone Season Review