1972 United States presidential election in North Carolina
The 1972 United States presidential election in North Carolina took place on November 7, 1972, as part of the 1972 United States presidential election. Voters chose 13 representatives, or electors to the Electoral College, who voted for president and vice president.
| ||||||||||||||||||||||||||
| ||||||||||||||||||||||||||

| ||||||||||||||||||||||||||
| ||||||||||||||||||||||||||
.jpg.webp)
_(3x4-1).jpg.webp)
| Elections in North Carolina |
|---|
 |
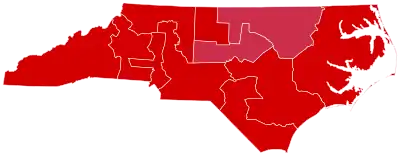
McGovern won only the typically extremely strong Democratic counties of Northampton and Orange – two counties with a record of having voted Democratic at every election since 1912, apart from Orange County’s vote against the Catholic Al Smith in 1928.[1] Even in these counties, where most Democratic candidates expect to receive well over sixty percent of the vote and Walter Mondale in his disastrous 1984 loss won by over 13 percent,[2]
This is the first election in which a presidential candidate won North Carolina with more than 1,000,000 votes.[3] This is also the best Republican presidential election performance in the history of the state.[3]
78% of white voters supported Nixon while 20% supported McGovern.[4][5]
Polls
| Source | Rating | As of |
|---|---|---|
| Corvallis Gazette-Times[6] | Safe R | September 19, 1972 |
| The Bradenton Herald[7] | Certain R | October 9, 1972 |
| The Austin American[8] | Certain R | November 1, 1972 |
| Sun Herald[9] | Certain R | November 5, 1972 |
Results
| 1972 United States presidential election in North Carolina[10] | |||||
|---|---|---|---|---|---|
| Party | Candidate | Votes | Percentage | Electoral votes | |
| Republican | Richard Nixon (incumbent) | 1,054,889 | 69.46% | 13 | |
| Democratic | George McGovern | 438,705 | 28.89% | 0 | |
| American Independent | John G. Schmitz | 25,018 | 1.65% | 0 | |
| Write-ins[lower-alpha 1] | Various candidates | 162 | 0.01% | 0 | |
| Totals | 1,518,774 | 100.0% | 13 | ||
| Voter turnout | 44.35% | — | |||
Results by county
| County | Richard Milhous Nixon Republican |
George Stanley McGovern Democratic |
John George Schmitz American |
Margin | ||||
|---|---|---|---|---|---|---|---|---|
| % | # | % | # | % | # | % | # | |
| Avery | 83.99% | 3,510 | 15.00% | 627 | 1.01% | 42 | 68.99% | 2,883 |
| Mitchell | 83.45% | 4,240 | 15.74% | 800 | 0.81% | 41 | 67.70% | 3,440 |
| Henderson | 80.17% | 12,134 | 17.85% | 2,701 | 1.98% | 300 | 62.33% | 9,433 |
| Onslow | 80.05% | 10,343 | 18.76% | 2,424 | 1.19% | 154 | 61.29% | 7,919 |
| Yadkin | 79.16% | 6,824 | 18.47% | 1,592 | 2.38% | 205 | 60.69% | 5,232 |
| Johnston | 79.24% | 14,272 | 19.37% | 3,488 | 1.39% | 251 | 59.87% | 10,784 |
| Craven | 78.74% | 9,372 | 20.03% | 2,384 | 1.23% | 147 | 58.71% | 6,988 |
| Davie | 75.69% | 5,613 | 21.28% | 1,578 | 3.03% | 225 | 54.41% | 4,035 |
| Randolph | 76.02% | 18,724 | 21.71% | 5,346 | 2.27% | 559 | 54.32% | 13,378 |
| Cabarrus | 76.45% | 18,384 | 22.19% | 5,336 | 1.36% | 328 | 54.26% | 13,048 |
| Gaston | 75.76% | 27,956 | 22.93% | 8,462 | 1.31% | 483 | 52.83% | 19,494 |
| Greene | 75.68% | 2,788 | 22.99% | 847 | 1.33% | 49 | 52.69% | 1,941 |
| Davidson | 74.79% | 24,875 | 23.12% | 7,691 | 2.09% | 696 | 51.66% | 17,184 |
| Alamance | 74.61% | 22,046 | 23.12% | 6,833 | 2.27% | 670 | 51.48% | 15,213 |
| New Hanover | 74.41% | 19,060 | 23.01% | 5,894 | 2.58% | 661 | 51.40% | 13,166 |
| Iredell | 73.79% | 16,736 | 22.43% | 5,088 | 3.78% | 858 | 51.35% | 11,648 |
| Dare | 75.20% | 1,986 | 24.01% | 634 | 0.80% | 21 | 51.19% | 1,352 |
| Catawba | 74.46% | 24,106 | 23.92% | 7,744 | 1.62% | 525 | 50.54% | 16,362 |
| Harnett | 74.64% | 10,259 | 24.35% | 3,347 | 1.00% | 138 | 50.29% | 6,912 |
| Carteret | 74.14% | 8,463 | 24.57% | 2,805 | 1.29% | 147 | 49.57% | 5,658 |
| Lenoir | 73.89% | 11,065 | 24.52% | 3,672 | 1.59% | 238 | 49.37% | 7,393 |
| Rowan | 73.34% | 20,735 | 24.17% | 6,834 | 2.49% | 705 | 49.17% | 13,901 |
| Wilson | 73.04% | 12,060 | 25.23% | 4,166 | 1.73% | 286 | 47.81% | 7,894 |
| Lee | 72.71% | 5,836 | 25.22% | 2,024 | 2.07% | 166 | 47.50% | 3,812 |
| Wilkes | 72.83% | 13,105 | 25.75% | 4,634 | 1.42% | 255 | 47.08% | 8,471 |
| McDowell | 72.09% | 6,570 | 25.76% | 2,348 | 2.15% | 196 | 46.32% | 4,222 |
| Nash | 71.39% | 12,679 | 25.35% | 4,503 | 3.26% | 579 | 46.03% | 8,176 |
| Wayne | 72.33% | 14,352 | 26.38% | 5,234 | 1.29% | 256 | 45.95% | 9,118 |
| Cleveland | 72.06% | 13,726 | 26.22% | 4,994 | 1.72% | 328 | 45.84% | 8,732 |
| Person | 71.89% | 5,941 | 27.18% | 2,246 | 0.93% | 77 | 44.71% | 3,695 |
| Caldwell | 71.41% | 12,976 | 26.89% | 4,886 | 1.70% | 309 | 44.52% | 8,090 |
| Union | 71.60% | 10,264 | 27.11% | 3,886 | 1.30% | 186 | 44.49% | 6,378 |
| Hyde | 69.28% | 1,112 | 25.11% | 403 | 5.61% | 90 | 44.17% | 709 |
| Rockingham | 71.15% | 14,519 | 27.10% | 5,530 | 1.75% | 358 | 44.05% | 8,989 |
| Moore | 70.68% | 9,406 | 27.25% | 3,627 | 2.07% | 275 | 43.43% | 5,779 |
| Columbus | 70.64% | 8,468 | 27.57% | 3,305 | 1.79% | 214 | 43.07% | 5,163 |
| Buncombe | 70.38% | 32,091 | 27.69% | 12,626 | 1.92% | 877 | 42.69% | 19,465 |
| Duplin | 70.61% | 7,153 | 28.20% | 2,857 | 1.18% | 120 | 42.41% | 4,296 |
| Transylvania | 69.73% | 5,860 | 27.62% | 2,321 | 2.65% | 223 | 42.11% | 3,539 |
| Wake | 70.32% | 56,808 | 28.23% | 22,807 | 1.45% | 1,174 | 42.09% | 34,001 |
| Cumberland | 70.46% | 24,376 | 28.48% | 9,853 | 1.06% | 366 | 41.98% | 14,523 |
| Pitt | 70.41% | 14,406 | 28.63% | 5,858 | 0.95% | 195 | 41.78% | 8,548 |
| Brunswick | 69.06% | 6,153 | 28.06% | 2,500 | 2.87% | 256 | 41.00% | 3,653 |
| Beaufort | 69.65% | 6,915 | 29.22% | 2,901 | 1.13% | 112 | 40.43% | 4,014 |
| Stanly | 69.32% | 12,459 | 29.03% | 5,218 | 1.64% | 295 | 40.29% | 7,241 |
| Guilford | 69.46% | 61,381 | 29.20% | 25,800 | 1.34% | 1,185 | 40.27% | 35,581 |
| Alexander | 68.95% | 5,865 | 29.01% | 2,468 | 2.03% | 173 | 39.94% | 3,397 |
| Macon | 69.20% | 4,134 | 29.28% | 1,749 | 1.52% | 91 | 39.92% | 2,385 |
| Pender | 68.90% | 3,327 | 29.30% | 1,415 | 1.80% | 87 | 39.59% | 1,912 |
| Burke | 68.96% | 14,447 | 29.58% | 6,197 | 1.46% | 306 | 39.38% | 8,250 |
| Franklin | 68.37% | 5,431 | 29.47% | 2,341 | 2.17% | 172 | 38.90% | 3,090 |
| Rutherford | 68.80% | 9,506 | 29.97% | 4,140 | 1.23% | 170 | 38.84% | 5,366 |
| Mecklenburg | 68.52% | 77,546 | 29.80% | 33,730 | 1.68% | 1,900 | 38.71% | 43,816 |
| Martin | 68.76% | 4,188 | 30.21% | 1,840 | 1.03% | 63 | 38.55% | 2,348 |
| Surry | 67.78% | 10,497 | 30.39% | 4,706 | 1.83% | 284 | 37.39% | 5,791 |
| Forsyth | 67.69% | 46,415 | 30.52% | 20,928 | 1.79% | 1,226 | 37.17% | 25,487 |
| Polk | 67.31% | 3,121 | 30.54% | 1,416 | 2.16% | 100 | 36.77% | 1,705 |
| Currituck | 66.67% | 1,578 | 30.33% | 718 | 3.00% | 71 | 36.33% | 860 |
| Stokes | 66.86% | 7,118 | 30.57% | 3,254 | 2.57% | 274 | 36.30% | 3,864 |
| Halifax | 66.60% | 8,908 | 31.71% | 4,241 | 1.69% | 226 | 34.89% | 4,667 |
| Vance | 66.85% | 6,491 | 32.10% | 3,117 | 1.05% | 102 | 34.75% | 3,374 |
| Granville | 66.82% | 6,037 | 32.30% | 2,918 | 0.89% | 80 | 34.52% | 3,119 |
| Chowan | 66.39% | 1,906 | 32.60% | 936 | 1.01% | 29 | 33.79% | 970 |
| Montgomery | 65.67% | 4,417 | 32.34% | 2,175 | 1.99% | 134 | 33.33% | 2,242 |
| Pamlico | 66.11% | 1,847 | 32.89% | 919 | 1.00% | 28 | 33.21% | 928 |
| Sampson | 65.76% | 9,684 | 33.19% | 4,888 | 1.05% | 154 | 32.57% | 4,796 |
| Haywood | 64.84% | 8,903 | 32.88% | 4,515 | 2.28% | 313 | 31.96% | 4,388 |
| Clay | 65.19% | 1,545 | 33.63% | 797 | 1.18% | 28 | 31.56% | 748 |
| Bladen | 64.72% | 4,205 | 33.88% | 2,201 | 1.40% | 91 | 30.85% | 2,004 |
| Swain | 64.45% | 2,052 | 34.58% | 1,101 | 0.97% | 31 | 29.87% | 951 |
| Pasquotank | 63.07% | 3,906 | 34.15% | 2,115 | 2.78% | 172 | 28.92% | 1,791 |
| Scotland | 63.69% | 3,485 | 35.42% | 1,938 | 0.90% | 49 | 28.27% | 1,547 |
| Perquimans | 62.57% | 1,299 | 34.83% | 723 | 2.60% | 54 | 27.75% | 576 |
| Edgecombe | 62.53% | 8,244 | 35.16% | 4,635 | 2.31% | 305 | 27.37% | 3,609 |
| Ashe | 62.95% | 5,784 | 36.06% | 3,313 | 0.99% | 91 | 26.89% | 2,471 |
| Watauga | 62.85% | 6,017 | 36.05% | 3,451 | 1.10% | 105 | 26.80% | 2,566 |
| Cherokee | 62.28% | 4,113 | 36.51% | 2,411 | 1.21% | 80 | 25.77% | 1,702 |
| Chatham | 62.12% | 6,175 | 36.46% | 3,624 | 1.43% | 142 | 25.66% | 2,551 |
| Lincoln | 61.88% | 8,597 | 36.71% | 5,100 | 1.40% | 195 | 25.17% | 3,497 |
| Washington | 61.65% | 2,559 | 37.24% | 1,546 | 1.11% | 46 | 24.40% | 1,013 |
| Alleghany | 61.29% | 2,158 | 37.03% | 1,304 | 1.68% | 59 | 24.25% | 854 |
| Durham | 61.38% | 25,576 | 37.36% | 15,566 | 1.26% | 525 | 24.02% | 10,010 |
| Camden | 60.20% | 909 | 36.82% | 556 | 2.98% | 45 | 23.38% | 353 |
| Anson | 60.88% | 3,551 | 37.51% | 2,188 | 1.61% | 94 | 23.37% | 1,363 |
| Richmond | 60.84% | 5,692 | 37.49% | 3,508 | 1.67% | 156 | 23.34% | 2,184 |
| Graham | 61.05% | 1,699 | 37.98% | 1,057 | 0.97% | 27 | 23.07% | 642 |
| Madison | 61.18% | 3,273 | 38.11% | 2,039 | 0.71% | 38 | 23.07% | 1,234 |
| Bertie | 60.54% | 2,874 | 38.32% | 1,819 | 1.14% | 54 | 22.22% | 1,055 |
| Caswell | 59.65% | 2,983 | 38.43% | 1,922 | 1.92% | 96 | 21.22% | 1,061 |
| Robeson | 59.99% | 11,362 | 39.02% | 7,391 | 0.99% | 188 | 20.97% | 3,971 |
| Warren | 59.62% | 2,603 | 38.89% | 1,698 | 1.49% | 65 | 20.73% | 905 |
| Jones | 58.93% | 1,650 | 39.04% | 1,093 | 2.04% | 57 | 19.89% | 557 |
| Jackson | 59.11% | 4,709 | 39.78% | 3,169 | 1.12% | 89 | 19.33% | 1,540 |
| Tyrrell | 59.30% | 676 | 40.26% | 459 | 0.44% | 5 | 19.04% | 217 |
| Hertford | 58.34% | 2,794 | 40.26% | 1,928 | 1.40% | 67 | 18.08% | 866 |
| Yancey | 57.10% | 3,106 | 41.88% | 2,278 | 1.03% | 56 | 15.22% | 828 |
| Hoke | 56.25% | 1,927 | 42.79% | 1,466 | 0.96% | 33 | 13.46% | 461 |
| Gates | 51.01% | 1,264 | 47.50% | 1,177 | 1.49% | 37 | 3.51% | 87 |
| Northampton | 47.71% | 2,997 | 51.46% | 3,233 | 0.83% | 52 | -3.76% | -236 |
| Orange | 47.66% | 11,632 | 51.76% | 12,634 | 0.58% | 142 | -4.11% | -1,002 |
Notes
- These write-in votes were not separated by county but given only as a state-wide total.[11]
References
- Sullivan, Robert David; ‘How the Red and Blue Map Evolved Over the Past Century’; America Magazine in The National Catholic Review; June 29, 2016
- David Leip’s Atlas of U.S. Presidential Elections; 1984 Presidential General Election Data Graphs – North Carolina
- "Presidential General Election Results Comparison – North Carolina". David Leip’s Atlas of U.S. Presidential Elections.
- Black & Black 1992, p. 295.
- Black & Black 1992, p. 335.
- "Nixon May Sweep Dixie States". Corvallis Gazette-Times. Corvallis, Oregon. September 19, 1972. p. 24.
- Phillips, Kevin P. (October 9, 1972). "Dixie May Swing Political Future". The Bradenton Herald. Bradenton, Florida. p. 7-B.
- Furgursson, Ernest B. (October 25, 1972). "By Democrats in South — National Issues Ignored". The Austin American. Austin, Texas. p. 4.
- "Nixon Expected To Sweep South". Sun Herald. Biloxi, Mississippi. November 5, 1972. p. C-9.
- "1972 Presidential General Election Data Graphs – North Carolina". David Leip’s Atlas of U.S. Presidential Elections.
- Our Campaigns; NC US President Race, November 07, 1972
Works cited
- Black, Earl; Black, Merle (1992). The Vital South: How Presidents Are Elected. Harvard University Press. ISBN 0674941306.
