Waltham Forest London Borough Council elections
Waltham Forest London Borough Council in London is elected every four years. Since the last boundary changes in 2002, 60 councillors have been elected from 20 wards, with 3 councillors per ward.

Political control
The first election to the council was held in 1964, initially operating as a shadow authority ahead of the new system coming into full effect the following year. Political control of the council since 1964 has been held by the following parties:
| Party in control | Years | |
|---|---|---|
| Labour | 1964–1968 | |
| Conservative | 1968–1971 | |
| Labour | 1971–1994 | |
| No overall control | 1994–1998 | |
| Labour | 1998–2002 | |
| No overall control | 2002–2010 | |
| Labour | 2010–present | |
Leadership
The leaders of the council since 1965 have been:[1][2]
| Councillor | Party | From | To | |
|---|---|---|---|---|
| Herbert Palethorpe | Labour | 1965 | 1968 | |
| Tom Brandon | Conservative | 1968 | 1971 | |
| Bill Pearmine | Labour | 1971 | 1982 | |
| Gerald King | Conservative | 1982 | 1986 | |
| Neil Gerrard | Labour | 1986 | 1990 | |
| Clive Morton | Labour | 1990 | 1992 | |
| Evan Jones | Labour | 1992 | 1994 | |
| Huw Morgan-Thomas | Labour | 1994 | 1998 | |
| Tony Buckley | Labour | 1998 | 30 Jul 2003 | |
| Clyde Loakes | Labour | 30 Jul 2003 | 21 May 2009 | |
| Chris Robbins | Labour | 21 May 2009 | 25 May 2017 | |
| Clare Coghill | Labour | 25 May 2017 | 2 Sep 2021 | |
| Grace Williams | Labour | 2 Sep 2021 | ||
Council elections
Summary of the council composition after recent council elections, click on the year for full details of each election.
| Year | Labour | Conservative | Liberal Democrats | Independent | Notes |
|---|---|---|---|---|---|
| 1964 | 33 | 3 | 0 | 9 | |
| 1968 | 4 | 44 | 0 | 0 | |
| 1971 | 39 | 9 | 0 | 0 | |
| 1974 | 36 | 12 | 0 | 0 | |
| 1978 | 36 | 21 | 0 | 0 | Boundary changes increased the number of seats by 11.[3] |
| 1982 | 26 | 25 | 6 | 0 | |
| 1986 | 31 | 16 | 10 | 0 | |
| 1990 | 30 | 16 | 11 | 0 | |
| 1994 | 27 | 16 | 14 | 0 | Boundary changes took place but the number of seats remained the same.[n 1][n 2] |
| 1998 | 30 | 15 | 12 | 0 | Boundary changes took place but the number of seats remained the same.[n 3] |
| 2002 | 29 | 18 | 13 | 0 | Boundary changes increased the number of seats by 3.[4] |
| 2006 | 26 | 15 | 19 | 0 | |
| 2010 | 36 | 18 | 6 | 0 | |
| 2014 | 44 | 16 | 0 | 0 | |
| 2018 | 46 | 14 | 0 | 0 | |
| 2022 | 47 | 13 | 0 | 0 | |
Borough result maps
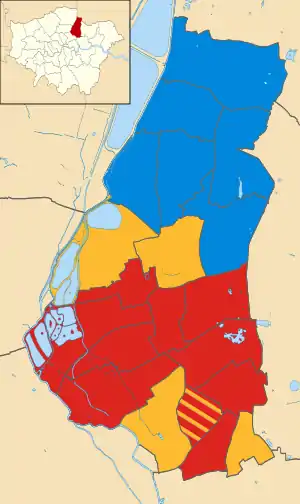
 2002 results map
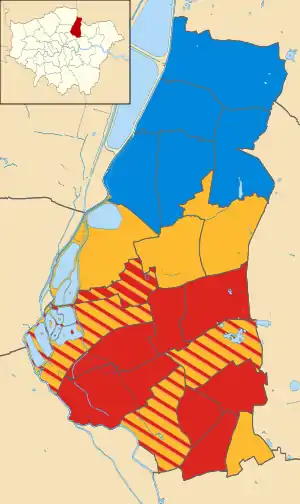
 2006 results map
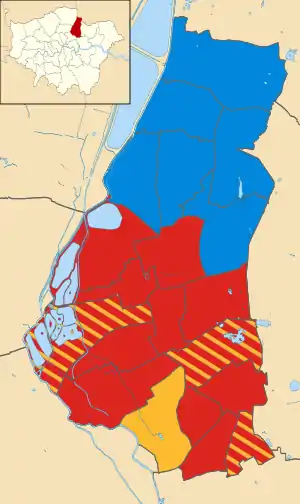
 2010 results map
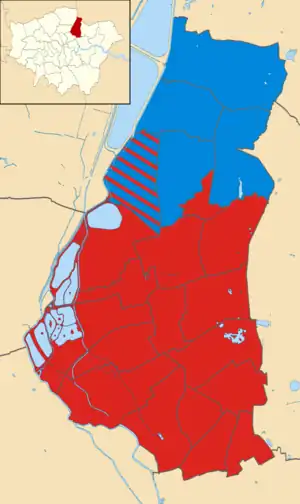
 2014 results map
 2018 results map
By-election results
1964-1968
There were no by-elections.[5]
1968-1971
| Party | Candidate | Votes | % | ±% | |
|---|---|---|---|---|---|
| Labour | P. L. Leighton | 1230 | |||
| Conservative | F. Barnes | 363 | |||
| Liberal | L. C. A. Roskilly | 95 | |||
| Turnout | 16.8% | ||||
1971-1974
| Party | Candidate | Votes | % | ±% | |
|---|---|---|---|---|---|
| Labour | H. M. Cohen | 1,324 | |||
| Conservative | Mrs E. J. White | 839 | |||
| Communist | R. A. Sayers | 78 | |||
| Turnout | 21.4% | ||||
| Party | Candidate | Votes | % | ±% | |
|---|---|---|---|---|---|
| Labour | K. Gordon | 1,796 | |||
| Conservative | J. Watson | 1,396 | |||
| Liberal | G. E. Caryer | 306 | |||
| Turnout | 33.1% | ||||
| Party | Candidate | Votes | % | ±% | |
|---|---|---|---|---|---|
| Labour | N. F. Gerrard | 1,056 | |||
| Liberal | M. P. O'Flanagan | 512 | |||
| Residents | D. R. South | 363 | |||
| Conservative | Mrs B. R. Eden | 180 | |||
| Ratepayers Association | H. L. Rider | 163 | |||
| Turnout | 26.0% | ||||
1974-1978
| Party | Candidate | Votes | % | ±% | |
|---|---|---|---|---|---|
| Conservative | Reginald B. Lewis | 1,284 | |||
| Labour | Joseph Levy | 785 | |||
| National Front | Donald R. South | 356 | |||
| The Centre Party | Ronald W. Garner | 283 | |||
| Ratepayers | Wilfred Atkinson | 241 | |||
| Liberal | Barry R. Woodward | 188 | |||
| Turnout | 31.0 | ||||
| Party | Candidate | Votes | % | ±% | |
|---|---|---|---|---|---|
| Conservative | Graham F. Sinclair | 1,811 | |||
| Ratepayers | Henry J. Berry | 736 | |||
| Labour | Paul J. Diamond | 504 | |||
| National Front | John R. P. King | 407 | |||
| Liberal | Michael J. Mackrory | 260 | |||
| The Centre Party | Michael J. Page | 235 | |||
| Turnout | 34.6 | ||||
| Party | Candidate | Votes | % | ±% | |
|---|---|---|---|---|---|
| Labour | Robert C. Hammond | 1,090 | |||
| Conservative | Laurie Braham | 568 | |||
| National Front | Donald R. South | 396 | |||
| Liberal | George D. Bristow | 201 | |||
| Turnout | 29.1 | ||||
1990-1994
| Party | Candidate | Votes | % | ±% | |
|---|---|---|---|---|---|
| Labour | Jennifer Gray | 1,194 | 48.6 | ||
| Lib Dem Focus Team | Jonathan H. Fryer | 969 | 39.6 | ||
| Conservative | Michael Thompson | 182 | 7.4 | ||
| Independent | Colin R. Bex | 112 | 4.6 | ||
| Turnout | 29.3 | ||||
| Labour hold | Swing | ||||
The by-election was called following the resignation of Cllr. Patrick J. Hayes.
1994-1998
| Party | Candidate | Votes | % | ±% | |
|---|---|---|---|---|---|
| Labour | Angela M. Bean | 2,718 | 49.5 | +8.7 | |
| Liberal Democrats | Robert S. Meadowcroft | 1,717 | 31.2 | -14.5 | |
| Conservative | Robert J. Brock | 1,079 | 19.6 | +5.9 | |
| Majority | 1,001 | 18.3 | |||
| Turnout | 5,514 | 63.1 | |||
| Labour gain from Liberal Democrats | Swing | ||||
The by-election was called following the resignation of Cllr. Neal A. Chubb.
1998-2002
| Party | Candidate | Votes | % | ±% | |
|---|---|---|---|---|---|
| Labour | Ian Leslie | 997 | 47.3 | +0.0 | |
| Liberal Democrats | John C. Howard | 965 | 45.8 | +18.5 | |
| Conservative | Matthew R. Sharp | 78 | 3.7 | -4.2 | |
| Independent | Roderick M. Milroy | 66 | 3.1 | -2.7 | |
| Majority | 32 | 1.5 | |||
| Turnout | 2,106 | 27.8 | |||
| Labour hold | Swing | ||||
The by-election was called following the resignation of Cllr. Huw M. Morgan-Thomas.
2002-2006
| Party | Candidate | Votes | % | ±% | |
|---|---|---|---|---|---|
| Liberal Democrats | Mashoodul F. Qureshi | 1,283 | 45.5 | +17.7 | |
| Labour | David G. Hayes | 717 | 25.4 | -12.9 | |
| Conservative | Julien A. S. Foster | 417 | 14.8 | +3.8 | |
| Independent | Mohammed Shafiq | 183 | 6.5 | +6.5 | |
| Green | Mark S. Dawes | 171 | 6.1 | -6.0 | |
| Socialist Alliance | Cecilia Prosper | 47 | 1.7 | -1.6 | |
| Majority | 566 | 20.1 | |||
| Turnout | 2,818 | 38.0 | |||
| Liberal Democrats gain from Labour | Swing | ||||
The by-election was called following the death of Cllr. Mohammed F. Rahman.
| Party | Candidate | Votes | % | ±% | |
|---|---|---|---|---|---|
| Liberal Democrats | Robert J. Wheatley | 1,051 | 43.6 | +18.9 | |
| Labour | Geraldine Reardon | 932 | 38.7 | -11.9 | |
| Conservative | Kabir A. Sabar | 188 | 7.8 | -7.1 | |
| Green | Gary P. Lancet | 151 | 6.3 | +6.3 | |
| Socialist Alliance | Lee Rock | 84 | 3.5 | -6.3 | |
| Majority | 119 | 4.9 | |||
| Turnout | 2,406 | 30.3 | |||
| Liberal Democrats gain from Labour | Swing | ||||
The by-election was called following the resignation of Cllr. Martin J. O'Connor.
| Party | Candidate | Votes | % | ±% | |
|---|---|---|---|---|---|
| Conservative | Laurance A. Wedderburn | 791 | 36.9 | -17.4 | |
| Liberal Democrats | Henry A. Boyle | 710 | 33.2 | +21.6 | |
| Labour | Margaret L. Broadley | 552 | 25.8 | -8.3 | |
| Respect | Christopher Dransfield | 88 | 4.1 | +4.1 | |
| Majority | 81 | 3.7 | |||
| Turnout | 2,141 | 27.6 | |||
| Conservative hold | Swing | ||||
The by-election was called following the resignation of Cllr. David Divine.
| Party | Candidate | Votes | % | ±% | |
|---|---|---|---|---|---|
| Labour | Arunes Sarkar | 774 | 40.4 | -1.1 | |
| Liberal Democrats | Mohammad S. Diwan | 561 | 29.2 | +13.1 | |
| Conservative | Graham F. Sinclair | 299 | 15.6 | -4.7 | |
| Green | Mark S. Dawes | 199 | 10.4 | -6.4 | |
| Socialist Alternative | Louise H. Thompson | 85 | 4.4 | -1.0 | |
| Majority | 213 | 11.2 | |||
| Turnout | 1,918 | 23.0 | |||
| Labour hold | Swing | ||||
The by-election was called following the death of Cllr. Mohammed M. Nasim.
| Party | Candidate | Votes | % | ±% | |
|---|---|---|---|---|---|
| Labour | Marie E. Pye | 937 | 38.0 | +3.0 | |
| Liberal Democrats | Meher Khan | 765 | 31.3 | -2.4 | |
| Respect | Caroline M. Coleman | 354 | 14.5 | +14.5 | |
| Conservative | Julien A. S. Foster | 225 | 9.1 | +1.7 | |
| Green | Mark S. Dawes | 165 | 6.7 | -8.0 | |
| Majority | 172 | 6.7 | |||
| Turnout | 2,446 | 30.9 | |||
| Labour hold | Swing | ||||
The by-election was called following the resignation of Cllr. Ian Leslie.
2006-2010
| Party | Candidate | Votes | % | ±% | |
|---|---|---|---|---|---|
| Conservative | Andrew P. J. Hemsted | 1,694 | 55.2 | -14.8 | |
| Liberal Democrats | Graham A. Woolnough | 1,022 | 33.3 | +14.3 | |
| Labour | Gerry A. Lyons | 208 | 6.8 | -4.2 | |
| UKIP | Robert J. Brock | 143 | 4.7 | +4.7 | |
| Majority | 672 | 21.9 | |||
| Turnout | 3,067 | 38.5 | |||
| Conservative hold | Swing | ||||
The by-election was called following the death of Cllr. Derek B. Arnold.
| Party | Candidate | Votes | % | ±% | |
|---|---|---|---|---|---|
| Liberal Democrats | Winnifred F. Smith | 1,360 | 56.0 | +12.8 | |
| Labour | Khevyn R. Limbajee | 695 | 28.6 | -14.1 | |
| Independent | Carole A. Vincent* | 176 | 7.2 | +7.2 | |
| Conservative | Edwin J. Northover | 108 | 4.4 | -2.1 | |
| Green | William J. Measure | 90 | 3.7 | -3.9 | |
| Majority | 665 | 27.4 | |||
| Turnout | 2,429 | 27.8 | |||
| Liberal Democrats gain from Labour | Swing | ||||
The by-election was called following the disqualification of Cllr. Miranda A. J. Grell.
*No description (rather than independent). Candidate is a member of the Respect Party and was supported by the local branch. She was unable to use Respect as her description due to a split in the party. Current UK electoral law allows candidates to stand without any description rather than independent if preferred.
| Party | Candidate | Votes | % | ±% | |
|---|---|---|---|---|---|
| Liberal Democrats | Samina S. Safdar | 977 | 36.9 | -2.3 | |
| Labour | Jawade A. Liaqat | 927 | 35.0 | +1.4 | |
| Conservative | Edwin J. Northover | 507 | 19.1 | +5.9 | |
| Green | Mark S. Dawes | 184 | 6.9 | -7.0 | |
| Left List | Makola Mayambika | 56 | 2.1 | +2.1 | |
| Majority | 50 | 1.9 | |||
| Turnout | 2,651 | 32.2 | |||
| Liberal Democrats hold | Swing | ||||
The by-election was called following the resignation of Cllr. Imran Abrahim.
| Party | Candidate | Votes | % | ±% | |
|---|---|---|---|---|---|
| Conservative | Ms. Jemma Hemsted | 1183 | |||
| Liberal Democrats | Henry Boyle | 734 | |||
| Labour | Geoffrey Hammond | 439 | |||
| Turnout | |||||
| Conservative hold | Swing | ||||
The by-election was called following the death of Cllr. John M. Gover.
| Party | Candidate | Votes | % | ±% | |
|---|---|---|---|---|---|
| Liberal Democrats | Ms. Jane E. Morgan | 1298 | |||
| Liberal Democrats | Nicky R. Bason | 1295 | |||
| Conservative | Sandeep D. Christian | 1223 | |||
| Conservative | Ms. Sheree L. Rackham | 1155 | |||
| Labour | Mohammed S. K. Ahmed | 264 | |||
| Labour | Gerry Lyons | 241 | |||
| Green | Daniel P. Perrett | 142 | |||
| Turnout | |||||
| Liberal Democrats hold | Swing | ||||
| Liberal Democrats hold | Swing | ||||
The by-election was called following the death of Cllr. John D. Beanse and the resignation of Cllr. John N. H. Penstone due to ill health.
| Party | Candidate | Votes | % | ±% | |
|---|---|---|---|---|---|
| Conservative | Edwin J. Northover | 1393 | |||
| Labour | Ms. Henrietta A. Jackson | 255 | |||
| Liberal Democrats | Henry A. Boyle | 144 | |||
| Green | Daniel P. Perrett | 102 | |||
| Turnout | |||||
| Conservative hold | Swing | ||||
The by-election was called following the death of Cllr. John F. Walter.
2010-2014
| Party | Candidate | Votes | % | ±% | |
|---|---|---|---|---|---|
| Conservative | John Moss | 1392 | |||
| Labour | Peter Woodrow | 472 | |||
| Liberal Democrats | Graham Woolnough | 79 | |||
| Green | Bill Measure | 70 | |||
| National Liberal | James O'Rourke | 64 | |||
| Turnout | 24.4% | ||||
| Conservative hold | Swing | ||||
The by-election was called following the resignation of Cllr. Edwin J. Northover.
2014-2018
| Party | Candidate | Votes | % | ±% | |
|---|---|---|---|---|---|
| Labour | Umar Ali | 1,923 | 68.4 | +11.5 | |
| Green | Rebecca Tully | 524 | 18.6 | +1.8 | |
| Conservative | Afzal Akram | 365 | 13.0 | +6.2 | |
| Turnout | 2,813 | ||||
| Labour hold | Swing | ||||
The by-election was triggered by the death of Councillor Nadeem Ali, of the Labour Party.[14]
Notes
- The Essex and Greater London (County and London Borough Boundaries) Order 1993
- The East London Boroughs (London Borough Boundaries) (No. 2) Order 1993
- The Redbridge and Waltham Forest (London Borough Boundaries) Order 1993
References
- "Council minutes". Waltham Forest Council. Retrieved 10 July 2022.
- "London Boroughs Political Almanac". London Councils. Retrieved 10 July 2022.
- "London Borough Council Elections 4 May 1978" (PDF). London Datastore. Greater London Council. Retrieved 25 February 2015.
- "London Borough Council Elections 2 May 2002" (PDF). London Datastore. Greater London Authority. Retrieved 25 February 2015.
- "London Borough Council Elections 9 May 1968" (PDF). London Datastore. Greater London Council. Retrieved 24 February 2015.
- "London Borough Council Elections 13 May 1971" (PDF). London Datastore. Greater London Council. Retrieved 3 March 2015.
- "London Borough Council Elections 2 May 1974" (PDF). London Datastore. Greater London Council. Retrieved 25 February 2015.
- "London Borough Council By-elections May 1990 to May 1994" (PDF). London Datastore. London Research Centre. Retrieved 8 March 2015.
- "London Borough Council Elections 7 May 1998 including the Greater London Authority Referendum results" (PDF). London Datastore. London Research Centre. Retrieved 8 March 2015.
- "London Borough Council Elections 4 May 2006" (PDF). London Datastore. Greater London Authority. Retrieved 7 March 2015.
- "London Borough Council Elections 6 May 2010" (PDF). London Datastore. Greater London Authority. Retrieved 7 March 2015.
- "London Borough Council Elections 22 May 2014" (PDF). London Datastore. Greater London Authority. Retrieved 26 February 2015.
- "William Morris Ward By-Election Results 2017 | Waltham Forest Council". www.walthamforest.gov.uk.
- "Brother wins by-election triggered by councillor's death". East London and West Essex Guardian Series.