Clapham (UK Parliament constituency)
Clapham was a borough constituency in South London which returned one Member of Parliament (MP) to the House of Commons of the UK Parliament. It was created in time for the 1885 general election then altered in periodic national boundary reviews, principally in 1918, and abolished before the February 1974 general election. In its early years (until 1918) the seat was officially named Battersea and Clapham Parliamentary Borough: No. 2—The Clapham Division.
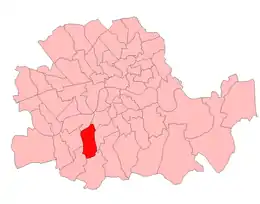

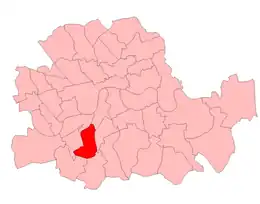
| Clapham | |
|---|---|
| Former Borough constituency for the House of Commons | |
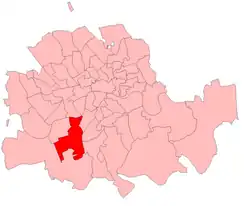 Clapham in London 1885-1918 | |
| 1885–February 1974 | |
| Seats | one |
| Created from | East Surrey (one and a half parishes of) |
| Replaced by | Streatham and Lambeth Central |
| During its existence contributed to new seat(s) of: | Battersea South |
Boundaries
1885–1918: In 1885 the constituency was established as one of two divisions of a new parliamentary borough to be named Battersea and Clapham, in the northern part of the historic county of Surrey.
The Redistribution of Seats Act 1885 provided the constituency, carved out of a corner of East Surrey, was to consist of:
No. 2—The Clapham Division.
- The Parish of Clapham,
- No. 1 Ward of Battersea Parish, and
- No. 4 Ward of Battersea Parish, except so much as is comprised in Division No. 1 as herein described.
— Redistribution of Seats Act 1885[1]
1918–1950: In the redistribution of 1918 the seat was altered to remove half of the wards which constituted Battersea (into a new seat of Battersea South) and to instead consist of the local government wards of Clapham North and Clapham South, together with a part of Balham. As a matter of strict nomenclature it became a division of Wandsworth 'parliamentary borough'.
- Local government bodies
In 1889 the area was among many square miles severed from Surrey to become part of a new county, the County of London. In 1900 the lower rung of local government in London was reorganised. The constituency became part of the Metropolitan Borough of Wandsworth.
In 1965 the area as it then stood for the purposes of local government became almost wholly part of the London Borough of Lambeth and of Greater London.
Members of Parliament
Election results
Elections in the 1880s
| Party | Candidate | Votes | % | ±% | |
|---|---|---|---|---|---|
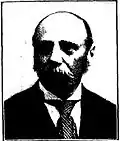
| Liberal | John Moulton | 3,976 | 52.1 | ||
| Conservative | Algernon Henry Bourke | 3,650 | 47.9 | ||
| Majority | 326 | 4.2 | |||
| Turnout | 7,626 | 80.7 | |||
| Registered electors | 9,454 | ||||
| Liberal win (new seat) | |||||

| Party | Candidate | Votes | % | ±% | |
|---|---|---|---|---|---|
| Conservative | John Gilliat | 3,816 | 53.3 | +5.4 | |
| Liberal | John Moulton | 3,347 | 46.7 | -5.4 | |
| Majority | 469 | 6.6 | N/A | ||
| Turnout | 7,163 | 75.8 | −4.9 | ||
| Registered electors | 9,454 | ||||
| Conservative gain from Liberal | Swing | +5.4 | |||
Elections in the 1890s

| Party | Candidate | Votes | % | ±% | |
|---|---|---|---|---|---|
| Conservative | Percy Thornton | 5,170 | 53.3 | 0.0 | |
| Liberal | Reginald McKenna | 4,526 | 46.7 | 0.0 | |
| Majority | 644 | 6.6 | 0.0 | ||
| Turnout | 9,696 | 80.0 | +4.2 | ||
| Registered electors | 12,124 | ||||
| Conservative hold | Swing | 0.0 | |||
| Party | Candidate | Votes | % | ±% | |
|---|---|---|---|---|---|
| Conservative | Percy Thornton | 5,925 | 60.3 | +7.0 | |
| Liberal | John Kempster | 3,904 | 39.7 | −7.0 | |
| Majority | 2,021 | 20.6 | +14.0 | ||
| Turnout | 9,829 | 70.9 | −9.1 | ||
| Registered electors | 13,872 | ||||
| Conservative hold | Swing | +7.0 | |||
Elections in the 1900s
| Party | Candidate | Votes | % | ±% | |
|---|---|---|---|---|---|
| Conservative | Percy Thornton | 7,504 | 70.9 | +10.6 | |
| Liberal | Frank Duerdin Perrott | 3,084 | 29.1 | −10.6 | |
| Majority | 4,420 | 41.8 | +21.2 | ||
| Turnout | 10,588 | 63.9 | −7.0 | ||
| Registered electors | 16,572 | ||||
| Conservative hold | Swing | +10.6 | |||
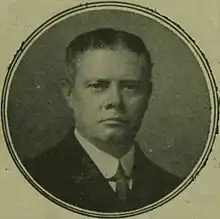
| Party | Candidate | Votes | % | ±% | |
|---|---|---|---|---|---|
| Conservative | Percy Thornton | 7,912 | 50.3 | −20.6 | |
| Liberal | Frederick Low | 7,816 | 49.7 | +20.6 | |
| Majority | 96 | 0.6 | −41.2 | ||
| Turnout | 15,728 | 82.0 | +18.1 | ||
| Registered electors | 19,180 | ||||
| Conservative hold | Swing | −20.6 | |||
Elections in the 1910s
| Party | Candidate | Votes | % | ±% | |
|---|---|---|---|---|---|
| Conservative | Denison Faber | 10,743 | 55.1 | +4.8 | |
| Liberal | John George Kipling | 8,762 | 44.9 | -4.8 | |
| Majority | 1,981 | 10.2 | +9.6 | ||
| Turnout | 22,611 | 86.3 | +4.3 | ||
| Conservative hold | Swing | +4.8 | |||
| Party | Candidate | Votes | % | ±% | |
|---|---|---|---|---|---|
| Conservative | Denison Faber | 9,560 | 55.6 | +0.5 | |
| Liberal | John Benn | 7,639 | 44.4 | -0.5 | |
| Majority | 1,921 | 11.2 | +1.0 | ||
| Turnout | 22,611 | 76.1 | -10.2 | ||
| Conservative hold | Swing | +0.5 | |||
General Election 1914–15:
Another General Election was required to take place before the end of 1915. The political parties had been making preparations for an election to take place and by the July 1914, the following candidates had been selected;
- Unionist: Denison Faber
- Liberal: Joseph William Molden[3]
| Party | Candidate | Votes | % | ±% | |
|---|---|---|---|---|---|
| Unionist | Harry Greer | 4,512 | 57.5 | +1.9 | |
| Independent | Henry Hamilton Beamish | 3,331 | 42.5 | New | |
| Majority | 1,181 | 15.0 | +3.8 | ||
| Turnout | 23,526 | 33.3 | -42.8 | ||
| Unionist hold | Swing | N/A | |||
- Beamish was the nominee of Pemberton Billing's Vigilante Society
| Party | Candidate | Votes | % | ±% | |
|---|---|---|---|---|---|
| C | Unionist | Arthur Du Cros | 9,776 | 60.2 | +4.6 |
| Independent | Henry Hamilton Beamish | 3,070 | 18.9 | New | |
| Liberal | Philip Henry Thomas | 2,790 | 17.2 | −27.2 | |
| Independent | William James Harvey | 594 | 3.7 | New | |
| Majority | 6,706 | 41.3 | +30.1 | ||
| Turnout | 16,230 | 46.9 | −29.2 | ||
| Registered electors | 34,640 | ||||
| Unionist hold | Swing | +15.9 | |||
| C indicates candidate endorsed by the coalition government. | |||||
- Beamish was supported by, and may have been the nominee, of the National Federation of Discharged and Demobilized Sailors and Soldiers
Elections in the 1920s
| Party | Candidate | Votes | % | ±% | |
|---|---|---|---|---|---|
| Unionist | John Leigh | Unopposed | |||
| Unionist hold | |||||
| Party | Candidate | Votes | % | ±% | |
|---|---|---|---|---|---|
| Unionist | John Leigh | 13,285 | 58.7 | −1.5 | |
| Labour | Leopold Spero | 4,919 | 21.7 | New | |
| Liberal | Ernest Villiers | 4,444 | 19.6 | +2.4 | |
| Majority | 8,366 | 37.0 | −4.3 | ||
| Turnout | 22,648 | 63.0 | +16.1 | ||
| Registered electors | 35,962 | ||||
| Unionist hold | Swing | −2.0 | |||
| Party | Candidate | Votes | % | ±% | |
|---|---|---|---|---|---|
| Unionist | John Leigh | 10,287 | 46.4 | −12.3 | |
| Labour | Leopold Spero | 6,404 | 28.9 | +7.2 | |
| Liberal | Thomas George Graham | 5,479 | 24.7 | +5.1 | |
| Majority | 3,883 | 17.5 | −19.5 | ||
| Turnout | 22,170 | 60.7 | −2.3 | ||
| Registered electors | 36,498 | ||||
| Unionist hold | Swing | −9.8 | |||
| Party | Candidate | Votes | % | ±% | |
|---|---|---|---|---|---|
| Unionist | John Leigh | 16,404 | 64.1 | +17.7 | |
| Labour | Charles Diamond | 9,204 | 35.9 | +7.0 | |
| Majority | 7,200 | 28.2 | +10.7 | ||
| Turnout | 25,608 | 69.5 | +8.8 | ||
| Registered electors | 36,872 | ||||
| Unionist hold | Swing | +5.4 | |||
| Party | Candidate | Votes | % | ±% | |
|---|---|---|---|---|---|
| Unionist | John Leigh | 13,507 | 41.7 | −22.4 | |
| Labour | J. Allen Skinner | 9,871 | 30.5 | −5.4 | |
| Liberal | Owen Davies | 8,991 | 27.8 | New | |
| Majority | 3,636 | 11.2 | −17.0 | ||
| Turnout | 32,369 | 67.3 | −2.2 | ||
| Registered electors | 48,061 | ||||
| Unionist hold | Swing | −8.5 | |||
Elections in the 1930s
| Party | Candidate | Votes | % | ±% | |
|---|---|---|---|---|---|
| Conservative | John Leigh | 21,648 | 68.00 | ||
| Ind. Labour Party | Hilda Browning | 7,317 | 22.98 | New | |
| Liberal | John Henry Clarke | 2,869 | 9.01 | ||
| Majority | 14,331 | 45.02 | |||
| Turnout | 31,834 | 66.13 | |||
| Conservative hold | Swing | ||||
| Party | Candidate | Votes | % | ±% | |
|---|---|---|---|---|---|
| Conservative | John Leigh | 17,458 | 60.56 | ||
| Labour | Monica Whately | 11,368 | 22.98 | ||
| Majority | 6,090 | 37.58 | |||
| Turnout | 28,826 | 60.54 | |||
| Conservative hold | Swing | ||||
Elections in the 1940s
| Party | Candidate | Votes | % | ±% | |
|---|---|---|---|---|---|
| Labour | John Battley | 15,205 | 54.17 | ||
| Conservative | Roy Lucas Lowndes | 10,014 | 35.68 | ||
| Liberal | Charles Erik Paterson | 2,850 | 10.15 | New | |
| Majority | 5,191 | 18.49 | N/A | ||
| Turnout | 28,069 | 70.78 | |||
| Labour gain from Conservative | Swing | ||||
Elections in the 1950s
| Party | Candidate | Votes | % | ±% | |
|---|---|---|---|---|---|
| Labour | Charles Gibson | 23,300 | 47.47 | ||
| Conservative | Roy L Lowndes | 22,094 | 45.01 | ||
| Liberal | Beatrice L Curtis | 3,071 | 6.26 | ||
| Communist | Gladys Mary Draper | 619 | 1.26 | ||
| Majority | 1,206 | 2.46 | |||
| Turnout | 49,084 | 80.64 | |||
| Labour hold | Swing | ||||
| Party | Candidate | Votes | % | ±% | |
|---|---|---|---|---|---|
| Labour | Charles Gibson | 25,053 | 51.34 | ||
| Conservative | Roy L Lowndes | 23,745 | 48.66 | ||
| Majority | 1,308 | 2.68 | |||
| Turnout | 48,798 | 81.86 | |||
| Labour hold | Swing | ||||
| Party | Candidate | Votes | % | ±% | |
|---|---|---|---|---|---|
| Labour | Charles Gibson | 22,398 | 50.25 | ||
| Conservative | William van Straubenzee | 22,173 | 49.75 | ||
| Majority | 225 | 0.50 | |||
| Turnout | 44,571 | 81.86 | |||
| Labour hold | Swing | ||||
| Party | Candidate | Votes | % | ±% | |
|---|---|---|---|---|---|
| Conservative | Alan Glyn | 22,266 | 52.20 | ||
| Labour | Charles Gibson | 20,390 | 47.89 | ||
| Majority | 1,876 | 4.31 | N/A | ||
| Turnout | 42,656 | 76.19 | |||
| Conservative gain from Labour | Swing | ||||
Elections in the 1960s
| Party | Candidate | Votes | % | ±% | |
|---|---|---|---|---|---|
| Labour | Margaret McKay | 17,657 | 46.20 | ||
| Conservative | Alan Glyn | 17,101 | 44.75 | ||
| Liberal | Peter Lyden-Cowan | 2,611 | 6.83 | New | |
| Independent Liberal |
|
847 | 2.22 | New | |
| Majority | 556 | 1.45 | N/A | ||
| Turnout | 37,369 | 72.34 | |||
| Labour gain from Conservative | Swing | ||||
- Anti-Common Market
| Party | Candidate | Votes | % | ±% | |
|---|---|---|---|---|---|
| Labour | Margaret McKay | 19,555 | 51.60 | ||
| Conservative | Ian Gow | 15,379 | 40.58 | ||
| Liberal | Michael A Minter | 2,968 | 7.83 | ||
| Majority | 4,176 | 11.02 | |||
| Turnout | 37,902 | 73.05 | |||
| Labour hold | Swing | ||||
Elections in the 1970s
| Party | Candidate | Votes | % | ±% | |
|---|---|---|---|---|---|
| Conservative | Bill Shelton | 16,593 | 49.8 | +9.2 | |
| Labour | David Pitt | 13,473 | 40.4 | −11.2 | |
| Liberal | Eric G Thwaites | 2,982 | 8.9 | +1.1 | |
| Socialist (GB) | F.E. Simkins | 220 | 0.7 | New | |
| Independent | Bill Boaks | 80 | 0.2 | New | |
| Majority | 3,120 | 9.4 | -1.6 | ||
| Turnout | 33,348 | 62.9 | -10.1 | ||
| Conservative gain from Labour | Swing | +10.2 | |||
References
- "Chap. 23. Redistribution of Seats Act, 1885". The Public General Acts of the United Kingdom passed in the forty-eighth and forty-ninth years of the reign of Queen Victoria. London: Eyre and Spottiswoode. 1885. pp. 111–198.
- Craig, FWS, ed. (1974). British Parliamentary Election Results: 1885-1918. London: Macmillan Press. ISBN 9781349022984.
- Western Daily Press 13 May 1914
- Craig, F.W.S., ed. (1969). British parliamentary election results 1918-1949. Glasgow: Political Reference Publications. p. 57. ISBN 0-900178-01-9.
- Debrett's House of Commons and the Judicial Bench, 1922
- The Liberal Year Book, 1930
- British parliamentary election results 1918-1949, Craig, F.W.S.
- British Parliamentary Election Results 1885-1918, compiled and edited by F.W.S. Craig (Macmillan Press 1974)
- Debrett’s Illustrated Heraldic and Biographical House of Commons and the Judicial Bench 1886
- Debrett’s House of Commons and the Judicial Bench 1901
- Debrett’s House of Commons and the Judicial Bench 1918
- Leigh Rayment's Historical List of MPs – Constituencies beginning with "C" (part 4)