Wangjiang County
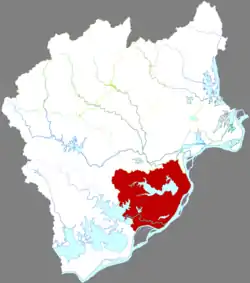
Wangjiang County (simplified Chinese: 望江县; traditional Chinese: 望江縣) is a county in the southwest of Anhui Province, situated on the northwest (left) bank of the Yangtze. It is under the jurisdiction of the prefecture-level city of Anqing. It has population of 600,000 and an area of 1,357 km2 (524 sq mi). The ZIP code of Wangjiang is 246200.The government of Wangjiang County is located in Leiyang Town.
Wangjiang
望江县 | |
|---|---|
 Wangjiang in Anqing | |
.png.webp) Anqing in Anhui | |
| Coordinates: 30°07′28″N 116°41′39″E | |
| Country | People's Republic of China |
| Province | Anhui |
| Prefecture-level city | Anqing |
| Area | |
| • Total | 1,347.98 km2 (520.46 sq mi) |
| Population (2019) | |
| • Total | 554,000 |
| • Density | 410/km2 (1,100/sq mi) |
| Time zone | UTC+8 (China Standard) |
| Postal code | 246200 |
Administrative divisions
Wangjiang County has jurisdiction over eight towns and two townships.[1]
Towns
- Huayang (华阳镇), Saikou (赛口镇), Yatan (雅滩镇), Changling Town (长岭镇), Taici (太慈镇), Zhanghu (漳湖镇), Gaoshi (高士镇), Yangwan (杨湾镇)
Townships:
- Leichi Township (雷池乡), Liangquan Township (凉泉乡)
Climate
| Climate data for Wangjiang (1991–2020 normals) | |||||||||||||
|---|---|---|---|---|---|---|---|---|---|---|---|---|---|
| Month | Jan | Feb | Mar | Apr | May | Jun | Jul | Aug | Sep | Oct | Nov | Dec | Year |
| Average high °C (°F) | 7.9 (46.2) |
10.9 (51.6) |
15.5 (59.9) |
21.9 (71.4) |
26.8 (80.2) |
29.4 (84.9) |
32.8 (91.0) |
32.3 (90.1) |
28.4 (83.1) |
23.2 (73.8) |
17.1 (62.8) |
10.5 (50.9) |
21.4 (70.5) |
| Daily mean °C (°F) | 4.3 (39.7) |
6.8 (44.2) |
11.2 (52.2) |
17.3 (63.1) |
22.3 (72.1) |
25.5 (77.9) |
28.9 (84.0) |
28.2 (82.8) |
24.1 (75.4) |
18.6 (65.5) |
12.4 (54.3) |
6.4 (43.5) |
17.2 (62.9) |
| Average low °C (°F) | 1.6 (34.9) |
3.8 (38.8) |
7.8 (46.0) |
13.5 (56.3) |
18.7 (65.7) |
22.5 (72.5) |
25.8 (78.4) |
25.2 (77.4) |
20.9 (69.6) |
15.2 (59.4) |
8.9 (48.0) |
3.4 (38.1) |
13.9 (57.1) |
| Average precipitation mm (inches) | 66.9 (2.63) |
81.4 (3.20) |
128.1 (5.04) |
153.0 (6.02) |
188.2 (7.41) |
247.8 (9.76) |
210.0 (8.27) |
128.6 (5.06) |
66.0 (2.60) |
53.0 (2.09) |
62.1 (2.44) |
43.0 (1.69) |
1,428.1 (56.21) |
| Average precipitation days (≥ 0.1 mm) | 11.7 | 11.5 | 14.7 | 13.8 | 13.0 | 14.2 | 10.9 | 10.4 | 7.5 | 7.6 | 9.4 | 8.7 | 133.4 |
| Average snowy days | 3.8 | 2.0 | 0.5 | 0 | 0 | 0 | 0 | 0 | 0 | 0 | 0.2 | 1.3 | 7.8 |
| Average relative humidity (%) | 78 | 78 | 78 | 76 | 77 | 82 | 79 | 81 | 80 | 76 | 77 | 75 | 78 |
| Mean monthly sunshine hours | 95.0 | 97.3 | 116.8 | 143.6 | 161.9 | 140.3 | 211.0 | 206.7 | 165.8 | 156.9 | 128.9 | 121.1 | 1,745.3 |
| Percent possible sunshine | 29 | 31 | 31 | 37 | 38 | 33 | 49 | 51 | 45 | 45 | 41 | 38 | 39 |
| Source: China Meteorological Administration[2][3] | |||||||||||||
References
- 蚌埠市-行政区划王 (in Chinese). XZQH. Retrieved 2012-05-24.
- 中国气象数据网 – WeatherBk Data (in Simplified Chinese). China Meteorological Administration. Retrieved 24 September 2023.
- 中国气象数据网 (in Simplified Chinese). China Meteorological Administration. Retrieved 24 September 2023.
This article is issued from Wikipedia. The text is licensed under Creative Commons - Attribution - Sharealike. Additional terms may apply for the media files.