Oldpark (District Electoral Area)
Oldpark is one of the ten district electoral areas (DEA) in Belfast, Northern Ireland. Located in the north of the city, the district elects six members to Belfast City Council and contains the wards of Ardoyne; Ballysillan; Cliftonville; Legoniel; New Lodge and Water Works. Oldpark forms part of the Belfast North constituency for the Northern Ireland Assembly and UK Parliament.
| Oldpark | |
|---|---|
| Belfast City Council DEA constituency | |
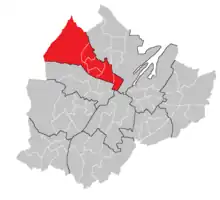 Oldpark DEA marked on a map of Belfast City Council and its wards | |
| Current constituency | |
| Created | 2014 |
| Seats | 6 (2014–) |
| Councillors | |
History
The DEA was created for the 1985 local elections. Legoniel, Ballysillan and Ardoyne wards had previously been part of Area E, New Lodge and the southern half of the Waterworks ward had been in Area G, while Cliftonville and the northern half of Waterworks ward had been in Area H.
Wards
| Map | Ward | Population (2011 Census) | Catholic | Protestant | Other | No Religion | Area | Density | NI Assembly | UK Parliament | Ref |
|---|---|---|---|---|---|---|---|---|---|---|---|
| 1 | Ardoyne | 5,987 | 92.8% | 5.1% | 0.3% | 1.8% | 0.58 km2 | 10,322 /km2 | Belfast North | Belfast North | [1] |
| 2 | Ballysillan | 5,626 | 7.8% | 83.3% | 1.4% | 7.5% | 1.11 km2 | 5,068 /km2 | Belfast North | Belfast North | [2] |
| 3 | Cliftonville | 5,330 | 71% | 23.6% | 0.7% | 4.7% | 1.18 km2 | 4,517 /km2 | Belfast North | Belfast North | [3] |
| 4 | Legoniel | 6,409 | 48.2% | 45.4% | 0.8% | 5.6% | 8.82 km2 | 727 /km2 | Belfast North | Belfast North | [4] |
| 5 | New Lodge | 4,950 | 89.2% | 7.5% | 0.9% | 2.3% | 0.72 km2 | 6,875 /km2 | Belfast North | Belfast North | [5] |
| 6 | Water Works | 5,829 | 87.6% | 7.1% | 0.9% | 4.4% | 1.27 km2 | 4,590 /km2 | Belfast North | Belfast North | [6] |
| Oldpark | 34,131 | 65.6% | 29.2% | 0.8% | 4.4% | 13.68 km2 | 2,495 /km2 | Belfast North | Belfast North | ||
Councillors
| Election | Councillor (Party) |
Councillor (Party) |
Councillor (Party) |
Councillor (Party) |
Councillor (Party) |
Councillor (Party) | ||||||
|---|---|---|---|---|---|---|---|---|---|---|---|---|
| 2023 | JJ Magee (Sinn Féin) |
Ryan Murphy (Sinn Féin) |
Nichola Bradley (Sinn Féin) |
Paul McCusker (Independent)/ (SDLP) |
Tomás Ó Néill (Sinn Féin) |
Jordan Doran (DUP) | ||||||
| March 2023 Defection | Fiona Ferguson (PBP) | |||||||||||
| January 2023 Co-Option | ||||||||||||
| September 2020 Co-Option | Dale Pankhurst (DUP) | |||||||||||
| 2019 | Shauneen Baker (Sinn Féin) | |||||||||||
| January 2018 Co-Options | Mary Clarke (Sinn Féin) |
Julie-Anne Corr (PUP) | ||||||||||
| May 2016 Co-Option | Gerry McCabe (Sinn Féin) |
Gareth McKee (DUP) | ||||||||||
| 2014 | Nichola Mallon (SDLP) | |||||||||||
| 2011 | Danny Lavery (Sinn Féin) |
Conor Maskey (Sinn Féin) |
Ian Crozier (DUP) | |||||||||
| 2005 | Margaret McClenaghan (Sinn Féin) |
Caral Ni Chuilin (Sinn Féin) |
Alban Maginness (SDLP) |
Fred Cobain (UUP) |
Nelson McCausland (DUP) | |||||||
| 2001 | Gerard Brophy (Sinn Féin) |
Eoin O'Broin (Sinn Féin) |
Martin Morgan (SDLP) |
Billy Hutchinson (PUP) | ||||||||
| 1997 | Bobby Lavery (Sinn Féin) |
Paddy McManus (Sinn Féin) |
Mick Conlon (Sinn Féin) |
Fred Proctor (UUP) | ||||||||
| 1993 | Joe Austin (Sinn Féin) |
Fred Rodgers (UUP) | ||||||||||
| 1989 | Gerard McGuigan (Sinn Féin) |
Seamus Lynch (Workers' Party) |
Brian Feeney (SDLP) |
William Gault (UUP) | ||||||||
| 1985 | Bobby Lavery (Sinn Féin) |
Peter Lunn (DUP) | ||||||||||
2023 Election
2019: 3 x Sinn Féin, 1 x SDLP, 1 x DUP, 1 x People Before Profit
2023: 4 x Sinn Féin, 1 x DUP, 1 x Independent
2019–2023 Change: Sinn Féin gain from People Before Profit, Independent leaves SDLP
| Party | Candidate | FPv% | Count | |||||||
|---|---|---|---|---|---|---|---|---|---|---|
| 1 | 2 | 3 | 4 | 5 | 6 | 7 | ||||
| Sinn Féin | Nichola Bradley* | 15.12% | 1,870 | |||||||
| Independent | Paul McCusker* | 14.13% | 1,747 | 1,764.05 | 1,835.05 | |||||
| Sinn Féin | JJ Magee* | 13.09% | 1,619 | 1,637.15 | 1,665.60 | 1,668.60 | 1,714.05 | 1,714.05 | 1,877.05 | |
| Sinn Féin | Ryan Murphy* | 11.56% | 1,430 | 1,472.70 | 1,493.95 | 1,497.95 | 1,524.05 | 1,526.05 | 1,704.40 | |
| Sinn Féin | Tomás Ó Néill | 10.76% | 1,330 | 1,335.35 | 1,353.45 | 1,367.45 | 1,402.70 | 1,404.70 | 1,601.55 | |
| DUP | Jordan Doran* | 10.21% | 1,263 | 1,263.00 | 1,273.05 | 1,273.05 | 1,310.05 | 1,606.05 | 1,634.10 | |
| DUP | Gillian Simpson | 7.43% | 919 | 919.00 | 924.00 | 924.00 | 962.00 | 1,232.00 | 1,260.00 | |
| People Before Profit | Fiona Ferguson* | 5.66% | 700 | 704.65 | 830.85 | 849.85 | 1,114.15 | 1,125.15 | ||
| TUV | Ann McClure | 4.81% | 595 | 595.00 | 604.00 | 604.00 | 624.00 | |||
| Alliance | Chris Shannon | 3.66% | 453 | 453.75 | 578.45 | 597.45 | ||||
| SDLP | Charlotte Carson | 1.98% | 245 | 248.55 | ||||||
| Green (NI) | Ange Cruz | 1.20% | 149 | 149.35 | ||||||
| Workers' Party | Fiona McCarthy | 0.37% | 46 | 46.30 | ||||||
| Electorate: 23,871 Valid: 12,366 (51.80%) Spoilt: 193 Quota: 1,767 Turnout: 12,559 (52.61%) | ||||||||||
2019 Election
2014: 3 × Sinn Féin, 1 × SDLP, 1 × DUP, 1 × PUP
2019: 3 × Sinn Féin, 1 × SDLP, 1 × DUP, 1 × People Before Profit
2014-2019 Change: People Before Profit gain from PUP
| Party | Candidate | FPv% | Count | ||||||||||
|---|---|---|---|---|---|---|---|---|---|---|---|---|---|
| 1 | 2 | 3 | 4 | 5 | 6 | 7 | 8 | 9 | 10 | ||||
| SDLP | Paul McCusker* | 25.21% | 2,856 | ||||||||||
| DUP | Dale Pankhurst* | 15.01% | 1,701 | ||||||||||
| Sinn Féin | Ryan Murphy* | 10.46% | 1,185 | 1,326.6 | 1,333 | 1,333.04 | 1,333.04 | 1,341.44 | 1,341.44 | 1,362.2 | 1,835.2 | ||
| Sinn Féin | Shauneen Baker † | 9.77% | 1,107 | 1,264.44 | 1,278.48 | 1,278.76 | 1,279.24 | 1,298.12 | 1,302.12 | 1,374.24 | 1,680.72 | ||
| Sinn Féin | J. J. Magee* | 10.01% | 1,134 | 1,244.4 | 1,250.28 | 1,250.28 | 1,251.32 | 1,261.68 | 1,264.68 | 1,285.96 | 1,404.84 | 1,616.03 | |
| People Before Profit | Fiona Ferguson | 3.94% | 447 | 781.08 | 829.88 | 829.96 | 835.44 | 951.16 | 995.24 | 1,336.6 | 1,401.76 | 1,404.7 | |
| DUP | Gillian Simpson | 5.05% | 573 | 577.8 | 577.8 | 631.88 | 735.96 | 738.48 | 1,198.16 | 1,240.72 | 1,240.72 | 1,240.72 | |
| Sinn Féin | Mary Clarke* | 7.02% | 796 | 1,009.6 | 1,015.48 | 1,015.48 | 1,015.96 | 1,029.76 | 1,032.76 | 1,058.36 | |||
| Alliance | Jack Armstrong | 3.44% | 390 | 535.92 | 554.04 | 554.08 | 576.16 | 691.32 | 756.88 | ||||
| PUP | Julie-Anne Corr-Johnston* | 5.07% | 575 | 582.2 | 584.68 | 595.68 | 677.28 | 689.32 | |||||
| Green (NI) | Lesley Veronica | 2.03% | 231 | 296.76 | 320.6 | 320.8 | 331.28 | ||||||
| Ulster Unionist | Jason Docherty | 2.11% | 239 | 242.84 | 242.84 | 244.84 | |||||||
| Workers' Party | Chris Bailie | 0.82% | 93 | 141 | |||||||||
| Electorate: 22,024 Valid: 11,327 (51.43%) Spoilt: 218 Quota: 1,619 Turnout: 11,545 (52.42%) | |||||||||||||
2014 Election
2011: 3 x Sinn Féin, 2 x DUP, 1 x SDLP
2014: 3 x Sinn Féin, 1 x DUP, 1 x SDLP, 1 x PUP
2011-2014 Change: PUP gain from DUP
| Party | Candidate | FPv% | Count | ||||||||||||
|---|---|---|---|---|---|---|---|---|---|---|---|---|---|---|---|
| 1 | 2 | 3 | 4 | 5 | 6 | 7 | 8 | 9 | 10 | 11 | 12 | ||||
| Sinn Féin | Mary Clarke | 14.80% | 1,559 | ||||||||||||
| Sinn Féin | J.J. Magee* | 11.77% | 1,240 | 1,250 | 1,260 | 1,263.18 | 1,263.18 | 1,275.2 | 1,279.3 | 1,831.3 | |||||
| Sinn Féin | Gerry McCabe* † | 11.46% | 1,207 | 1,214 | 1,226 | 1,229.69 | 1,229.69 | 1,239.7 | 1,239.7 | 1,341 | 1,627.4 | ||||
| DUP | Gareth McKee* † | 10.81% | 1,139 | 1,141 | 1,141 | 1,141.03 | 1,213.03 | 1,234 | 1,437 | 1,438.1 | 1,438.1 | 2,116.1 | |||
| PUP | Julie-Anne Corr | 7.35% | 774 | 788 | 788 | 788.12 | 899.12 | 907.15 | 1,031.2 | 1,031.2 | 1,031.2 | 1,163.2 | 1,658.2 | ||
| SDLP | Nichola Mallon*† | 8.76% | 923 | 955 | 970 | 972.73 | 972.73 | 1,110.8 | 1,119.8 | 1,176.7 | 1,204.6 | 1,211.6 | 1,219.6 | 1,247.6 | |
| Independent | Dee Fennell | 8.03% | 846 | 859 | 980 | 982.55 | 984.55 | 1,004.6 | 1,008.6 | 1,035.1 | 1,042.5 | 1,046.5 | 1,050.5 | 1,086.5 | |
| DUP | Lee Reynolds* | 7.25% | 764 | 768 | 768 | 768 | 802 | 817 | 888 | 889 | 889 | ||||
| Sinn Féin | John Loughran | 6.62% | 697 | 711 | 730 | 763.39 | 763.39 | 782.48 | 784.48 | ||||||
| Ulster Unionist | Colin Houston | 3.47% | 366 | 371 | 372 | 372.03 | 461.03 | 481.03 | |||||||
| Alliance | Peter McReynolds | 3.04% | 320 | 347 | 349 | 349.3 | 352.3 | ||||||||
| TUV | Wayne Gilmour | 3.01% | 317 | 320 | 320 | 320 | |||||||||
| Republican Network | Sammy Cusick | 2.09% | 220 | 231 | |||||||||||
| Workers' Party | Christopher Bailie | 1.55% | 163 | ||||||||||||
| Electorate: 20,888 Valid: 10,535 (50.44%) Spoilt: 258 Quota: 1,506 Turnout: 10,793 (51.67%) | |||||||||||||||
2011 Election
2005: 3 x Sinn Féin, 1 x DUP, 1 x SDLP, 1 x UUP
2011: 3 x Sinn Féin, 2 x DUP, 1 x SDLP
2005-2011 Change: DUP gain from UUP
| Party | Candidate | FPv% | Count | |||||
|---|---|---|---|---|---|---|---|---|
| 1 | 2 | 3 | 4 | 5 | ||||
| DUP | Ian Crozier* | 16.31% | 1,770 | |||||
| Sinn Féin | Conor Maskey | 14.49% | 1,573 | |||||
| DUP | Gareth McKee | 8.45% | 917 | 1,108.04 | 1,115.52 | 1,150.84 | 1,570.84 | |
| Sinn Féin | Gerard McCabe | 13.75% | 1,492 | 1,492 | 1,510 | 1,514 | 1,568 | |
| Sinn Féin | Danny Lavery* | 12.62% | 1,370 | 1,370.48 | 1,382.48 | 1,391.48 | 1,459.6 | |
| SDLP | Nichola Mallon | 10.91% | 1,184 | 1,185.56 | 1,217.68 | 1,334.68 | 1,430.48 | |
| Sinn Féin | Mary Clarke | 10.87% | 1,180 | 1,180.12 | 1,189.12 | 1,203.12 | 1,255.12 | |
| Ulster Unionist | Fred Rodgers | 4.98% | 540 | 551.76 | 556.76 | 613.12 | ||
| Irish Republican Socialist | Paul Little | 3.49% | 379 | 379.24 | 398.24 | 406.24 | ||
| Alliance | James McClure | 2.79% | 303 | 305.16 | 319.28 | |||
| Independent | Martin McAuley | 1.35% | 146 | 146.84 | ||||
| Electorate: 22,408 Valid: 10,854 (48.44%) Spoilt: 405 Quota: 1,551 Turnout: 11,259 (50.25%) | ||||||||
2005 Election
2001: 3 x Sinn Féin, 1 x SDLP, 1 x DUP, 1 x PUP
2005: 3 x Sinn Féin, 1 x DUP, 1 x SDLP, 1 x UUP
2001-2005 Change: UUP gain from PUP
| Party | Candidate | FPv% | Count | |||||||
|---|---|---|---|---|---|---|---|---|---|---|
| 1 | 2 | 3 | 4 | 5 | 6 | 7 | ||||
| DUP | Nelson McCausland* | 22.27% | 2,642 | |||||||
| Sinn Féin | Danny Lavery* | 17.64% | 2,093 | |||||||
| Sinn Féin | Margaret McClenaghan* | 15.42% | 1,829 | |||||||
| SDLP | Alban Maginness* | 11.90% | 1,411 | 1,418.03 | 1,450.33 | 1,538.39 | 1,549.17 | 1,966.17 | ||
| Ulster Unionist | Fred Cobain | 7.91% | 938 | 1,594.01 | 1,594.01 | 1,652.29 | 1,652.43 | 1,663.1 | 1,685.1 | |
| Sinn Féin | Caral Ni Chuilin | 10.47% | 1,242 | 1,243.48 | 1,468.63 | 1,495.01 | 1,585.31 | 1,600.85 | 1,657.85 | |
| PUP | Billy Hutchinson* | 3.84% | 455 | 690.69 | 691.45 | 732.59 | 732.66 | 735.22 | 757.22 | |
| Sinn Féin | Marie Mackessy | 3.94% | 467 | 468.85 | 586.08 | 600.22 | 622.2 | 651.74 | 715.74 | |
| SDLP | Andrew Harding | 4.01% | 476 | 479.33 | 487.69 | 539.44 | 540.07 | |||
| Green (NI) | Peter Emerson | 2.10% | 249 | 278.6 | 280.5 | |||||
| Workers' Party | Paul Treanor | 0.51% | 60 | 60.37 | 62.08 | |||||
| Electorate: 22,444 Valid: 11,862 (52.85%) Spoilt: 329 Quota: 1,695 Turnout: 12,191 (59.63%) | ||||||||||
2001 Election
1997: 3 x Sinn Féin, 1 x SDLP, 1 x UUP, 1 x PUP
2001: 3 x Sinn Féin, 1 x SDLP, 1 x DUP, 1 x PUP
1997-2001 Change: DUP gain from UUP
| Party | Candidate | FPv% | Count | ||||||||
|---|---|---|---|---|---|---|---|---|---|---|---|
| 1 | 2 | 3 | 4 | 5 | 6 | 7 | 8 | ||||
| Sinn Féin | Gerard Brophy | 17.25% | 2,755 | ||||||||
| Sinn Féin | Margaret McClenaghan | 15.44% | 2,467 | ||||||||
| DUP | Nelson McCausland* | 14.97% | 2,392 | ||||||||
| SDLP | Martin Morgan* | 12.09% | 1,932 | 1,958.52 | 1,993.69 | 2,006.81 | 2,007.56 | 2,931.56 | |||
| PUP | Billy Hutchinson* | 9.49% | 1,516 | 1,516.85 | 1,608.02 | 1,608.5 | 1,648.65 | 1,670.24 | 1,704.24 | 2,471.24 | |
| Sinn Féin | Eoin O'Broin | 5.99% | 957 | 1,298.36 | 1,315.53 | 1,455.69 | 1,455.79 | 1,534.41 | 1,837.41 | 1,857.46 | |
| Sinn Féin | Kathy Stanton | 8.13% | 1,298 | 1,340.67 | 1,344.35 | 1,360.99 | 1,361.04 | 1,391.08 | 1,501.08 | 1,510.14 | |
| Ulster Unionist | Fred Proctor* | 6.99% | 1,116 | 1,116.34 | 1,246.51 | 1,246.51 | 1,311.01 | 1,327.35 | 1,355.35 | ||
| SDLP | Joleen Connelly | 6.97% | 1,114 | 1,151.06 | 1,202.06 | 1,210.86 | 1,211.01 | ||||
| Independent | James Bates | 1.31% | 209 | 209.17 | |||||||
| Alliance | Thomas McCullough | 1.00% | 160 | 161.36 | |||||||
| Independent | Rene Graig | 0.37% | 59 | 59.17 | |||||||
| Electorate: 23,866 Valid: 15,975 (66.94%) Spoilt: 687 Quota: 2,283 Turnout: 16,662 (69.81%) | |||||||||||
1997 Election
1993: 3 x Sinn Féin, 2 x UUP, 1 x SDLP
1997: 3 x Sinn Féin, 1 x SDLP, 1 x UUP, 1 x PUP
1993-1997 Change: PUP gain from UUP
| Party | Candidate | FPv% | Count | ||||||||||
|---|---|---|---|---|---|---|---|---|---|---|---|---|---|
| 1 | 2 | 3 | 4 | 5 | 6 | 7 | 8 | 9 | 10 | ||||
| Sinn Féin | Mick Conlon | 16.40% | 2,317 | ||||||||||
| Sinn Féin | Bobby Lavery* | 15.79% | 2,230 | ||||||||||
| Sinn Féin | Paddy McManus* | 12.55% | 1,773 | 2,034 | |||||||||
| SDLP | Martin Morgan* | 13.74% | 1,941 | 1,949.28 | 2,082.12 | ||||||||
| PUP | Billy Hutchinson | 11.20% | 1,582 | 1,582.12 | 1,583.2 | 1,583.36 | 1,592.36 | 1,613.36 | 1,658.9 | 1,879.9 | 1,924.84 | 2,070.84 | |
| Ulster Unionist | Fred Proctor* | 9.32% | 1,316 | 1,316 | 1,316 | 1,316 | 1,316 | 1,340 | 1,361 | 1,431 | 1,447.8 | 1,675.8 | |
| Ulster Unionist | Fred Rodgers* | 8.13% | 986 | 986 | 986 | 986 | 986 | 1,004 | 1,031 | 1,082 | 1,096.83 | 1,397.69 | |
| DUP | David Smylie | 4.66% | 659 | 659 | 659 | 659 | 659 | 659 | 674 | 737 | 743.86 | ||
| SDLP | Dympna O'Hara | 2.58% | 365 | 366.92 | 402.83 | 462.51 | 505.35 | 561.57 | 645.27 | 646.27 | |||
| Ulster Democratic | Paddy Bird | 3.02% | 427 | 427 | 427.27 | 427.27 | 429.39 | 434.39 | 451.39 | ||||
| Green (NI) | Peter Emerson | 1.73% | 245 | 246.8 | 273.8 | 275.08 | 286.56 | 333.72 | |||||
| Alliance | Mark Long | 1.25% | 177 | 177.36 | 179.79 | 181.23 | 198.47 | ||||||
| Workers' Party | Steven Doran | 0.77% | 109 | 110.92 | 119.83 | 120.31 | |||||||
| Electorate: 25,054 Valid: 14,127 (56.39%) Spoilt: 458 Quota: 2,019 Turnout: 14,585 (58.21%) | |||||||||||||
1993 Election
1989: 2 x Sinn Féin, 2 x UUP, 1 x SDLP, 1 x Workers' Party
1993: 3 x Sinn Féin, 2 x UUP, 1 x SDLP
1989-1993 Change: Sinn Féin gain from Workers' Party
| Party | Candidate | FPv% | Count | |||||||||
|---|---|---|---|---|---|---|---|---|---|---|---|---|
| 1 | 2 | 3 | 4 | 5 | 6 | 7 | 8 | 9 | ||||
| Sinn Féin | Joe Austin | 15.02% | 2,229 | |||||||||
| Ulster Unionist | Fred Proctor* | 13.78% | 2,045 | 2,045 | 2,085 | 2,091 | 2,138 | |||||
| SDLP | Martin Morgan | 11.88% | 1,763 | 1,766.48 | 1,768.48 | 1,817.48 | 1,903.56 | 2,028.68 | 2,553.68 | |||
| Sinn Féin | Paddy McManus* | 11.92% | 1,769 | 1,810.36 | 1,810.36 | 1,822.48 | 1,836.72 | 1,840.8 | 1,852 | 1,873 | 1,982.68 | |
| Sinn Féin | Bobby Lavery | 10.90% | 1,617 | 1,654.12 | 1,654.12 | 1,666.2 | 1,685.72 | 1,696.04 | 1,707.12 | 1,767.12 | 1,919.64 | |
| Ulster Unionist | Fred Rodgers | 9.05% | 1,343 | 1,343 | 1,394 | 1,400 | 1,417 | 1,542 | 1,548 | 1,555 | 1,724 | |
| DUP | David Smylie | 8.92% | 1,324 | 1,324.04 | 1,376.04 | 1,383.04 | 1,405.04 | 1,436.04 | 1,438.04 | 1,438.04 | 1,474.04 | |
| Democratic Left | Seamus Lynch* | 5.61% | 832 | 833.92 | 837.92 | 892.96 | 962.04 | 1,118.04 | 1,154.04 | 1,352.04 | ||
| SDLP | Peter Prendiville | 3.96% | 588 | 588.44 | 590.44 | 607.44 | 626.44 | 645.44 | ||||
| Alliance | Beatrice Boyd | 3.19% | 473 | 473.84 | 483.84 | 501.84 | 584.92 | |||||
| Green (NI) | Peter Emerson | 2.65% | 393 | 394.12 | 421.12 | 447.12 | ||||||
| Workers' Party | Margaret Smith | 1.75% | 259 | 259.32 | 261.32 | |||||||
| NI Conservatives | David Tarr | 1.39% | 206 | 206 | ||||||||
| Electorate: 25,943 Valid: 14,841 (57.21%) Spoilt: 532 Quota: 2,121 Turnout: 15,373 (59.26%) | ||||||||||||
1989 Election
1985: 2 x Sinn Féin, 1 x UUP, 1 x SDLP, 1 x DUP, 1 x Workers' Party
1989: 2 x Sinn Féin, 2 x UUP, 1 x SDLP, 1 x Workers' Party
1985-1989 Change: UUP gain from DUP
| Party | Candidate | FPv% | Count | ||||||
|---|---|---|---|---|---|---|---|---|---|
| 1 | 2 | 3 | 4 | 5 | 6 | ||||
| SDLP | Brian Feeney* | 18.38% | 2,426 | ||||||
| Workers' Party | Seamus Lynch* | 12.42% | 1,639 | 1,912.6 | |||||
| Ulster Unionist | Fred Proctor* | 14.02% | 1,850 | 1,850.96 | 1,976.96 | ||||
| Ulster Unionist | William Gault | 9.05% | 780 | 782.64 | 886.56 | 951.36 | 1,491.96 | 2,050.96 | |
| Sinn Féin | Gerard McGuigan* | 12.75% | 1,682 | 1,706.96 | 1,723.84 | 1,723.84 | 1,723.84 | 1,725.84 | |
| Sinn Féin | Paddy McManus | 11.73% | 1,548 | 1,572.24 | 1,585.2 | 1,586.1 | 1,588.1 | 1,592.82 | |
| Sinn Féin | William McGarry | 8.45% | 1,115 | 1,153.16 | 1,187.2 | 1,187.2 | 1,188.44 | 1,206 | |
| Ulster Democratic | Patrick Bird | 6.34% | 837 | 837.72 | 883.36 | 896.86 | 1,117.84 | ||
| DUP | Stanley Mulholland | 6.10% | 805 | 805.24 | 839.4 | 851.1 | |||
| Alliance | George Jones | 3.36% | 443 | 610.52 | |||||
| Ulster Democratic | William Clark | 0.54% | 71 | 71.24 | |||||
| Electorate: 25,895 Valid: 13,196 (50.96%) Spoilt: 548 Quota: 1,886 Turnout: 13,744 (53.08%) | |||||||||
1985 Election
1985: 2 x Sinn Féin, 1 x UUP, 1 x SDLP, 1 x DUP, 1 x Workers' Party
| Party | Candidate | FPv% | Count | |||||||||||||
|---|---|---|---|---|---|---|---|---|---|---|---|---|---|---|---|---|
| 1 | 2 | 3 | 4 | 5 | 6 | 7 | 8 | 9 | 10 | 11 | 12 | 13 | ||||
| Ulster Unionist | Fred Proctor | 12.54% | 1,800 | 1,820 | 1,903 | 1,918 | 2,013 | 2,125 | ||||||||
| Sinn Féin | Bobby Lavery | 12.20% | 1,752 | 1,765 | 1,766 | 1,786 | 1,793 | 1,794 | 2,373 | |||||||
| Sinn Féin | Gerard McGuigan | 10.93% | 1,570 | 1,576 | 1,576 | 1,585 | 1,591 | 1,591 | 1,726 | 2,030.7 | ||||||
| SDLP | Brian Feeney* | 10.56% | 1,516 | 1,544 | 1,544 | 1,677 | 1,841 | 1,842 | 1,863 | 1,867.4 | 1,867.4 | 2,475.4 | ||||
| Workers' Party | Seamus Lynch | 9.36% | 1,344 | 1,383 | 1,386 | 1,531 | 1,696 | 1,701 | 1,731 | 1,735.4 | 1,735.4 | 1,895.5 | 2,226.5 | |||
| DUP | Peter Lunn | 6.67% | 958 | 974 | 1,054 | 1,056 | 1,082 | 1,523 | 1,523 | 1,523 | 1,537.6 | 1,539.6 | 1,542.6 | 1,549.6 | 1,824.6 | |
| Ulster Unionist | David Smylie | 4.94% | 709 | 717 | 813 | 817 | 857 | 983 | 985 | 985 | 1,036.83 | 1,039.83 | 1,041.83 | 1,066.83 | 1,573.83 | |
| Ind. Unionist | Nelson McCausland | 4.99% | 717 | 729 | 815 | 825 | 872 | 919 | 920 | 920 | 926.57 | 930.57 | 934.57 | 951.57 | ||
| SDLP | Patrick Hunter | 5.48% | 787 | 812 | 814 | 867 | 913 | 913 | 922 | 924.2 | 924.2 | |||||
| Sinn Féin | Paddy McManus | 5.39% | 774 | 781 | 781 | 787 | 787 | 787 | ||||||||
| DUP | Pauline Whittley | 4.76% | 684 | 691 | 735 | 739 | 748 | |||||||||
| Alliance | Arnold Carton | 3.73% | 535 | 597 | 618 | 695 | ||||||||||
| Labour Party NI | Paddy Devlin* | 3.29% | 472 | 506 | 518 | |||||||||||
| PUP | Patrick Bird | 3.02% | 433 | 444 | ||||||||||||
| Green (NI) | Peter Emerson | 2.14% | 308 | |||||||||||||
| Electorate: 25,774 Valid: 14,359 (55.71%) Spoilt: 389 Quota: 2,052 Turnout: 14,748 (57.22%) | ||||||||||||||||
See also
References
- "Ward Information for Ardoyne ward 95GG02". NISRA. Retrieved 22 December 2013.
- "Ward Information for Ballysillan ward 95GG06". NISRA. Retrieved 22 December 2013.
- "Ward Information for Cliftonville ward 95GG17". NISRA. Retrieved 22 December 2013.
- "Ward Information for Legoniel ward 95GG32". NISRA. Retrieved 22 December 2013.
- "Ward Information for New Lodge ward 95GG35". NISRA. Retrieved 22 December 2013.
- "Ward Information for Water Works ward 95GG47". NISRA. Retrieved 22 December 2013.
- "Northern Ireland council election: List of all the candidates in the May 2023 poll". Belfast Live. Retrieved 6 May 2023.
- Elections 2011: Oldpark, Belfast City Council
- "Oldpark Result Sheet" (PDF). EONI. Retrieved 8 July 2021.
- "Local Government Results 2005". EONI. Retrieved 8 July 2021.
- "Local Government Results 2001". EONI. Retrieved 8 July 2021.
- "Local Government Results 1997". EONI. Retrieved 8 July 2021.
- "Local Government Results 1993". EONI. Retrieved 8 July 2021.
- "Local Government Results 1989". EONI. Retrieved 8 July 2021.
- "Local Government Results 1985". EONI. Retrieved 8 July 2021.
Places adjacent to Oldpark (District Electoral Area) | |
|---|---|