Water footprint
A water footprint shows the extent of water use in relation to consumption by people.[1] The water footprint of an individual, community, or business is defined as the total volume of fresh water used to produce the goods and services consumed by the individual or community or produced by the business. Water use is measured in water volume consumed (evaporated) and/or polluted per unit of time. A water footprint can be calculated for any well-defined group of consumers (e.g., an individual, family, village, city, province, state, or nation) or producers (e.g., a public organization, private enterprise, or economic sector), for a single process (such as growing rice) or for any product or service.[2]
Traditionally, water use has been approached from the production side, by quantifying the following three columns of water use: water withdrawals in the agricultural, industrial, and domestic sector. While this does provide valuable data, it is a limited way of looking at water use in a globalised world, in which products are not always consumed in their country of origin. International trade of agricultural and industrial products in effect creates a global flow of virtual water, or embodied water (akin to the concept of embodied energy).[1]
In 2002, the water footprint concept was introduced in order to have a consumption-based indicator of water use, that could provide useful information in addition to the traditional production-sector-based indicators of water use. It is analogous to the ecological footprint concept introduced in the 1990s. The water footprint is a geographically explicit indicator, not only showing volumes of water use and pollution, but also the locations.[3] The worldwide water footprinting issue highlights the significance of fair and sustainable resource management. A transition towards fair water impact is a viable approach as water shortages, climate change, and environmental issues continue to increase. With this method, the world may move toward managing water resources effectively. Thus, it gives a grasp on how economic choices and processes influence the availability of adequate water resources and other ecological realities across the globe (and vice versa).
Definition and measures
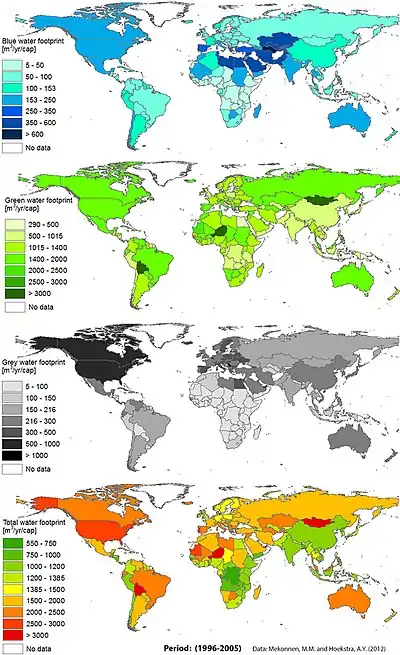
Water footprinting is a complex method to measure the volume of water consumed, directly or indirectly, to produce goods and services. This measurement can be applied to any of consumer or producer groups, ranging from single individuals, companies, and all over the world.[4] There are many different aspects to water footprint and therefore different definitions and measures to describe them. Blue water footprint refers to groundwater or surface water usage, green water footprint refers to rainwater, and grey water footprint refers to the amount of water needed to dilute pollutants.[5]
Blue water footprint
A blue water footprint refers to the volume of water that has been sourced from surface or groundwater resources (lakes, rivers, wetlands and aquifers) and has either evaporated (for example while irrigating crops), or been incorporated into a product or taken from one body of water and returned to another, or returned at a different time. Irrigated agriculture, industry and domestic water use can each have a blue water footprint.[6] According to “Evaluation of Environmental Impacts Due to Blue Water Consumption in China from Production and Consumption Perspectives.” by Multidisciplinary Digital Publish Institute it claims that “Based on the study of Kummu et al., the global blue water consumption per capita has increased from 209 m3/(year∙capita) in the 1900s to 230 m3/(year∙capita) in the 2000s, and total blue water consumption increased fourfold within the same period when taking the increase of the global population into consideration.”[7] Blue water consumption as shown in this article, is a huge part of everyday lives based off of the drastic increase between the years. “We use blue water scarcity to measure the environmental sustainability of the blue water footprint. It’s a measure of the blue water footprint compared to the water available after considering environmental flow requirements. When the blue water footprint is larger than the available water, environmental flows are not met and over time, freshwater ecosystems degrade”, says Water Footprint Network in the “What is Water Footprint” article.[8] Based on this article, maintaining a consistent blue water footprint can be highly advantageous, but it can also become a problem if it grows too big and isn't taken care of. It is important to assess blue water footprint to understand the environmental impact of water consumption and to promote sustainable water management practices. Volume of surface and groundwater used from sources like rivers and aquifers.[9] This water is used for various purposes such as irrigation, industrial processes, and domestic consumption. Managing and reducing blue water footprint is important to ensure sustainable water use, and address water scarcity.
Green water footprint
A green water footprint refers to the amount of water from precipitation that, after having been stored in the root zone of the soil (green water), is either lost by evapotranspiration or incorporated by plants. It is particularly relevant for agricultural, horticultural and forestry products.[6] Green water footprint is important for many different reasons. One being sustainable agriculture. Understanding the green water footprint helps in sustainable farming practices. According to “The Value of Rainwater: Why Green Water Footprints Matter.” by GRACE communications foundation, “Shifting precipitation patterns under climate change have changed the timing and amount of precipitation compared to the past. As this shift towards less predictable “drought and deluge” cycles occur, risks increase for farmers in terms of planning, planting and eventual harvests. Just because a given crop in a certain place or time depends more on irrigation and less on rainwater doesn’t mean it can survive without the rainwater.” [10] In the Article "Water Footprint and Why it is Important" by Rick LeBlanc it states as well "If coffee plants are not irrigated and rely on green water from rainfall, then they are utilizing water but not consuming it, as they would be if the water was being drawn from an aquifer or a body of water. It is important to consider the geographical and climatic context. Where there is abundant rainwater, the impact of water usage by the coffee plants on the ecosystem is minimal compared to more arid growing areas." [11] This demonstrates that while a plant can use water without the green water aspect, it cannot consume it. It will therefore become less healthy than if the green water from the rain had been used. Rainwater stored in soil and used for crop growth or ecosystems.[12] The volume of water from soil moisture consumed in the production process, primarily through agricultural activities. Green water footprint is essential mainly for the purpose of agriculture because without it, especially in dryer climates, it is almost impossible to create healthy crops.
Grey water footprint
A grey water footprint refers to the volume of water that is required to dilute pollutants (industrial discharges, seepage from tailing ponds at mining operations, untreated municipal wastewater, or nonpoint source pollution such as agricultural runoff or urban runoff) to such an extent that the quality of the water meets agreed water quality standards.[6] It is calculated as:

where L is the pollutant load (as mass flux), cmax the maximum allowable concentration and cnat the natural concentration of the pollutant in the receiving water body (both expressed in mass/volume).[13]
Grey water is known as wastewater produced by everyday activities including bathing, cleaning dishes, and washing clothing. Understanding the environmental effects of our daily actions, such as water use and pollution, is made easier by looking at our grey water footprint. There are multiple benefits to including a grey water recycling system in homes. “Benefits of Greywater Recycling Systems” by Global Water Group of Companies states that, “ By reusing your household greywater, you are contributing to water conservation. Usage of tap water declines by 16-45 percent in households that reuse their greywater. Beyond your backyard, greywater can also be reused to become an additional source to existing water supplies in drought-stricken areas.” [14] Although there are benefits to including grey water recycling in everyday lives, there are also downsides to it. Grey water can also be considered a dangerous water footprint. According to “What is Gray water” by Friends of the Earth, it states “Gray water can lead to oxygen depletion and spread bacteria. It also leads to higher levels of nutrients in the ocean ecosystem which can result in toxic algal blooms and dead zones”.[15] This is why it is so important to manage this water footprint correctly. Freshwater volume required to assimilate pollutants in water bodies.[16] This category is particularly relevant when considering industrial waste or agricultural runoff. Being able to manage this footprint is crucial for minimizing pollution and optimizing water use in a sustainable and environmentally friendly manner.
Ground Water Footprint:
According to “Water balance of global aquifers revealed by groundwater footprint” by Tom Gleeson, Yoshihide Wada, Marc F. P. Bierkens & Ludovicus P. H. van Beek, “Ground Water Footprint is the area required to sustain groundwater use and groundwater-dependent ecosystem services of a region of interest, such as an aquifer, watershed or community.” [7] It refers to the total amount of groundwater that is taken from aquifers to meet human needs. According to “Our Oversized Groundwater Footprint” by Sandra Postel, it is claimed that “the size of the global groundwater footprint – defined as the area required to sustain groundwater use and groundwater-dependent ecosystem services — is about 3.5 times the actual area of aquifers tapped for water supplies”.[17] This is showing the clear importance of groundwater footprint, but also how in demand it is as well. Majority of people rely on groundwater as their source of water and having enough aquifers along with keeping it sanitary is extremely important. "For example, water foot printing, provides quantitative evidence to indicate which water bodies are preferable for extracting or discharging water."[18] Is said in "The how and why of measuring your water footprint". by Adrian Johnson. This is further explaining how Ground Water footprint is more preferred as the way of extracting water, initiating how important it is to keep healthy. Due to the fact that most people around the world depend on groundwater, it is extremely important to keep the environment it is found in sanitary as well. “Without groundwater it can lead to things like reduced water levels in rivers and lakes and altered ecosystems”.[17] Managing the ground water footprint is extremely important to maintain long term water sustainability.
Calculation for different factors
The water footprint of a process is expressed as volumetric flow rate of water. That of a product is the whole footprint (sum) of processes in its complete supply chain divided by the number of product units. For consumers, businesses and geographic area, water footprint is indicated as volume of water per time, in particular:[13]
- That of a consumer is the sum of footprint of all consumed products.
- That of a community or a nation is the sum for all of its members resp. inhabitants.
- That of a business is the footprint of all produced goods.
- That of a geographically delineated area is the footprint of all processes undertaken in this area. The virtual change in water of an area is the net import of virtual water Vi, net, defined as the difference of the gross import Vi of virtual water from its gross export Ve. The water footprint of national consumption WFarea,nat results from this as the sum of the water footprint of national area and its virtual change in water.
Equipment for Manual Data Collection
Databases and computing tools are very important for figuring out an individual's water footprint. However, specific equipment is essential for primary data collection such as:
History
The concept of a water footprint was coined in 2002, by Arjen Hoekstra, Professor in water management at the University of Twente, Netherlands, and co-founder and scientific director of the Water Footprint Network, whilst working at the UNESCO-IHE Institute for Water Education, as a metric to measure the amount of water consumed and polluted to produce goods and services along their full supply chain.[23][24][25] Water footprint is one of a family of ecological footprint indicators, which also includes carbon footprint and land footprint. The water footprint concept is further related to the idea of virtual water trade introduced in the early 1990s by Professor John Allan (2008 Stockholm Water Prize Laureate). The most elaborate publications on how to estimate water footprints are a 2004 report on the Water footprint of nations from UNESCO-IHE,[26] the 2008 book Globalization of Water,[27] and the 2011 manual The water footprint assessment manual: Setting the global standard.[28] This term was created to offer insight into the water-intensive nature of various commodities, especially in global trade where water was scarce in nations that might import water-intensive goods. Cooperation between global leading institutions in the field has led to the establishment of the Water Footprint Network in 2008. Records, which were limited to data from 1996-2005, have been revisited and expanded upon. Contemporary research has shed light on nations' water footprints ranging from 2000 to 2020. This updated information provides valuable insights for policymakers and environmentalists.
Water Footprint Network (WFN)
The Water Footprint Network is an international learning community (a non-profit foundation under Dutch law) which serves as a platform for sharing knowledge, tools and innovations among governments, businesses and communities concerned about growing water scarcity and increasing water pollution levels, and their impacts on people and nature. The network consists of around 100 partners from all sectors – producers, investors, suppliers and regulators – as well as non-governmental organisations and academics. It describes its mission as follows:
To provide science-based, practical solutions and strategic insights that empower companies, governments, individuals and small-scale producers to transform the way we use and share fresh water within earth's limits.[23]
International standard
In February 2011, the Water Footprint Network, in a global collaborative effort of environmental organizations, companies, research institutions and the UN, launched the Global Water Footprint Standard. In July 2014, the International Organization for Standardization issued ISO 14046:2014, Environmental management—Water footprint—Principles, requirements and guidelines, to provide practical guidance to practitioners from various backgrounds, such as large companies, public authorities, non-governmental organizations, academic and research groups as well as small and medium enterprises, for carrying out a water footprint assessment. The ISO standard is based on life-cycle assessment (LCA) principles and can be applied for different sorts of assessment of products and companies.[29]
Life-cycle assessment of water use
Life-cycle assessment (LCA) is a systematic, phased approach to assessing the environmental aspects and potential impacts that are associated with a product, process or service. "Life cycle" refers to the major activities connected with the product's life-span, from its manufacture, use, and maintenance, to its final disposal, and also including the acquisition of raw material required to manufacture the product.[30] Thus a method for assessing the environmental impacts of freshwater consumption was developed. It specifically looks at the damage to three areas of protection: human health, ecosystem quality, and resources. The consideration of water consumption is crucial where water-intensive products (for example agricultural goods) are concerned that need to therefore undergo a life-cycle assessment.[31] In addition, regional assessments are equally as necessary as the impact of water use depends on its location. An LCA looks at a raw material from the time it is made, when it is used, and when it is thrown away or recycled. In short, LCA is important as it identifies the impact of water use in certain products, consumers, companies, nations, etc. which can help reduce the amount of water used.[32]
Fair water footprint
Globally, many water footprints lead to negative impacts such as pollution, over-abstraction of resources, and degradation of ecosystems. Hoekstra and Mekonnen observed that 50% of the UK's external blue water footprint is situated in river basins and aquifers with unsustainable water usage.[33] Studies have consistently found unsustainability in water use across our footprints, especially in relation to the production of food, clothing, and mining in the Global South.[34][35]
Glasgow Declaration for Fair Water Footprints
At the COP26 event in 2021, international attention was garnered towards the Glasgow Declaration for Fair Water Footprints. This was a step towards the environmental and socio-economic ramifications of water footprints.[36] This statement shows that the "Global South" is carrying too much of the environmental load to meet the needs of the "Global North's" consumption habits.[37]
Water availability
Globally, about 4 percent of precipitation falling on land each year (about 117,000 km3 (28,000 cu mi)),[38] is used by rain-fed agriculture and about half is subject to evaporation and transpiration in forests and other natural or quasi-natural landscapes.[39] The remainder, which goes to groundwater replenishment and surface runoff, is sometimes called "total actual renewable freshwater resources". Its magnitude was in 2012 estimated at 52,579 km3 (12,614 cu mi)/year.[40] It represents water that can be used either in-stream or after withdrawal from surface and groundwater sources. Of this remainder, about 3,918 km3 (940 cu mi) were withdrawn in 2007, of which 2,722 km3 (653 cu mi), or 69 percent, were used by agriculture, and 734 km3 (176 cu mi), or 19 percent, by other industry.[41] Most agricultural use of withdrawn water is for irrigation, which uses about 5.1 percent of total actual renewable freshwater resources.[40] World water use has been growing rapidly in the last hundred years.[42][43]
Water footprint of products (agricultural sector)
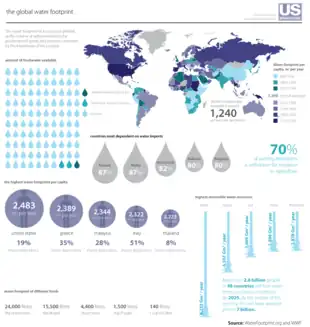
The water footprint of a product is the total volume of freshwater used to produce the product, summed over the various steps of the production chain. The water footprint of a product refers not only to the total volume of water used; it also refers to where and when the water is used.[44] The Water Footprint Network maintains a global database on the water footprint of products: WaterStat.[45] Nearly over 70% of the water supply worldwide is used in the agricultural sector.[46]
The water footprints involved in various diets vary greatly, and much of the variation tends to be associated with levels of meat consumption.[47] The following table gives examples of estimated global average water footprints of popular agricultural products.[48][49][50]
| Product | Global average water footprint, L/kg |
|---|---|
| almonds, shelled | 16,194 |
| apple | 822 |
| avocado | 283 |
| banana | 790 |
| beef | 15,415 |
| bread, wheat | 1,608 |
| butter | 5,553 |
| cabbage | 237 |
| cheese | 3,178 |
| chicken | 4,325 |
| chocolate | 17,196 |
| cotton lint | 9,114 |
| cucumber | 353 |
| dates | 2,277 |
| eggs | 3,300 |
| groundnuts, shell | 2,782 |
| leather (bovine) | 17,093 |
| lettuce | 238 |
| maize | 1,222 |
| mango/guava | 1,800 |
| milk | 1,021 |
| olive oil | 14,430 |
| orange | 560 |
| pasta (dry) | 1,849 |
| peach/nectarine | 910 |
| pork | 5,988 |
| potato | 287 |
| pumpkin | 353 |
| rice | 2,497 |
| tomatoes, fresh | 214 |
| tomatoes, dried | 4,275 |
| vanilla beans | 126,505 |
(For more product water footprints: see the Product Gallery of the Water Footprint Network Archived 2020-07-30 at the Wayback Machine)
Water footprint of companies (industrial sector)
The water footprint of a business, the 'corporate water footprint', is defined as the total volume of freshwater that is used directly or indirectly to run and support a business. It is the total volume of water use to be associated with the use of the business outputs. The water footprint of a business consists of water used for producing/manufacturing or for supporting activities and the indirect water use in the producer's supply chain.
The Carbon Trust argue that a more robust approach is for businesses to go beyond simple volumetric measurement to assess the full range of water impact from all sites. Its work with leading global pharmaceutical company GlaxoSmithKline (GSK) analysed four key categories: water availability, water quality, health impacts, and licence to operate (including reputational and regulatory risks) in order to enable GSK to quantitatively measure, and credibly reduce, its year-on-year water impact.[51]
The Coca-Cola Company operates over a thousand manufacturing plants in about 200 countries. Making its drink uses a lot of water. Critics say its water footprint has been large. Coca-Cola has started to look at its water sustainability.[52] It has now set out goals to reduce its water footprint such as treating the water it uses so it goes back into the environment in a clean state. Another goal is to find sustainable sources for the raw materials it uses in its drinks, such as sugarcane, oranges, and corn. By making its water footprint better, the company can reduce costs, improve the environment, and benefit the communities in which it operates.[53]
Water footprint of individual consumers (domestic sector)
The water footprint of an individual refers to the sum of their direct and indirect freshwater use. The direct water use is the water used at home, while the indirect water use relates to the total volume of freshwater that is used to produce the goods and services consumed.
The average global water footprint of an individual is 1,385 m3 per year. Residents of some example nations have water footprints as shown in the table:
| Nation | annual water footprint |
|---|---|
| China | 1,071 m3[54] |
| Finland | 1,733 m3[55] |
| India | 1,089 m3[54] |
| United Kingdom | 1,695 m3[56] |
| United States | 2,842 m3[57] |
Water footprint of nations
The water footprint of a nation is the amount of water used to produce the goods and services consumed by the inhabitants of that nation. Analysis of the water footprint of nations illustrates the global dimension of water consumption and pollution, by showing that several countries rely heavily on foreign water resources and that (consumption patterns in) many countries significantly and in various ways impact how, and how much, water is being consumed and polluted elsewhere on Earth. International water dependencies are substantial and are likely to increase with continued global trade liberalisation. The largest share (76%) of the virtual water flows between countries is related to international trade in crops and derived crop products. Trade in animal products and industrial products contributed 12% each to the global virtual water flows. The four major direct factors determining the water footprint of a country are: volume of consumption (related to the gross national income); consumption pattern (e.g. high versus low meat consumption); climate (growth conditions); and agricultural practice (water use efficiency).[1]
Production or consumption
The assessment of total water use in connection to consumption can be approached from both ends of the supply chain.[58] The water footprint of production estimates how much water from local sources is used or polluted in order to provide the goods and services produced in that country. The water footprint of consumption of a country looks at the amount of water used or polluted (locally, or in the case of imported goods, in other countries) in connection with all the goods and services that are consumed by the inhabitants of that country. The water footprint of production and that of consumption, can also be estimated for any administrative unit such as a city, province, river basin or the entire world.[1]
Absolute or per capita
The absolute water footprint is the total sum of water footprints of all people. A country's per capita water footprint (that nation's water footprint divided by its number of inhabitants) can be used to compare its water footprint with those of other nations.
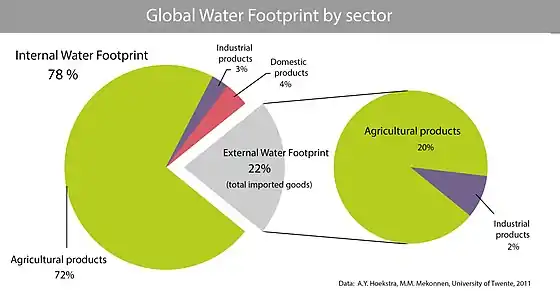
The global water footprint in the period 1996–2005 was 9.087 Gm3/yr (Billion Cubic Metres per year, or 9.087.000.000.000.000 liters/year), of which 74% was and green, 11% blue, 15% grey. This is an average amount per capita of 1.385 Gm3/yr., or 3.800 liters per person per day.[59] On average 92% of this is embedded in agricultural products consumed, 4.4% in industrial products consumed, and 3.6% is domestic water use. The global water footprint related to producing goods for export is 1.762 Gm3/y.[60]
In absolute terms, India is the country with the largest water footprint in the world, a total of 987 Gm3/yr. In relative terms (i.e. taking population size into account), the people of the USA have the largest water footprint, with 2480 m3/yr per capita, followed by the people in south European countries such as Greece, Italy and Spain (2300–2400 m3/yr per capita). High water footprints can also be found in Malaysia and Thailand. In contrast, the Chinese people have a relatively low per capita water footprint with an average of 700 m3/yr.[1] (These numbers are also from the period 1996-2005.)
Internal or external
The internal water footprint is the amount of water used from domestic water resources; the external water footprint is the amount of water used in other countries to produce goods and services imported and consumed by the inhabitants of the country. When assessing the water footprint of a nation, it is crucial to take into account the international flows of virtual water (also called embodied water, i.e. the water used or polluted in connection to all agricultural and industrial commodities) leaving and entering the country. When taking the use of domestic water resources as a starting point for calculating a nation's water footprint, one should subtract the virtual water flows that leave the country and add the virtual water flows that enter the country.[1]
The external part of a nation's water footprint varies strongly from country to country. Some African nations, such as Sudan, Mali, Nigeria, Ethiopia, Malawi and Chad have hardly any external water footprint, simply because they have little import. Some European countries on the other hand—e.g. Italy, Germany, the UK and the Netherlands—have external water footprints that constitute 50–80% of their total water footprint. The agricultural products that on average contribute most to the external water footprints of nations are: bovine meat, soybean, wheat, cocoa, rice, cotton and maize.[1]
The top 10 gross virtual water exporting nations, which together account for more than half of the global virtual water export, are the United States (314 Gm3/year), China (143 Gm3/year), India (125 Gm3/year), Brazil (112 Gm3/year), Argentina (98 Gm3/year), Canada (91 Gm3/year), Australia (89 Gm3/year), Indonesia (72 Gm3/year), France (65 Gm3/year), and Germany (64 Gm3/year).[60]
The top 10 gross virtual water importing nations are the United States (234 Gm3/year), Japan (127 Gm3/year), Germany (125 Gm3/year), China (121 Gm3/year), Italy (101 Gm3/year), Mexico (92 Gm3/year), France (78 Gm3/year), the United Kingdom (77 Gm3/year), and The Netherlands (71 Gm3/year).[60]
Water use in continents
Major Global North nations including the UK, Austria, Switzerland, and others were studied to understand worldwide consumption of water. A separate research examined the Global South, including Africa, Latin America, and Southeast Asia. This extensive analysis shows how global water consumption is complexly connected to issues, difficulties, and solutions. Slightly less than one half of the global population, 3.6 billion people or 47%, live in areas that suffer water scarcity at least 1 month each year.[61]
Europe
Each EU citizen consumes 4,815 litres of water per day on average; 44% is used in power production primarily to cool thermal plants or nuclear power plants. Energy production annual water consumption in the EU 27 in 2011 was, in billion m3: for gas 0.53, coal 1.54 and nuclear 2.44. Wind energy avoided the use of 387 million cubic metres (mn m3) of water in 2012, avoiding a cost of €743 million.[62][63]
Asia
In south India the state Tamil Nadu is one of the main agricultural producers in India and it relies largely in groundwater for irrigation. In ten years, from 2002 to 2012, the Gravity Recovery and Climate Experiment calculated that the groundwater reduced in 1.4 m yr−1, which "is nearly 8% more than the annual recharge rate."[46]
Environmental water use
Although agriculture's water use includes provision of important terrestrial environmental values (as discussed in the "Water footprint of products" section above), and much "green water" is used in maintaining forests and wild lands, there is also direct environmental use (e.g. of surface water) that may be allocated by governments. For example, in California, where water use issues are sometimes severe because of drought, about 48 percent of "dedicated water use" in an average water year is for the environment (somewhat more than for agriculture).[64] Such environmental water use is for keeping streams flowing, maintaining aquatic and riparian habitats, keeping wetlands wet, etc.
Criticism
Insufficient consideration of consequences of proposed water saving policies to farm households
According to Dennis Wichelns of the International Water Management Institute: "Although one goal of virtual water analysis is to describe opportunities for improving water security, there is almost no mention of the potential impacts of the prescriptions arising from that analysis on farm households in industrialized or developing countries. It is essential to consider more carefully the inherent flaws in the virtual water and water footprint perspectives, particularly when seeking guidance regarding policy decisions."[65]
Regional water scarcity should be taken into account when interpreting water footprint
The application and interpretation of water footprints may sometimes be used to promote industrial activities that lead to facile criticism of certain products. For example, the 140 litres required for coffee production for one cup[2] might be of no harm to water resources if its cultivation occurs mainly in humid areas, but could be damaging in more arid regions. Other factors such as hydrology, climate, geology, topography, population and demographics should also be taken into account. Nevertheless, high water footprint calculations do suggest that environmental concern may be appropriate.
Many of the criticisms, including the above ones, compare the description of the water footprint of a water system to generated impacts, which is about its performance. Such a comparison between descriptive and performance factors and indicators is basically flawed.[66]
The use of the term footprint can also confuse people familiar with the notion of a carbon footprint, because the water footprint concept includes sums of water quantities without necessarily evaluating related impacts. This is in contrast to the carbon footprint, where carbon emissions are not simply summarized but normalized by CO2 emissions, which are globally identical, to account for the environmental harm. The difference is due to the somewhat more complex nature of water; while involved in the global hydrological cycle, it is expressed in conditions both local and regional through various forms like river basins, watersheds, on down to groundwater (as part of larger aquifer systems). Furthermore, looking at the definition of the footprint itself, and comparing ecological footprint, carbon footprint and water footprint, we realize that the three terms are indeed legitimate.[66]
Sustainable water use
Sustainable water use involves the rigorous assessment of all source of clean water to establish the current and future rates of use, the impacts of that use both downstream and in the wider area where the water may be used and the impact of contaminated water streams on the environment and economic well being of the area. It also involves the implementation of social policies such as water pricing in order to manage water demand.[67] In some localities, water may also have spiritual relevance and the use of such water may need to take account of such interests. For example, the Maori believe that water is the source and foundation of all life and have many spiritual associations with water and places associated with water.[68] On a national and global scale, water sustainability requires strategic and long term planning to ensure appropriate sources of clean water are identified and the environmental and economic impact of such choices are understood and accepted.[69] The re-use and reclamation of water is also part of sustainability including downstream impacts on both surface waters and ground waters.[53]
Sustainability assessment
Water footprint accounting has advanced substantially in recent years, however, water footprint analysis also needs sustainability assessment as its last phase.[28] One of the developments is to employ sustainable efficiency and equity ("Sefficiency in Sequity"), which present a comprehensive approach to assessing the sustainable use of water.[66][70]
Sectoral distributions of withdrawn water use
Several nations estimate sectoral distribution of use of water withdrawn from surface and groundwater sources. For example, in Canada, in 2005, 42 billion m3 of withdrawn water were used, of which about 38 billion m3 were freshwater. Distribution of this use among sectors was: thermoelectric power generation 66.2%, manufacturing 13.6%, residential 9.0%, agriculture 4.7%, commercial and institutional 2.7%, water treatment and distribution systems 2.3%, mining 1.1%, and oil and gas extraction 0.5%. The 38 billion m3 of freshwater withdrawn in that year can be compared with the nation's annual freshwater yield (estimated as streamflow) of 3,472 billion m3.[71] Sectoral distribution is different in many respects in the US, where agriculture accounts for about 39% of fresh water withdrawals, thermoelectric power generation 38%, industrial 4%, residential 1%, and mining (including oil and gas) 1%.[72]
Within the agricultural sector, withdrawn water use is for irrigation and for livestock. Whereas all irrigation in the US (including loss in conveyance of irrigation water) is estimated to account for about 38 percent of US withdrawn freshwater use,[72] the irrigation water used for production of livestock feed and forage has been estimated to account for about 9 percent,[73] and other withdrawn freshwater use for the livestock sector (for drinking, washdown of facilities, etc.) is estimated at about 0.7 percent.[72] Because agriculture is a major user of withdrawn water, changes in the magnitude and efficiency of its water use are important. In the US, from 1980 (when agriculture's withdrawn water use peaked) to 2010, there was a 23 percent reduction in agriculture's use of withdrawn water,[72] while US agricultural output increased by 49 percent over that period.[74]
In the US, irrigation water application data are collected in the quinquennial Farm and Ranch Irrigation Survey, conducted as part of the Census of Agriculture. Such data indicate great differences in irrigation water use within various agricultural sectors. For example, about 14 percent of corn-for-grain land and 11 percent of soybean land in the US are irrigated, compared with 66 percent of vegetable land, 79 percent of orchard land and 97 percent of rice land.[75][76]
See also
References
- "Water footprints of nations: Water use by people as a function of their consumption pattern" (PDF). Water Footprint Network. Archived from the original (PDF) on 17 April 2018. Retrieved 3 March 2018.
- "Waterfootprint.org: Water footprint and virtual water". The Water Footprint Network. Archived from the original on 8 April 2015. Retrieved 9 April 2014.
- Definition taken from the Hoekstra, A.Y. and Chapagain, A.K. (2008) Globalization of water: Sharing the planet's freshwater resources, Blackwell Publishing, Oxford, UK.
- "What is a water footprint? – Water Footprint Network". Retrieved 2023-10-17.
- "16030, 1841-01-13, PERROT (fabrique)". Art Sales Catalogues Online. doi:10.1163/2210-7886_asc-16030. Retrieved 2021-10-25.
- "What is a water footprint?". The Water Footprint Network. Retrieved 8 March 2018.
- Liu, Jing; Wu, Mengyang; Yu, Zhongbo (November 2018). "Evaluation of Environmental Impacts Due to Blue Water Consumption in China from Production and Consumption Perspectives". International Journal of Environmental Research and Public Health. 15 (11): 2445. doi:10.3390/ijerph15112445. ISSN 1661-7827. PMC 6267180. PMID 30400166.
- "What is water footprint assessment? – Water Footprint Network". Retrieved 2023-10-11.
- "ScienceDirect.com | Science, health and medical journals, full text articles and books". www.sciencedirect.com. Retrieved 2023-10-17.
- "The Value of Rainwater: Why Green Water Footprints Matter". Water Footprint Calculator. Retrieved 2023-10-11.
- "Water footprint and why it is important". LiveAbout. Retrieved 2023-10-11.
- "ScienceDirect.com | Science, health and medical journals, full text articles and books". www.sciencedirect.com. Retrieved 2023-10-17.
- "The Water Footprint Assessment Manual". Water Footprint Network. Archived from the original on 2015-02-10. Retrieved 2015-01-20.
- Lacota, Dominique. "Benefits of Greywater Recycling Systems | Global Water". www.globalwatergroup.com.au. Retrieved 2023-10-11.
- Fox, Audrey (2022-05-18). "What is Gray Water?". Friends of the Earth. Retrieved 2023-10-11.
- "ScienceDirect.com | Science, health and medical journals, full text articles and books". www.sciencedirect.com. Retrieved 2023-10-17.
- Postel, Sandra (August 15, 2012). "Our Oversized Groundwater Footprint". resilience.
- "The how and why of measuring your water footprint". www.stantec.com. Retrieved 2023-10-16.
- "What is a Flow Meter?". Max Precision Flow Meters. Retrieved 2023-10-18.
- "Evapotranspiration - an overview | ScienceDirect Topics". www.sciencedirect.com. Retrieved 2023-10-18.
- "Water Quality Test Kits - Water Quality Testing". www.acornnaturalists.com. Retrieved 2023-10-18.
- "Soil moisture sensors for irrigation scheduling". extension.umn.edu. Retrieved 2023-10-18.
- "Water Footprint Network - Aims & history". Water Footprint Network. Retrieved 27 January 2018.
- Jayne M. Godfrey, Keryn Chalmers. 2012 Water Accounting: International Approaches to Policy and Decision-making. Edward Elgar Publishing. page222
- Hoekstra, A.Y. (2003) (ed) Virtual water trade: Proceedings of the International Expert Meeting on Virtual Water Trade, IHE Delft, the Netherlands
- http://www.waterfootprint.org/Reports/Report16Vol1.pdf
- Globalization of Water, A.Y. Hoekstra and A.K. Chapagain, Blackwell, 2008
- Hoekstra, Arjen (2011). The water footprint assessment manual: Setting the global standard (PDF). London: Earthscan. ISBN 978-1-84971-279-8.
- "ISO 14046:2014 Environmental management -- Water footprint -- Principles, requirements and guidelines". International Organization for Standardization. Retrieved 4 March 2018.
- Scientific Applications International Corporations (SAIC) (2006). Life Cycle Assessment: Principles and Practice. Reston, VA: SAIC.
- Pfister, Stephan; Koehler, Annette; Hellweg, Stefanie (20 March 2009). "Assessing the Environmental Impacts of Freshwater Consumption in LCA". Environmental Science. 43 (11): 4008–104. Bibcode:2009EnST...43.4098P. doi:10.1021/es802423e. PMID 19569336.
- Pfister, Stephan; Boulay, Anne-Marie; Berger, Markus; Hadjikakou, Michalis; Motoshita, Masaharu; Hess, Tim; Ridoutt, Brad; Weinzettel, Jan; Scherer, Laura; Döll, Petra; Manzardo, Alessandro; Núñez, Montserrat; Verones, Francesca; Humbert, Sebastien; Buxmann, Kurt; Harding, Kevin; Benini, Lorenzo; Oki, Taikan; Finkbeiner, Matthias; Henderson, Andrew (January 2017). "Understanding the LCA and ISO water footprint: A response to Hoekstra (2016) "A critique on the water-scarcity weighted water footprint in LCA"". Ecological Indicators. 72: 352–359. doi:10.1016/J.ECOLIND.2016.07.051. PMC 6192425. PMID 30344449.
- Chapagain & Mekonnen, Ashok & Mesfin (2023). "Towards Fair Water Footprints" (PDF). Chapagain Consulting LTD. Journal. V2 (2): 59 – via Chapagain Consulting Ltd.
- Hepworth, Nick (2010). "DROP BY DROP: Understanding the Impacts of the UK's Water Footprint Through a Case Study of Peruvian Asparagus" (PDF). Progressio. 1 (1): 90.
- Hepworth, Nick; Narte, Rami; Neumand, Serge (August 16, 2021). "How Fair is Fashion's Water Footprint?" (PDF). Water Witness International. 1 (1): 14.
- "About Us". Fair Water Footprints. Retrieved 2023-10-12.
- "Glasgow Declaration for Fair Water Footprints at COP26". Water Witness International | Action, Research & Advocacy for a Fair Water Future. 2021-11-03. Retrieved 2023-10-17.
- Schneider, U.; et al. (2014). "GPCC's new land surface precipitation climatology based on quality-controlled in-situ data and its role in quantifying the global water cycle". Theoretical and Applied Climatology. 115 (1–2): 15–40. Bibcode:2014ThApC.115...15S. doi:10.1007/s00704-013-0860-x.
- FAO. Water use. http://www.fao.org/nr/water/aquastat/water_use/index.stm#tables
- Frenken, K. and V. Gillet. 2012. Irrigation water requirement and water withdrawal by country. AQUASTAT, FAO.
- FAO. 2014. Water withdrawal by sector, around 2007. http://www.fao.org/nr/water/aquastat/tables/WorldData-Withdrawal_eng.pdf
- "Looming water crisis simply a management problem" by Jonathan Chenoweth, New Scientist 28 Aug., 2008, pp. 28-32.
- Ritchie, Hannah; Roser, Max (2017-11-20). "Water Use and Stress". Our World in Data.
- "WFN Glossary". Archived from the original on 2015-04-01. Retrieved 2012-10-02.
- "WaterStat". Archived from the original on 2015-04-01. Retrieved 2012-10-02.
- Chinnasamy, Pennan; Agoramoorthy, Govindasamy (2015-05-01). "Groundwater Storage and Depletion Trends in Tamil Nadu State, India". Water Resources Management. 29 (7): 2139–2152. doi:10.1007/s11269-015-0932-z. ISSN 1573-1650. S2CID 54761901.
- Vanham, D., M. M.Mekonnen and A. Y. Hoekstra. 2013. The water footprint of the EU for different diets. Ecological Indicators 32: 1-8.
- Mekonnen, M. M. and A. Y. Hoekstra. 2010. The green, blue and grey water footprint of farm animals and animal products. Volume 1: Main report. UNESCO-IHE., Institute for Water Education. 50 pp.
- Mekonnen, M. M. and A. Y. Hoekstra. 2010. The green, blue and grey water footprint of crops and derived crop products. Volume 2. Appendices main report. Value of Water Research Report Series No. 47. UNESCO-IHE Institute for Water Education. 1196 pp.
- "How much water does it take to grow an avocado?". Danwatch.dk. 2019. Archived from the original on 7 October 2019. Retrieved 7 October 2019.
- "Water, water everywhere... or is it?", The Carbon Trust, 26 November 2014. Retrieved on 20 January 2015.
- "2013 Water Report: The Coca-Cola Company". The Coca-Cola Company. Archived from the original on 19 April 2014. Retrieved 8 April 2014.
- Naumann, Ruth (2011). Sustainability (1st ed.). North Shore, N.Z.: Cengage Learning. pp. 56–58. ISBN 978-017021-034-8.
- Hoekstra, AY (2012). "The Water Footprint of Humanity" (PDF). PNAS. 109 (9): 3232–3237. Bibcode:2012PNAS..109.3232H. doi:10.1073/pnas.1109936109. PMC 3295316. PMID 22331890.
- Data obtained from the Finnish Wikipedia article page Vesijalanjälki
- Chapagain, A.K. & Orr, S. "U.K. Water Footprint: The Impact of the U.K.'s Food and Fibre Consumption on Global Water Resources, Volume 1" (PDF). WWF-UK. and volume 2 Chapagain, A.K. & Orr, S. "Volume 2" (PDF). WWF-UK.
- "The Water Footprint of Humanity". JournalistsResource.org, retrieved 20 March 2012
- "National water footprint". waterfootprint.org. Retrieved 10 March 2018.
- "Angela Morelli - The Global Water Footprint of Humanity". TEDxOslo.
{{cite web}}: Missing or empty|url=(help) - Hoekstra, Arjen Y.; Mekonnen, Mesfin M. (28 February 2012). "The water footprint of humanity". PNAS. 109 (9): 3232–3237. Bibcode:2012PNAS..109.3232H. doi:10.1073/pnas.1109936109. PMC 3295316. PMID 22331890.
- Boretti, Alberto; Rosa, Lorenzo (2019-07-31). "Reassessing the projections of the World Water Development Report". npj Clean Water. 2 (1): 1–6. doi:10.1038/s41545-019-0039-9. ISSN 2059-7037. S2CID 198997365.
- Saving water with wind energy, EWEA June 2014
- "Saving water with wind energy Summary EWEA". EWEA.org. Retrieved 5 May 2017.
- "California State Water Project-Water Supply". www.Water.ca.gov. Archived from the original on 7 April 2017. Retrieved 5 May 2017.
- Wichelns, Dennis (2010). "Virtual water and water footprints offer limited insight regarding important policy questions". International Journal of Water Resources Development. 26 (4): 639–651. doi:10.1080/07900627.2010.519494. S2CID 154664691. Retrieved 21 January 2015.
- Haie, N.; Freitas, M.R.; Pereira, J.C. (2018). "Integrating Water Footprint and Sefficiency: Overcoming Water Footprint Criticisms and Improving Decision Making". Water Alternatives. 11: 933–956.
- "Policies and measure to promote sustainable water use". Europeanm Environment Agency. 18 February 2008. Retrieved 26 April 2016.
- e Ahukaramū Charles Royal (22 September 2012). "Tangaroa – the sea - Water as the source of life". Encyclopaedia of New Zealand.
- Water Consumption and Sustainable Water Resources Management. OECD Library. 25 March 1998. ISBN 9789264162648. Retrieved 26 April 2016.
- Haie, Naim (2020). Transparent Water Management Theory: Sefficiency in Sequity (PDF). Springer.
- Statistics Canada. 2010. Human activity and the environment. Freshwater supply and demand in Canada. Catalogue no. 16-201-X.
- Maupin, M. A. et al. 2014. Estimated use of water in the United States 2010. U. S. Geological Survey Circular 1405. 55 pp.
- Zering, K. D., T. J. Centner, D. Meyer, G. L. Newton, J. M. Sweeten and S. Woodruff. 2012. Water and land issues associated with animal agriculture: a U.S. perspective. CAST Issue Paper No. 50. Council for Agricultural Science and Technology, Ames, Iowa. 24 pp.
- "USDA ERS - Agricultural Productivity in the U.S." www.ERS.USDA.gov. Retrieved 5 May 2017.
- US Department of Agriculture. 2009. 2007 Census of agriculture. Farm and ranch irrigation survey (2008). Volume 3. Special Studies. Part 1. AC-07-SS-1. 177 pp. + appendices.
- USDA. 2009. 2007 Census of agriculture. United States summary and State Data. Vol. 1. Geographic Area Series. Part 51. AC-07-A-51. 639 pp. + appendices.
External links
| Overviews | Water droplet | |
|---|---|---|
| States | ||
| Forms | ||
| On Earth | ||
| Extraterrestrial | ||
| Physical parameters | ||
| ||
| Air |
| ||||
|---|---|---|---|---|---|
| Energy | |||||
| Land | |||||
| Life | |||||
| Water |
| ||||
| Related |
| ||||
| |||||