West Vancouver—Sunshine Coast—Sea to Sky Country
West Vancouver—Sunshine Coast—Sea to Sky Country (formerly West Vancouver—Sunshine Coast) is a federal electoral district in British Columbia, Canada, that has been represented in the House of Commons of Canada since 1997.
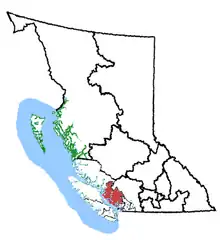 West Vancouver—Sunshine Coast—Sea to Sky Country in relation to the other British Columbia ridings | |||
| Federal electoral district | |||
| Legislature | House of Commons | ||
| MP |
Liberal | ||
| District created | 1996 | ||
| First contested | 1997 | ||
| Last contested | 2021 | ||
| District webpage | profile, map | ||
| Demographics | |||
| Population (2011)[1] | 112,875 | ||
| Electors (2019) | 63,501 | ||
| Area (km²)[1] | 13,237 | ||
| Pop. density (per km²) | 8.5 | ||
| Census subdivision(s) | Whistler, Squamish, Pemberton, West Vancouver, Lions Bay, Sechelt, Bowen Island, Gibsons | ||
Geography
The district includes the regional districts of Sunshine Coast, the southern portion of the Squamish–Lillooet Regional District, including the municipalities of Whistler, Squamish, Pemberton; and West Vancouver, Lions Bay and Bowen Island, which are in the Metro Vancouver Regional District.
Demographics
| Panethnic group |
2021[2] | 2016[3] | 2011[4] | |||||||||||
|---|---|---|---|---|---|---|---|---|---|---|---|---|---|---|
| Pop. | % | Pop. | % | Pop. | % | |||||||||
| European[lower-alpha 1] | 92,880 | 72.09% | 87,080 | 74.65% | 87,300 | 78.79% | ||||||||
| East Asian[lower-alpha 2] | 12,610 | 9.79% | 11,245 | 9.64% | 7,710 | 6.96% | ||||||||
| Indigenous | 7,150 | 5.55% | 6,630 | 5.68% | 5,495 | 4.96% | ||||||||
| Middle Eastern[lower-alpha 3] | 6,410 | 4.97% | 4,760 | 4.08% | 4,035 | 3.64% | ||||||||
| South Asian | 3,665 | 2.84% | 2,820 | 2.42% | 2,485 | 2.24% | ||||||||
| Southeast Asian[lower-alpha 4] | 3,055 | 2.37% | 2,450 | 2.1% | 2,220 | 2% | ||||||||
| Latin American | 1,175 | 0.91% | 635 | 0.54% | 405 | 0.37% | ||||||||
| African | 760 | 0.59% | 465 | 0.4% | 565 | 0.51% | ||||||||
| Other[lower-alpha 5] | 1,145 | 0.89% | 575 | 0.49% | 590 | 0.53% | ||||||||
| Total responses | 128,845 | 98.2% | 116,650 | 97.93% | 110,805 | 98.17% | ||||||||
| Total population | 131,206 | 100% | 119,113 | 100% | 112,875 | 100% | ||||||||
| Notes: Totals greater than 100% due to multiple origin responses. Demographics based on 2012 Canadian federal electoral redistribution riding boundaries. | ||||||||||||||
- According to the Canada 2016 Census; 2013 representation[5][6]
Languages: 76.9% English, 4.4% Mandarin, 3.8% Persian, 2.4% French, 1.9% German, 1.0% Punjabi,
Religions (2011): 42.4% Christian (13.3% Catholic, 8.6% Anglican, 6.8% United Church, 1.6% Baptist, 1.5% Lutheran, 1.1% Presbyterian, 9.5% Other), 3.3% Muslim, 1.3% Buddhist, 1.0% Jewish, 1.0% Sikh, 49.3% No religion
Median income (2015): $35,774
Average income (2015): $65,168
History
The electoral district was created as "West Vancouver–Sunshine Coast" in 1996 from parts of Capilano—Howe Sound and North Island—Powell River ridings.
In 2003, it was renamed "West Vancouver—Sunshine Coast—Sea to Sky Country". At 48 characters, this was the current longest riding name in Canada until 2015, when it was overtaken by the renamed, 49-character Leeds—Grenville—Thousand Islands and Rideau Lakes.
The riding or electoral district is also the first to have been represented in Parliament by a member of the Green Party, Blair Wilson. Elected as part of the Liberal party, he crossed the floor later in his career to become a member of the Green Party representing West Vancouver—Sunshine Coast—Sea to Sky Country. However, this came immediately before the 2008 federal election, in which he was defeated, and he never had the opportunity to sit in the House as a Green MP.
The 2012 federal electoral boundaries redistribution concluded that the electoral boundaries of West Vancouver—Sunshine Coast—Sea to Sky Country should be adjusted, and a modified electoral district of the same name would be contested in future elections.[7] The redefined West Vancouver—Sunshine Coast—Sea to Sky Country:
- loses the Powell River Regional District to the district of North Island—Powell River;
- regains the community of Pemberton and area that had been transferred from it to Chilliwack—Fraser Canyon in the previous redistribution; and
- sees its boundary with North Vancouver adjusted to correspond to the boundaries between the District of North Vancouver, West Vancouver and the Capilano Indian Reserve.
These new boundaries were legally defined in the 2013 representation order, which came into effect upon the call of the 42nd Canadian federal election, scheduled for October 2015.[8]
Members of Parliament
This riding has elected the following Members of Parliament:
| Parliament | Years | Member | Party | |
|---|---|---|---|---|
| West Vancouver—Sunshine Coast Riding created from Capilano—Howe Sound and North Island—Powell River |
||||
| 36th | 1997–2000 | John Reynolds | Reform | |
| 2000–2000 | Alliance | |||
| 37th | 2000–2003 | |||
| 2003–2004 | Conservative | |||
| West Vancouver—Sunshine Coast—Sea to Sky Country | ||||
| 38th | 2004–2006 | John Reynolds | Conservative | |
| 39th | 2006–2007 | Blair Wilson | Liberal | |
| 2007–2008 | Independent | |||
| 2008–2008 | Green | |||
| 40th | 2008–2011 | John Weston | Conservative | |
| 41st | 2011–2015 | |||
| 42nd | 2015–2019 | Pamela Goldsmith-Jones | Liberal | |
| 43rd | 2019–2021 | Patrick Weiler | ||
| 44th | 2021–present | |||
Current Member of Parliament
Patrick Weiler is the current Member of Parliament for this riding. He was elected after the incumbent, Pamela Goldsmith-Jones chose not to run for re-election in the 2019 federal election.
Former Members of Parliament
The first Member of Parliament to represent the riding was John Reynolds, a former sales and marketing consultant. He was first elected in the 1997 election. He was a member of the Reform Party, and its successors the Canadian Alliance and the Conservative Party. He served as a member on the Standing Committee on Procedure and House Affairs. Reynolds did not run in the 2006 general election.
Liberal Blair Wilson was elected in the 2006 federal election. Wilson, a chartered accountant and a former restaurant owner,[9] was the first Liberal MP for the historically Conservative riding. He lost to former MP John Reynolds in the 2004 federal election. Wilson resigned from caucus in October 2007 after allegations of improper campaign spending and failure to mention several legal and financial troubles during three nomination vetting processes.[10] He remained a Liberal but not in caucus. In January 2008, Wilson became an Independent. He then joined the Green Party on August 30, 2008, becoming its first MP. Running under the Green banner in the election called only days later, he was defeated by Conservative John Weston. John Weston was defeated by Pamela Goldsmith-Jones on October 19, 2015.In the 2019 federal election, Patrick Weiler won for the Liberals after Goldsmith-Jones did not run for re-election.
Election results
West Vancouver—Sunshine Coast—Sea to Sky Country
| 2021 Canadian federal election | ||||||||
|---|---|---|---|---|---|---|---|---|
| Party | Candidate | Votes | % | ±% | Expenditures | |||
| Liberal | Patrick Weiler | 21,500 | 33.9 | $107,414.31 | ||||
| Conservative | John Weston | 19,062 | 30.0 | $123,189.13 | ||||
| New Democratic | Avi Lewis | 16,265 | 25.6 | $117,546.51 | ||||
| Green | Mike Simpson | 4,108 | 6.5 | $35,992.60 | ||||
| People's | Doug Bebb | 2,299 | 3.6 | $26,851.53 | ||||
| Rhinoceros | Gordon Jeffrey | 98 | 0.2 | $0.00 | ||||
| Independent | Chris MacGregor | 77 | 0.1 | $0.00 | ||||
| Independent | Terry Grimwood | 50 | 0.1 | $0.00 | ||||
| Total valid votes/Expense limit | 63,459 | – | – | $131,270.20 | ||||
| Total rejected ballots | 279 | |||||||
| Turnout | 64.6% | |||||||
| Eligible voters | 98,256 | |||||||
| Source: Elections Canada[11] | ||||||||
| 2019 Canadian federal election | ||||||||
|---|---|---|---|---|---|---|---|---|
| Party | Candidate | Votes | % | ±% | Expenditures | |||
| Liberal | Patrick Weiler | 22,673 | 34.89 | -19.73 | $117,192.92 | |||
| Conservative | Gabrielle Loren | 17,359 | 26.71 | +0.52 | $110,144.62 | |||
| Green | Dana Taylor | 14,579 | 22.44 | +13.55 | $61,513.07 | |||
| New Democratic | Judith Wilson | 9,027 | 13.89 | +4.03 | $5,518.93 | |||
| People's | Robert Douglas Bebb | 1,010 | 1.55 | $20,418.15 | ||||
| Rhinoceros | Gordon Jeffrey | 173 | 0.27 | none listed | ||||
| Independent | Terry Grimwood | 159 | 0.24 | $0.00 | ||||
| Total valid votes/expense limit | 64,980 | 99.49 | ||||||
| Total rejected ballots | 335 | 0.51 | +0.25 | |||||
| Turnout | 65,315 | 68.47 | -5.11 | |||||
| Eligible voters | 95,395 | |||||||
| Liberal hold | Swing | -10.12 | ||||||
| Source: Elections Canada[12][13] | ||||||||
| 2015 Canadian federal election | ||||||||
|---|---|---|---|---|---|---|---|---|
| Party | Candidate | Votes | % | ±% | Expenditures | |||
| Liberal | Pamela Goldsmith-Jones | 36,300 | 54.62 | +30.81 | $180,025.50 | |||
| Conservative | John Weston | 17,411 | 26.20 | -19.59 | $199,351.34 | |||
| New Democratic | Larry Koopman | 6,554 | 9.86 | -11.61 | – | |||
| Green | Ken Melamed | 5,907 | 8.89 | +1.26 | $129,042.88 | |||
| Marijuana | Robin Kehler | 180 | 0.27 | – | $176.40 | |||
| Marxist–Leninist | Carol-Lee Chapman | 106 | 0.16 | – | – | |||
| Total valid votes/expense limit | 66,458 | 99.74 | $241,170.76 | |||||
| Total rejected ballots | 173 | 0.26 | – | |||||
| Turnout | 66,631 | 73.58 | – | |||||
| Eligible voters | 90,554 | |||||||
| Liberal gain from Conservative | Swing | +25.20 | ||||||
| Source: Elections Canada[14][15][16] | ||||||||
| 2011 federal election redistributed results[17] | |||
|---|---|---|---|
| Party | Vote | % | |
| Conservative | 23,840 | 45.79 | |
| Liberal | 12,395 | 23.81 | |
| New Democratic | 11,177 | 21.47 | |
| Green | 3,971 | 7.63 | |
| Others | 680 | 1.31 | |
| 2011 Canadian federal election | ||||||||
|---|---|---|---|---|---|---|---|---|
| Party | Candidate | Votes | % | ±% | ||||
| Conservative | John Weston | 28,614 | 45.53 | +0.96 | ||||
| New Democratic | Terry Platt | 14,828 | 23.59 | +9.16 | ||||
| Liberal | Daniel Veniez | 14,123 | 22.47 | -4.10 | ||||
| Green | Brennan Wauters | 4,436 | 7.06 | -7.37 | ||||
| Progressive Canadian | Roger Lagassé | 293 | 0.47 | – | ||||
| Libertarian | Tunya Audain | 250 | 0.40 | – | ||||
| Western Block | Allan Holt | 156 | 0.25 | – | ||||
| Marxist–Leninist | Carol Lee Chapman | 87 | 0.14 | – | ||||
| Canadian Action | Doug Hartt | 64 | 0.10 | – | ||||
| Total valid votes | 62,851 | 100.0 | ||||||
| Total rejected ballots | 221 | 0.35 | +0.01 | |||||
| Turnout | 63,072 | 64.17 | -0.28 | |||||
| Eligible voters | 98,293 | |||||||
| Conservative hold | Swing | -4.10 | ||||||
| 2008 Canadian federal election | ||||||||
|---|---|---|---|---|---|---|---|---|
| Party | Candidate | Votes | % | ±% | Expenditures | |||
| Conservative | John Weston | 26,949 | 44.57 | +8.60 | $94,785 | |||
| Liberal | Ian Sutherland | 16,069 | 26.57 | -10.93 | $74,135 | |||
| New Democratic | Bill Forst | 8,728 | 14.43 | -5.63 | $18,762 | |||
| Green | Blair Wilson | 8,723 | 14.43 | +8.20 | $95,067 | |||
| Total valid votes/Expense limit | 60,469 | 100.0 | $100,350 | |||||
| Total rejected ballots | 208 | 0.34 | +0.12 | |||||
| Turnout | 60,677 | 64.45 | -4.10 | |||||
| Conservative gain from Green | Swing | +9.76 | ||||||
| Green candidate Blair Wilson lost 23.07 percentage points from his 2006 performance as a Liberal. | ||||||||
| 2006 Canadian federal election | ||||||||
|---|---|---|---|---|---|---|---|---|
| Party | Candidate | Votes | % | ±% | Expenditures | |||
| Liberal | Blair Wilson | 23,867 | 37.50 | +4.99 | $82,304 | |||
| Conservative | John Weston | 22,881 | 35.97 | +0.68 | $86,639 | |||
| New Democratic | Judith Wilson | 12,766 | 20.06 | -1.66 | $50,621 | |||
| Green | Silvaine Zimmermann | 3,966 | 6.23 | -3.49 | $3,532 | |||
| Marxist–Leninist | Anne Jamieson | 155 | 0.22 | +0.02 | $0 | |||
| Total valid votes | 63,635 | 100.0 | ||||||
| Total rejected ballots | 144 | 0.23 | ±0 | |||||
| Turnout | 63,779 | |||||||
| Liberal gain from Conservative | Swing | +2.84 | ||||||
| 2004 Canadian federal election | ||||||||
|---|---|---|---|---|---|---|---|---|
| Party | Candidate | Votes | % | ±% | Expenditures | |||
| Conservative | John Reynolds | 21,372 | 35.29 | -22.04 | $81,933 | |||
| Liberal | Blair Wilson | 19,685 | 32.51 | +5.91 | $81,023 | |||
| New Democratic | Nicholas Simons | 13,156 | 21.72 | +15.43 | $29,779 | |||
| Green | Andrea Goldsmith | 5,887 | 9.72 | +4.83 | $28,167 | |||
| Canadian Action | Marc Bombois | 321 | 0.53 | -1.30 | $117 | |||
| Marxist–Leninist | Anne Jamieson | 123 | 0.20 | – | ||||
| Total valid votes | 60,544 | 100.0 | ||||||
| Total rejected ballots | 139 | 0.23 | -0.06 | |||||
| Turnout | 60,683 | 66.00 | +2.81 | |||||
| Conservative notional hold | Swing | -13.98 | ||||||
| Conservative change is from the combination of Progressive Conservative and Canadian Alliance vote. | ||||||||
West Vancouver—Sunshine Coast
| 2000 Canadian federal election | ||||||||
|---|---|---|---|---|---|---|---|---|
| Party | Candidate | Votes | % | ±% | Expenditures | |||
| Alliance | John Reynolds | 25,546 | 47.96 | +7.91 | $65,492 | |||
| Liberal | Ian McKay | 14,169 | 26.60 | -7.92 | $60,517 | |||
| Progressive Conservative | Kate Manvell | 4,993 | 9.37 | +1.01 | $5,777 | |||
| New Democratic | Telis Savvaidis | 3,351 | 6.29 | -5.64 | $9,069 | |||
| Green | Jane Bishop | 2,605 | 4.89 | +0.27 | $3,816 | |||
| Marijuana | Dana Larsen | 1,618 | 3.03 | – | ||||
| Canadian Action | Marc Bombois | 976 | 1.83 | – | $3,227 | |||
| Total valid votes | 53,258 | 100.0 | ||||||
| Total rejected ballots | 155 | 0.29 | -0.11 | |||||
| Turnout | 53,413 | 63.81 | -2.99 | |||||
| Alliance hold | Swing | +7.92 | ||||||
| Canadian Alliance change is based on the Reform Party vote. | ||||||||
| 1997 Canadian federal election | ||||||||
|---|---|---|---|---|---|---|---|---|
| Party | Candidate | Votes | % | Expenditures | ||||
| Reform | John Reynolds | 20,092 | 40.05 | $62,107 | ||||
| Liberal | Phil Boname | 17,318 | 34.52 | $62,278 | ||||
| New Democratic | Clark Banks | 5,988 | 11.93 | $9,548 | ||||
| Progressive Conservative | Dave Thomas | 4,194 | 8.36 | $36,317 | ||||
| Green | Lisa Barrett | 2,318 | 4.62 | $935 | ||||
| Natural Law | David Grayson | 254 | 0.50 | |||||
| Total valid votes | 50,164 | 100.0 | ||||||
| Total rejected ballots | 199 | 0.40 | ||||||
| Turnout | 50,363 | 66.80 | ||||||
| This riding was created from parts of Capilano—Howe Sound and North Island—Powell River, both of which elected Reform candidates in the last election. John Reynolds was the incumbent from North Island—Powell River. | ||||||||
See also
Notes
- Statistic includes all persons that did not make up part of a visible minority or an indigenous identity.
- Statistic includes total responses of "Chinese", "Korean", and "Japanese" under visible minority section on census.
- Statistic includes total responses of "West Asian" and "Arab" under visible minority section on census.
- Statistic includes total responses of "Filipino" and "Southeast Asian" under visible minority section on census.
- Statistic includes total responses of "Visible minority, n.i.e." and "Multiple visible minorities" under visible minority section on census.
References
- Statistics Canada: 2012
- Government of Canada, Statistics Canada (October 26, 2022). "Census Profile, 2021 Census of Population". www12.statcan.gc.ca. Retrieved February 16, 2023.
- Government of Canada, Statistics Canada (October 27, 2021). "Census Profile, 2016 Census". www12.statcan.gc.ca. Retrieved February 16, 2023.
- Government of Canada, Statistics Canada (November 27, 2015). "NHS Profile". www12.statcan.gc.ca. Retrieved February 16, 2023.
- Source:
- "National Household Survey (NHS) Profile, 2011". Archived from the original on February 12, 2015. Retrieved December 7, 2014.
- Final Report – British Columbia
- Timeline for the Redistribution of Federal Electoral Districts
- "Canada.Com | Homepage | Canada.Com". ocanada.
- "Liberal party bars B.C. MP from nomination". thestar.com. December 23, 2007.
- "List of confirmed candidates – September 20, 2021 Federal Election". Elections Canada. Retrieved September 2, 2021.
- "List of confirmed candidates". Elections Canada. Retrieved October 4, 2019.
- "Election Night Results". Elections Canada. Retrieved May 17, 2021.
- Elections Canada – Confirmed candidates for West Vancouver—Sunshine Coast—Sea to Sky Country, 30 September 2015
- Elections Canada – Final Candidates Election Expenses Limits
- Elections Canada – Forty-Second General Election 2015 - Poll-by-poll results
- Pundits' Guide to Canadian Elections
Sources
- "West Vancouver—Sunshine Coast—Sea to Sky Country (Code 59036) Census Profile". 2011 census. Government of Canada - Statistics Canada. Retrieved March 6, 2011.
- Library of Parliament Riding Profile (1996–2003)
- Library of Parliament Riding Profile (2003–present)
- Expenditures – 2004
- Expenditures – 2000
- Expenditures – 1997